Coterra (CTRA) Has Dropped in 7 of 8 Midterm Windows, With Shorts Averaging 14% Profit
Coterra is heading into a historically bearish midterm-election seasonal window just as the stock trades well below its recent high, raising the stakes for energy traders watching this next 137-day stretch.

What is the seasonal pattern for Coterra (CTRA)?
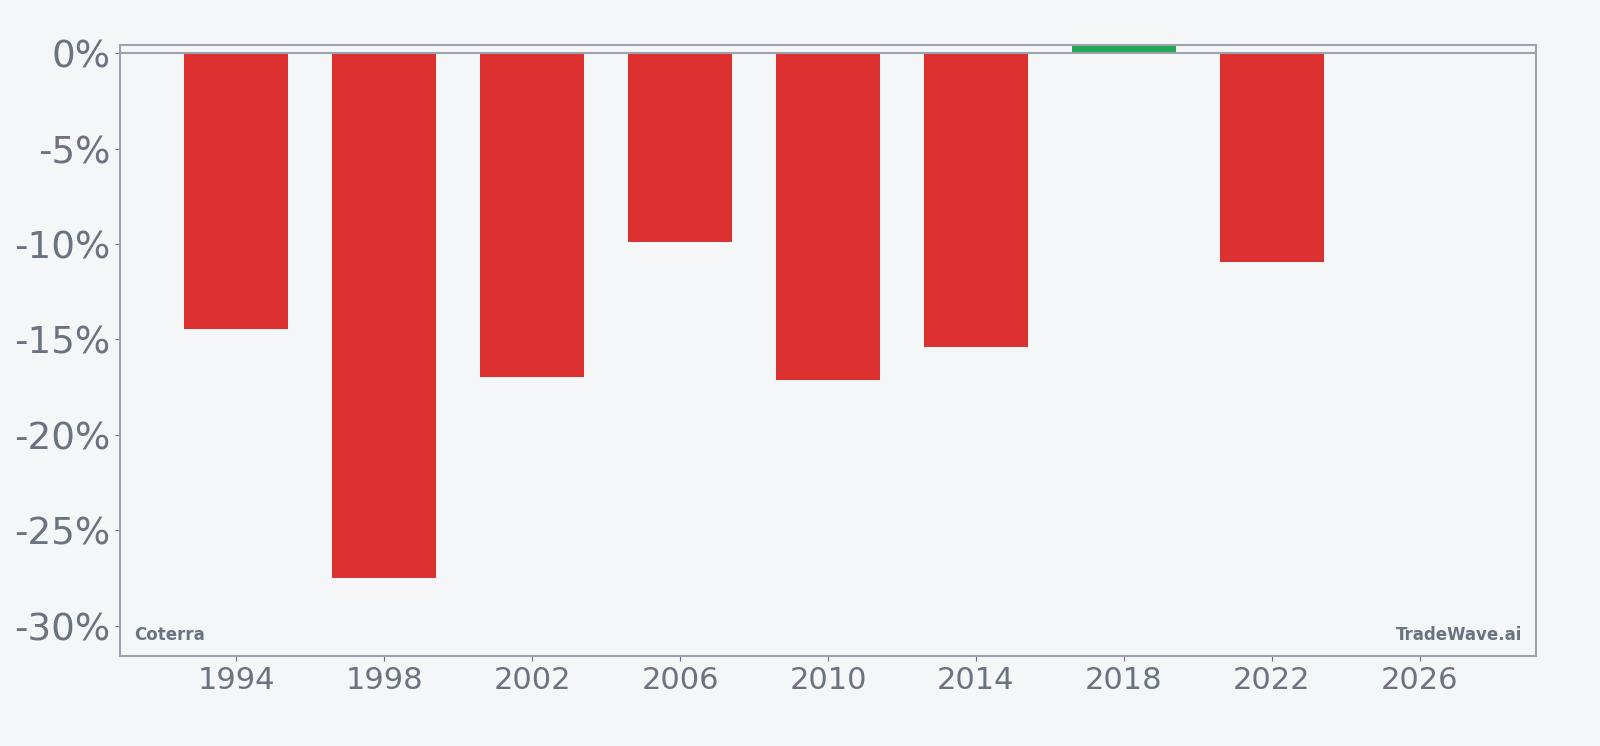
Coterra has fallen in 7 of 8 midterm-election-year windows starting around May 12, with an average 16.03% gain in winning short trades.
- 7 wins and 1 loss for short trades in this window, with winning years averaging 16.03% moves in the trade direction.
- The upcoming 137-day window begins May 12 and has historically been a bearish seasonal stretch for Coterra in midterm election years.
- Percent Profitable sits at 88%, with 7 winners and 1 loser across the last 8 qualifying cycles.
- Average profit across all years, including the lone losing season, is still a strong 14%, underscoring the depth of prior declines.
- The TradeWave Ratio of 1.87 signals that price has typically traveled meaningfully in the short direction within the window, even before final outcomes.
- Intraperiod swings have been sizable, with some years showing double-digit adverse moves before the short-side trend reasserted itself.
According to historical data from TradeWave.ai, this midterm-election stretch has behaved very differently from an average calendar quarter for Coterra, and the next iteration is only days away.
How has Coterra (CTRA) traded in past midterm-year windows?
Coterra has fallen in 7 of the last 8 midterm-election-year windows that start around May 12 and run for 137 trading days, making this one of its most consistently bearish seasonal stretches. Shares finished the latest session at 32.56, down 8.6% on the day and about 11.7% below the 52-week high of 36.88, with the stock still well above its 52-week low near 21.30.
Grouping the data by the presidential election cycle matters here because this pattern only shows up in midterm years, not across random calendar slices. The current calendar phase is the midterm election year, and this window runs deep into the year before the presidential election, a period when policy debates on regulation, drilling permits and energy infrastructure often intensify for U.S. oil and gas producers.
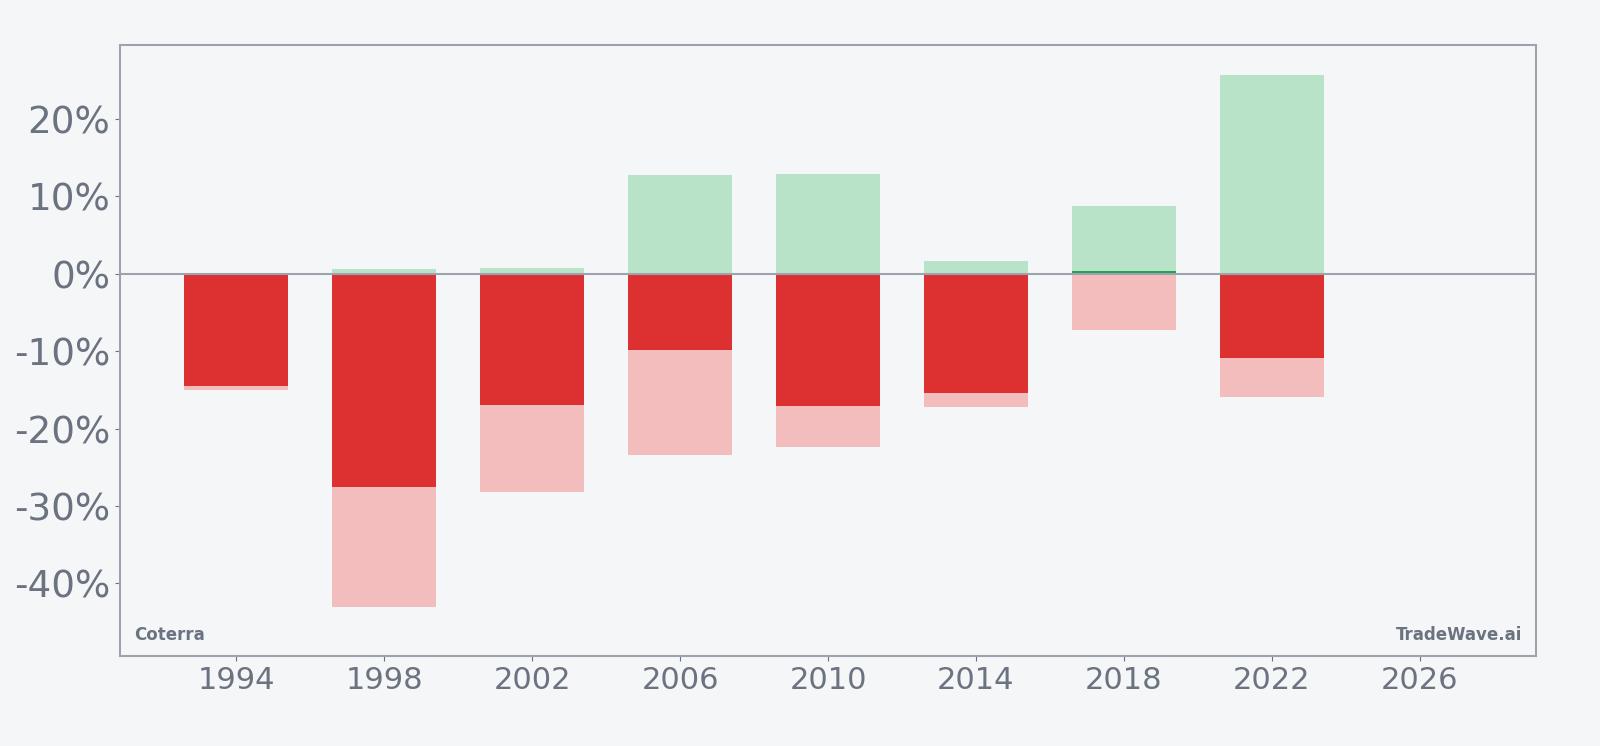
A stacked view of net returns alongside best and worst intraperiod swings shows how far Coterra has tended to move inside this window.
Across the eight midterm-election-year samples, the short-side bias is clear. Percent Profitable is 88%, with 7 winning short trades and only 1 losing year, and the average profit across all years is 14%, only slightly below the 16.03% average for winners, which means the lone loss was relatively modest. The median outcome of 14.92% in the trade direction lines up with that story of consistent, medium-sized declines rather than a pattern dominated by one outlier crash.
The per-year table shows how that plays out in individual cycles. In 1998, a short trade in this window would have captured a 27.49% decline from entry to exit, while 2010 delivered a 17.12% move in the trade direction. The weakest year for the pattern was 2018, when Coterra finished the window up 0.38%, turning that season into a small loss for shorts even though the maximum favorable move inside the window reached 8.7% before reversing.
Intraperiod swings have been large in both directions. Maximum favorable excursions, the best point-to-peak move in the trade direction, reached 25.73% in 2022 and double digits in several other years, while maximum adverse excursions, the worst drawdown from entry, hit as deep as 43.0% in 1998 when the stock squeezed higher before rolling over. That combination of big positive and negative swings explains why the TradeWave Ratio sits at 1.87 and the Sharpe ratio at 1.58, a profile that blends strong directional edge with meaningful volatility.
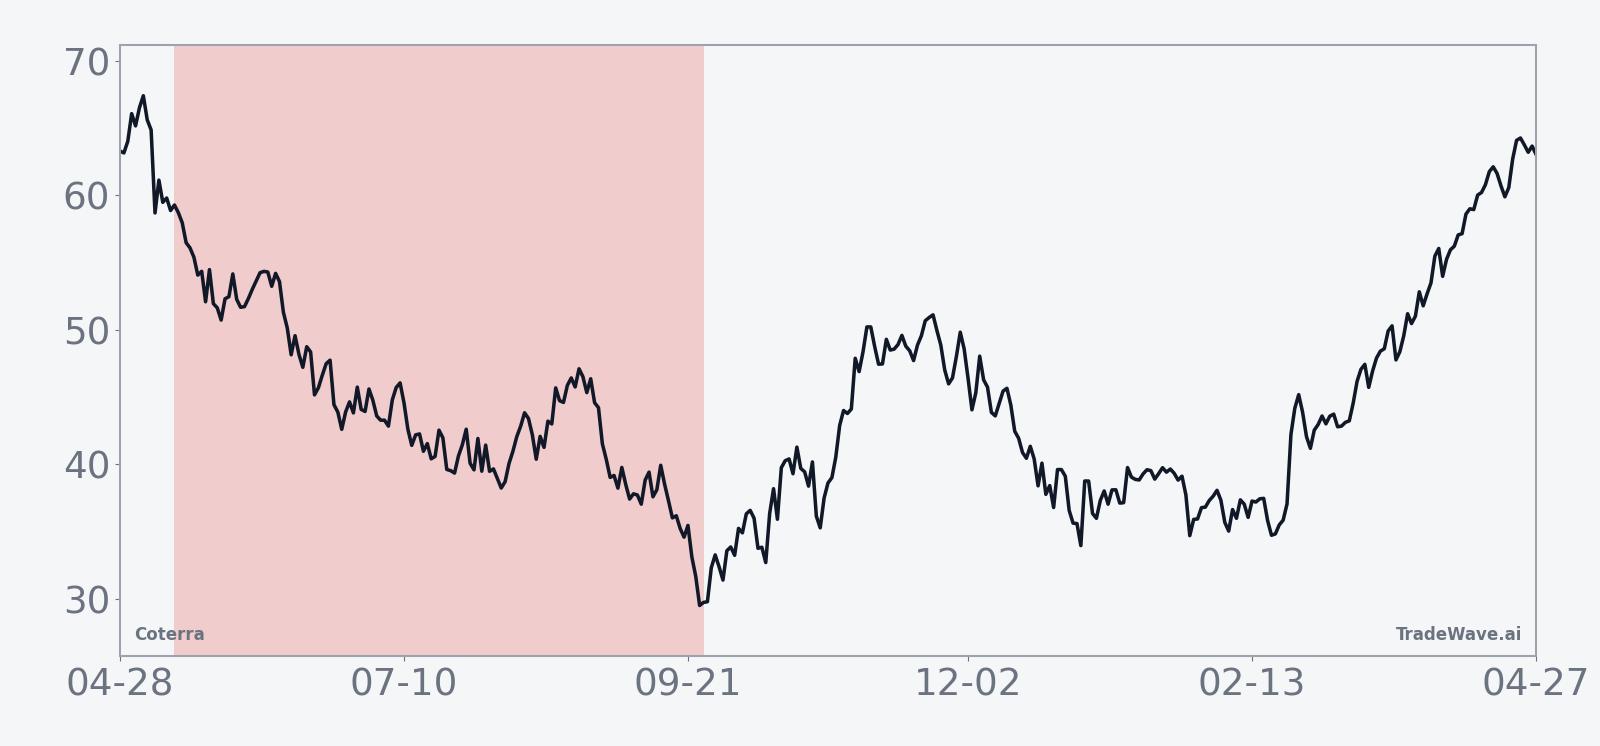
The historical seasonal trend chart suggests that weakness often builds gradually rather than in a single air pocket. The average path slopes lower across much of the 137-day window, with some mid-window stabilization before further softening into the late stages, which is consistent with a pattern of rallies that fade rather than a straight-line slide. The cumulative return profile, with a 180% total gain for the short strategy across the eight cycles, reinforces that this has been a durable, repeatable feature of Coterra’s midterm-year behavior rather than a one-off anomaly.
Put simply, this window has favored shorts in 7 of 8 midterm-election years, with typical winning moves in the mid-teens and enough intraperiod noise that position sizing and risk controls matter as much as the historical edge.
Why does Coterra (CTRA) follow this seasonal pattern?
One likely driver is the way the presidential election cycle shapes energy policy debates and capital spending plans for exploration and production companies. Analysts often point to midterm years as periods when regulatory proposals, pipeline approvals and tax discussions create uncertainty that can weigh on upstream names even when commodity prices are stable. This Coterra seasonal trend may also reflect institutional portfolio repositioning around midyear, as funds rebalance exposure to cyclical energy stocks ahead of the historically stronger year before the presidential election.
History does not guarantee future results, and even in winning years this window has seen large adverse excursions that can challenge poorly timed positions.
What is driving Coterra (CTRA) today?
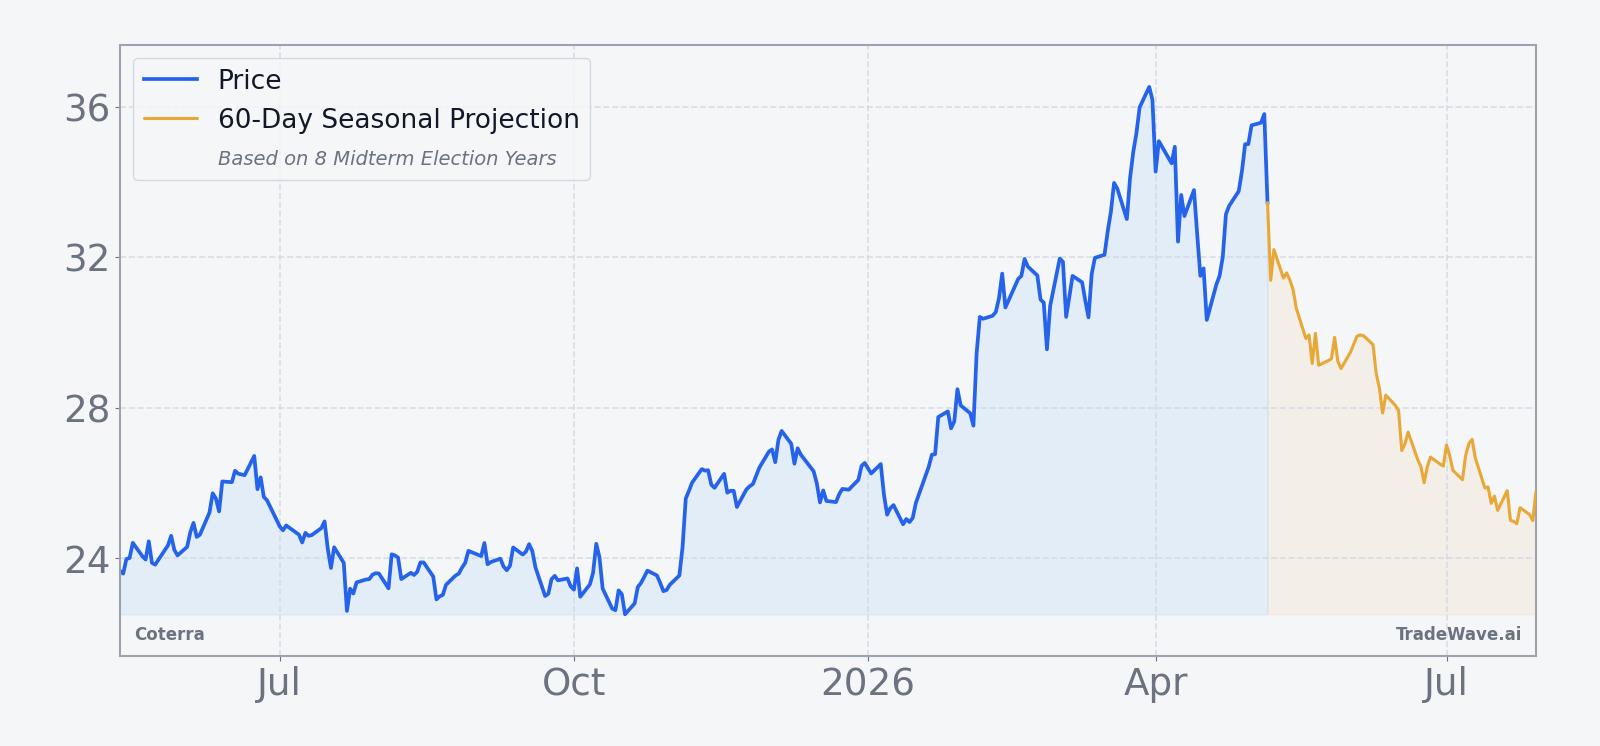
Coterra closed at 32.56 after an 8.6% single-session drop, on volume of about 72.6 million shares versus a 20-day average near 9.8 million, leaving the stock roughly 11.7% below its 52-week high of 36.88 and well above its 52-week low around 21.30. The shares are also trading slightly under their 50-day moving average of 33.1362, a sign that near-term momentum has turned lower even before the midterm-year seasonal window formally opens.
Fundamentally, the last major data point for investors came in August 2025, when Coterra reported adjusted profit of 48 cents per share for the second quarter, topping analyst estimates of 45 cents as higher natural gas prices and strong output offset weaker oil pricing.[1] That report underscored how sensitive the stock can be to shifts in U.S. gas markets and production volumes, a dynamic that will remain in focus as traders weigh the upcoming seasonal pattern against whatever macro and commodity headlines emerge over the next several months.
The chart below shows how the latest pullback fits into Coterra’s past year of trading, alongside a 60-day seasonal projection.
What should traders watch in this upcoming Coterra seasonal window?
First, the calendar: the 137-day midterm-year window begins on May 12 and runs deep into the year before the presidential election, so any policy headlines on drilling permits, methane rules or export infrastructure could interact with this historical seasonality. Second, price levels: traders will be watching whether Coterra holds the low 30s or retests the 50-day moving average near 33.14, since prior winning short years often featured early rallies that failed before the larger decline unfolded. Third, volatility: given past maximum adverse excursions as steep as 43.0%, behavior inside the window will matter as much as the final outcome, with sharp squeezes against shorts entirely consistent with the historical pattern.
Finally, confirmation or rejection of the pattern itself will be a key tell. If Coterra spends this window grinding lower with mid-teens declines from the May 12 starting point, it would extend a 7-of-8 record for short trades and keep this midterm-year seasonal trend intact. A sustained break higher that turns the season into another losing year for shorts, especially if supported by stronger gas prices or upbeat earnings, would signal that the election-cycle pattern is weakening and that other forces are taking the lead in Coterra’s stock pattern analysis.
Sources
About this seasonal analysis
Seasonal pattern data is sourced from TradeWave.ai, which analyzes historical price behavior across annual calendar windows going back up to 30 years. Read the full data methodology or the book The 100-Year Pattern by Afshin Moshrefi (2026 edition). Past performance of seasonal patterns does not guarantee future results. This article is for informational purposes only and does not constitute investment advice.