General Mills (GIS) Has Rallied in Every One of the Last 10 Midterm May Windows
General Mills is approaching a 16-day midterm-year seasonal window that has never been negative in the last 10 cycles, just as the stock trades near its 52-week low after a difficult earnings stretch.

What is the seasonal pattern for General Mills (GIS)?
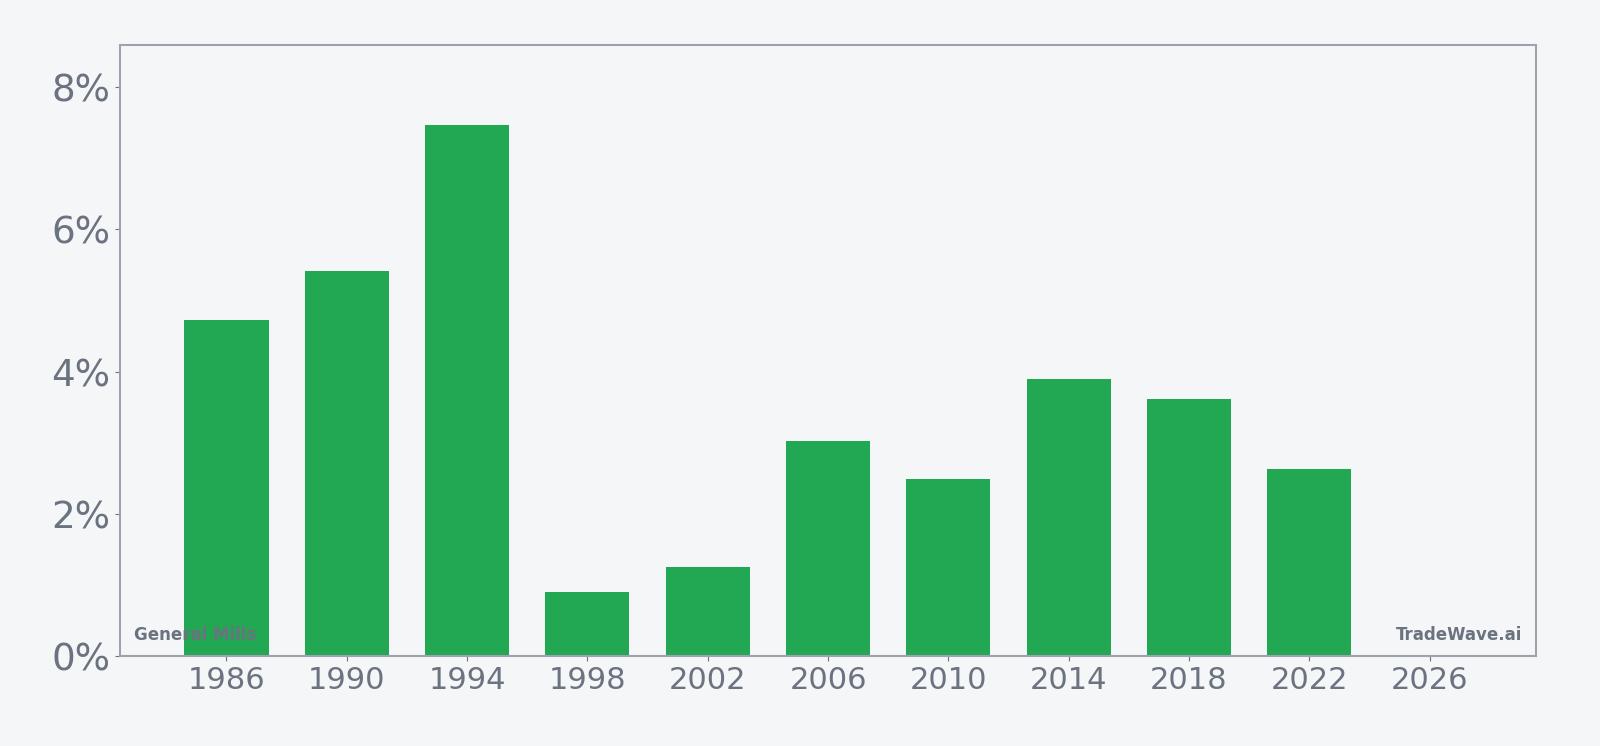
General Mills has risen in 10 of 10 midterm-year May windows during this 16-day stretch, with an average gain of 3.54% in winning years.
- 10 for 10 in this window, with General Mills averaging 3.54% gains across all winning years.
- The upcoming 16-trading-day window starts on May 20 and covers the last 10 midterm election years.
- Percent Profitable is 100%, with 10 winners and 0 losers in the historical sample.
- Average gains cluster between roughly 1% and 7%, with standout years like 1994 posting a 7.47% move.
- Intraperiod swings have been manageable, with worst drawdowns in individual years generally limited to a few percentage points.
- The pattern aligns with a long trade direction, supported by a TradeWave Ratio of 2.52 and a Sharpe ratio of 1.72.
According to historical data from TradeWave.ai, this mid-May stretch has behaved very differently from an average month for General Mills. The next section walks through how that election-cycle pattern has played out and what it means for the approaching window.
How has General Mills (GIS) traded in this midterm-year May window?
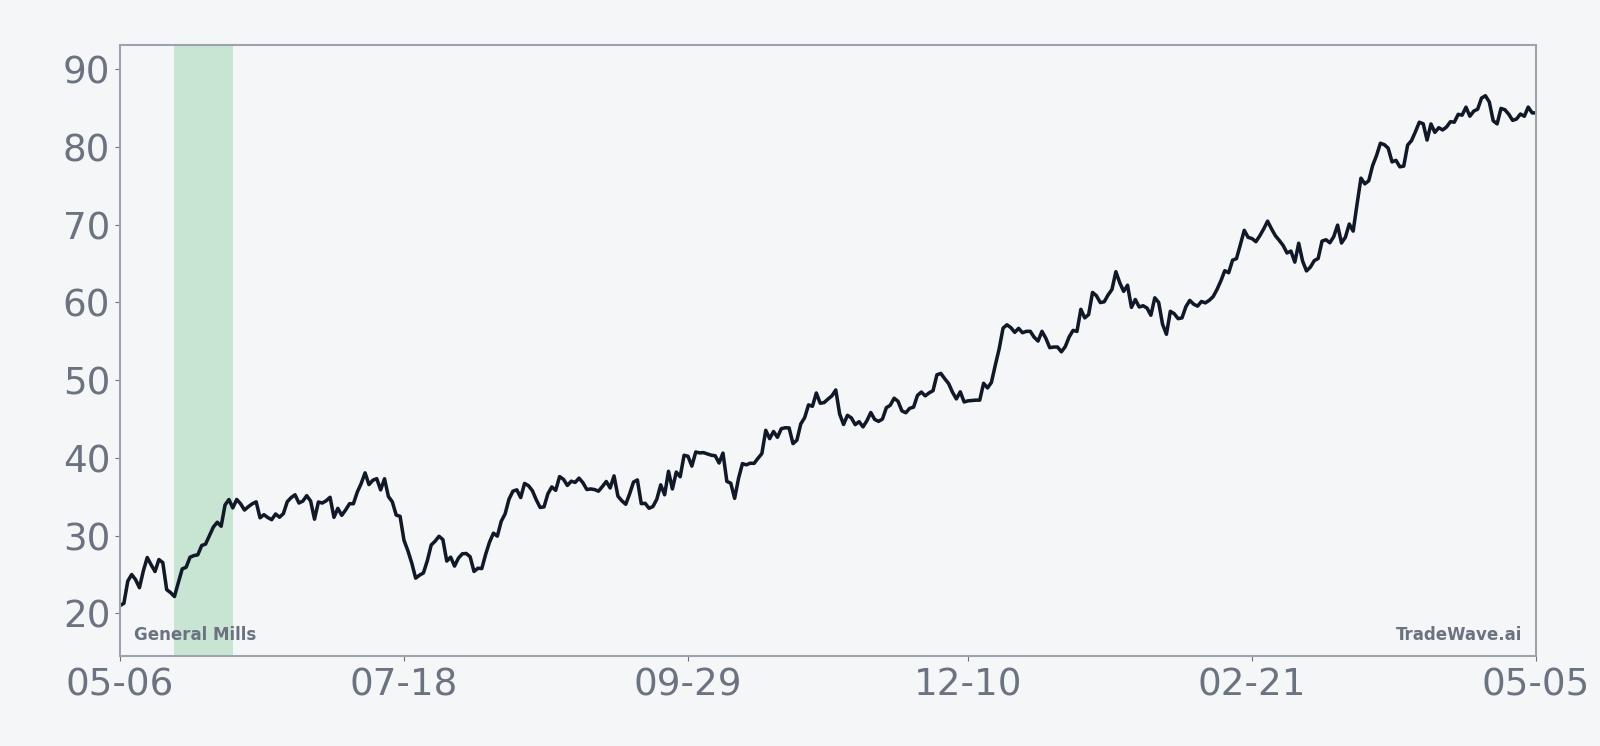
General Mills has posted gains in every one of the last 10 midterm election years during the 16 trading days starting May 20, averaging a 3.54% rise for the stock. Shares last closed at 34.79, leaving them about 32.1% below the 52-week high of 51.25 and only about 3.6% above the 52-week low of 33.58.[3] That combination of a clean 10-for-10 seasonal record and a stock sitting near the bottom of its one-year range gives this upcoming General Mills trading window unusual weight for investors watching the GIS seasonal trend.
Because this pattern is grouped by the presidential election cycle, it only looks at midterm election years, which often feature a mix of policy uncertainty and shifting expectations for regulation and consumer spending. For a defensive consumer staples name like General Mills, that backdrop has historically lined up with steady, modest gains in this late-spring slice of the calendar rather than the sharp swings seen in more cyclical sectors.
Across the 10 historical midterm-year samples, the strongest performance came in 1994, when General Mills gained 7.47% during the window, while the softest year was 1998 with a still-positive 0.91% move. In several years, such as 1990 and 2014, the maximum favorable move within the window closely matched the final gain, which suggests a relatively smooth grind higher rather than a spike-and-fade profile. Even in choppier years like 2010, where the stock’s best intraperiod run-up reached 5.06% and the worst drawdown hit 2.24%, the closing result still landed in positive territory.
The historical seasonal average curve for this window slopes upward in a fairly consistent way, with gains tending to build as the 16 days progress rather than front-loading early. That profile fits a pattern where buyers gradually step in during the window, potentially as institutional investors rebalance consumer staples exposure in the middle of the year.
A closer look at yearly net returns and intraperiod swings shows how upside and downside have interacted in this window.
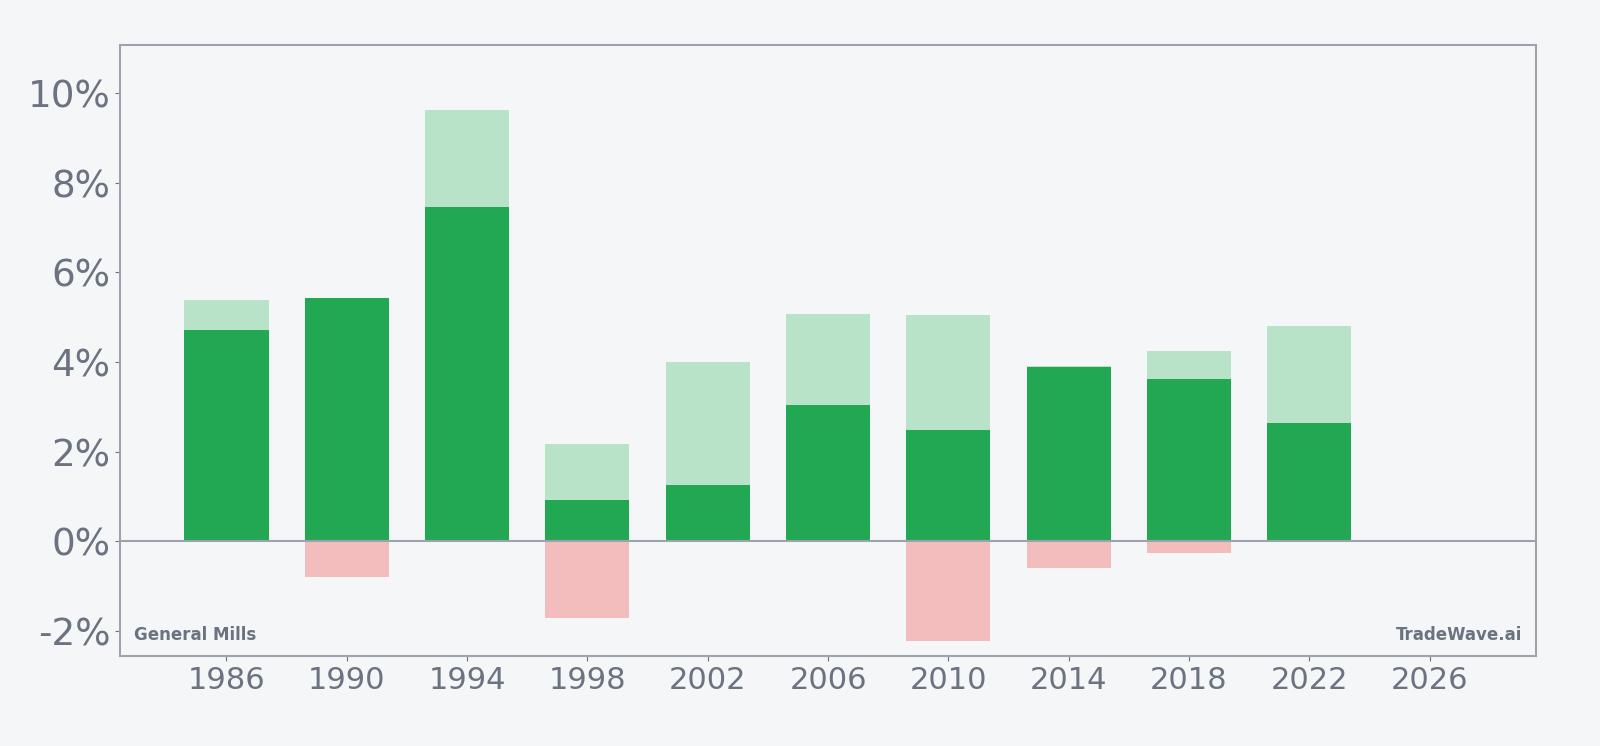
The combined net, maximum favorable move and maximum adverse move bars show a window that has historically offered more upside than downside for long positions, but not without noise. In years like 1998 and 2010, the stock experienced intraperiod drawdowns of around 1% to 2% even though the final result was positive, while stronger years such as 1994 and 2006 saw maximum favorable moves above 5% with minimal adverse excursions. Add it up: 10 winners, no losers and a typical gain in the low single digits, with intraperiod swings that have been noticeable but not extreme for a large consumer staples stock.
History does not guarantee future results; adverse excursions can still be meaningful even in windows where every historical sample finished higher.
Why does General Mills (GIS) follow this seasonal pattern?
One likely driver is the way institutional investors rebalance consumer staples exposure around the middle of midterm election years, when policy uncertainty is high but earnings visibility for defensive names remains relatively stable. General Mills also tends to report key fiscal-year updates around this part of the calendar, which can anchor expectations and support the stock after earlier volatility. The pattern may also reflect consumer spending cycles, as retailers and packaged-food companies adjust orders heading into the summer, creating a modest tailwind for established brands.
What is driving General Mills (GIS) today?
General Mills last changed hands at 34.79, down 2.6% on the day and sitting close to its 52-week low after a string of weaker quarters and a turnaround effort that has yet to fully convince investors.[3] On Mar 18, 2026, the company reported that quarterly profit fell to $303.1 million, or 56 cents per share, from $625.6 million a year earlier as it worked to improve volumes and regain market share, underscoring the pressure on margins and demand.[3] Management has guided for full-year net sales to be between down 1% and up 1%, with adjusted earnings per share expected to fall 10% to 15% in constant currency, a cautious outlook that helps explain why the stock has been pinned near the bottom of its one-year range.[3]
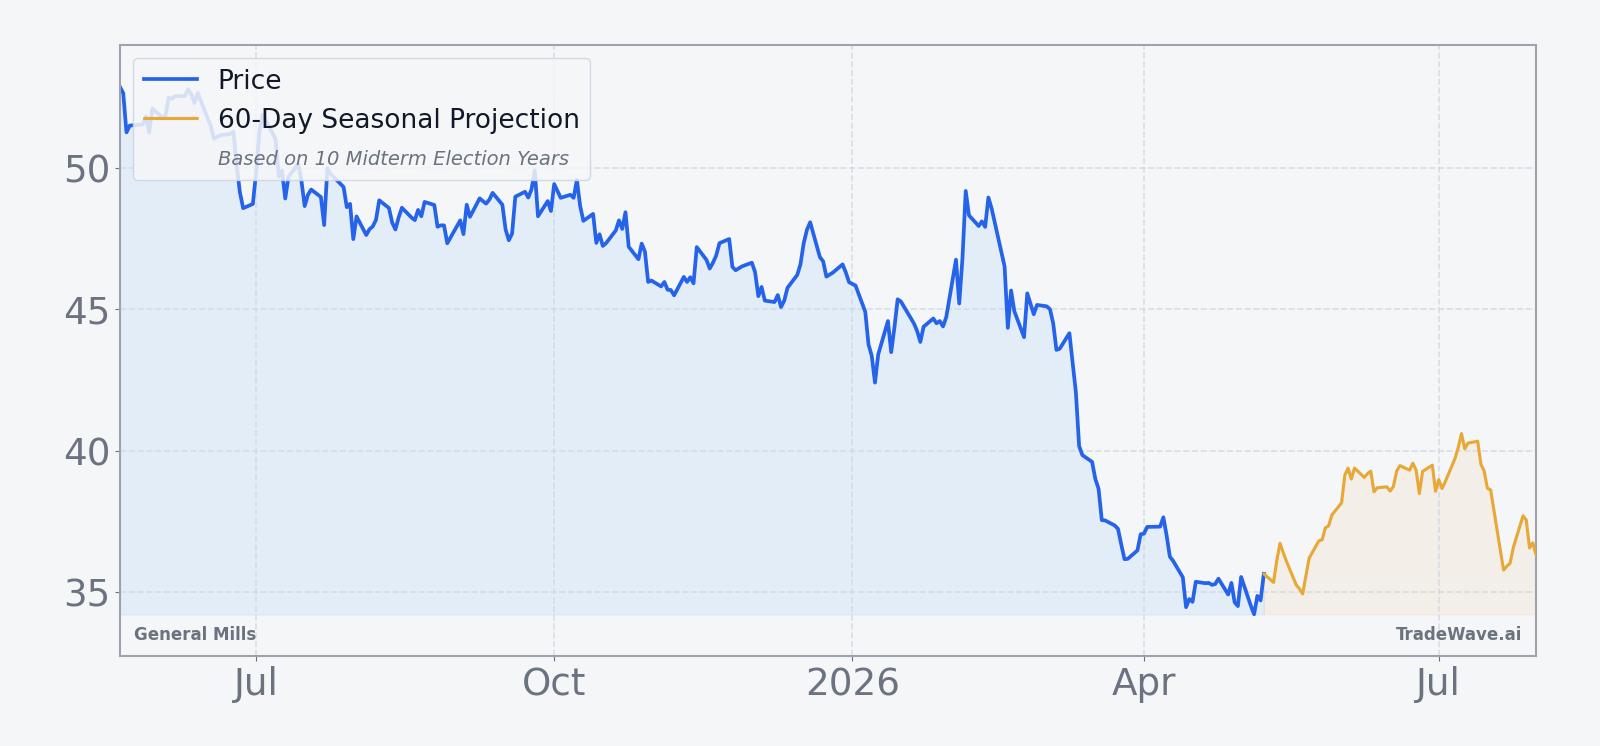
The chart below situates the latest move against the past year of trading and a 60-day seasonal projection.
In Dec 2025, General Mills reported that quarterly net sales fell 7% to $4.9 billion and net income dropped to $413 million from $795.7 million a year earlier as price cuts weighed on revenue, reinforcing the narrative of a company trading off pricing power for volume.[1] In Sep 2025, the company kept its annual outlook even as first-quarter sales fell 6.8% to $4.52 billion and adjusted profit landed at 86 cents per share, signaling that management saw the softness as manageable rather than structural at that stage.[2] Also in Sep 2025, General Mills highlighted its sustainability credentials after being recognized on TIME’s World’s Best Companies 2025 list, ranking in the top five in the U.S. Food & Beverage category for sustainability transparency, a factor that can matter for long-only ESG-focused investors even if it does not move the stock day to day.[4]
What should traders watch as this seasonal window approaches?
The key near-term catalyst is the calendar itself: the 16-day midterm-year window beginning May 20 has historically been a constructive period for long exposure to General Mills, even when the stock entered the stretch under pressure. Traders will be watching whether GIS can hold above the recent 52-week low around 33.58 and whether any bounce during the window tracks the historical pattern of steady, low- to mid-single-digit gains rather than a sharp reversal that quickly fades.[3] Earnings guidance and commentary from management on volumes and pricing will remain central, but the behavior of the stock inside this specific window will tell investors whether the long-running historical seasonality is still exerting an influence or whether the current fundamental headwinds are strong enough to override it.
Sources
- The Wall Street Journal, "General Mills Quarterly Profit Falls Amid Price Cuts" (Dec 17, 2025)
- Reuters, "General Mills keeps annual outlook as North America demand softens" (Sep 17, 2025)
- The Wall Street Journal, "General Mills Posts Lower Profit, Sales Amid Turnaround" (Mar 18, 2026)
- General Mills, "General Mills Recognized on TIME’s World’s Best Companies 2025 List" (Sep 10, 2025)
About this seasonal analysis
Seasonal pattern data is sourced from TradeWave.ai, which analyzes historical price behavior across annual calendar windows going back up to 30 years. Read the full data methodology or the book The 100-Year Pattern by Afshin Moshrefi (2026 edition). Past performance of seasonal patterns does not guarantee future results. This article is for informational purposes only and does not constitute investment advice.