Netflix (NFLX) Has Rallied 15 of 15 Times in This 65-Day Spring Window, Averaging 14.1% Gains
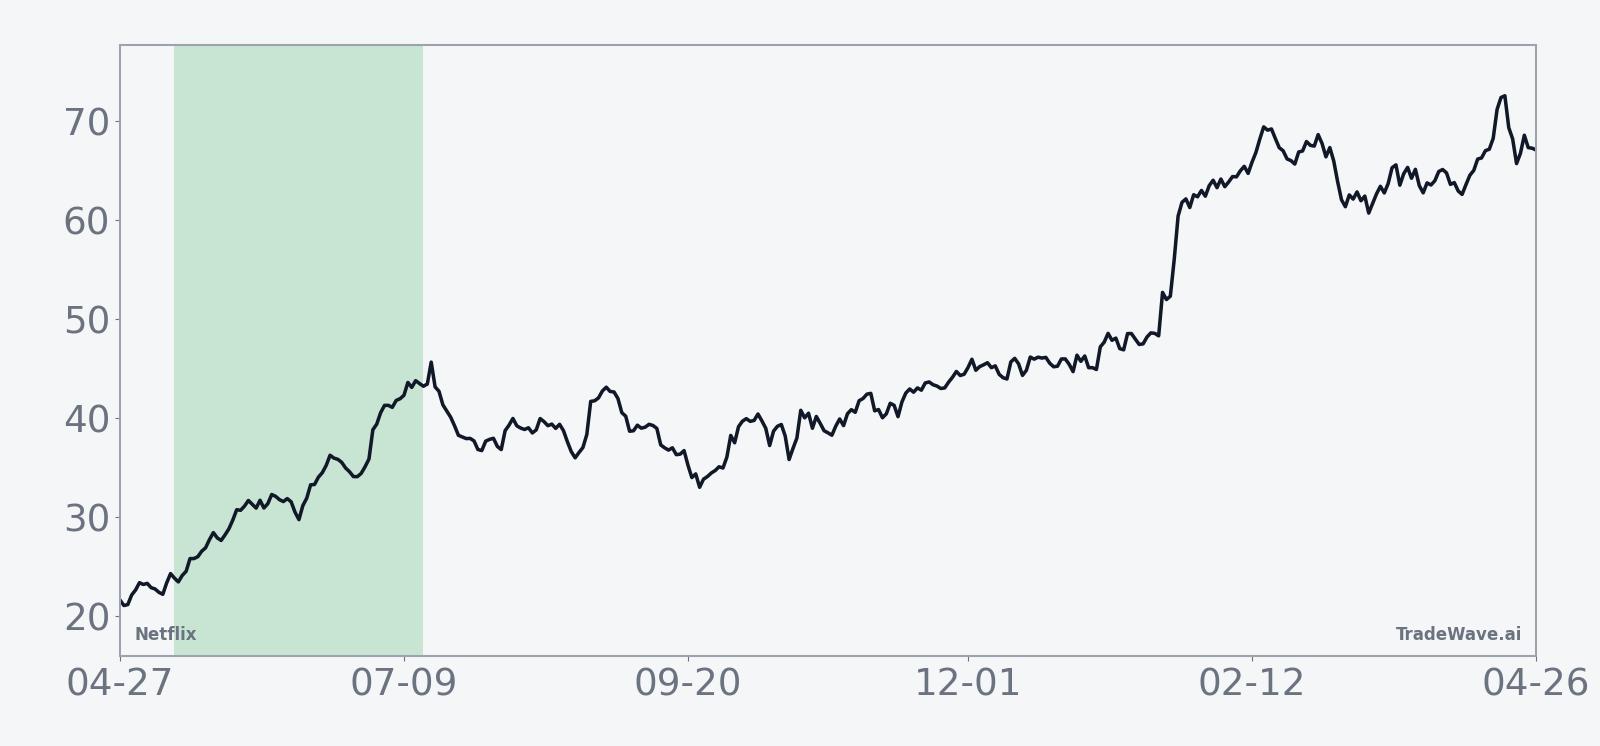
Netflix shares are under pressure today, but an upcoming 65-day spring seasonal window with a perfect 15-year win streak is about to test the stock’s recent pullback.

What is the seasonal pattern for Netflix (NFLX)?
Netflix has risen in 15 of 15 years during this May-to-summer window, with an average gain of 14.1% in winning years.
- 15 for 15 in this window, with Netflix averaging 14.1% gains across all winning years over the past 15 seasons.
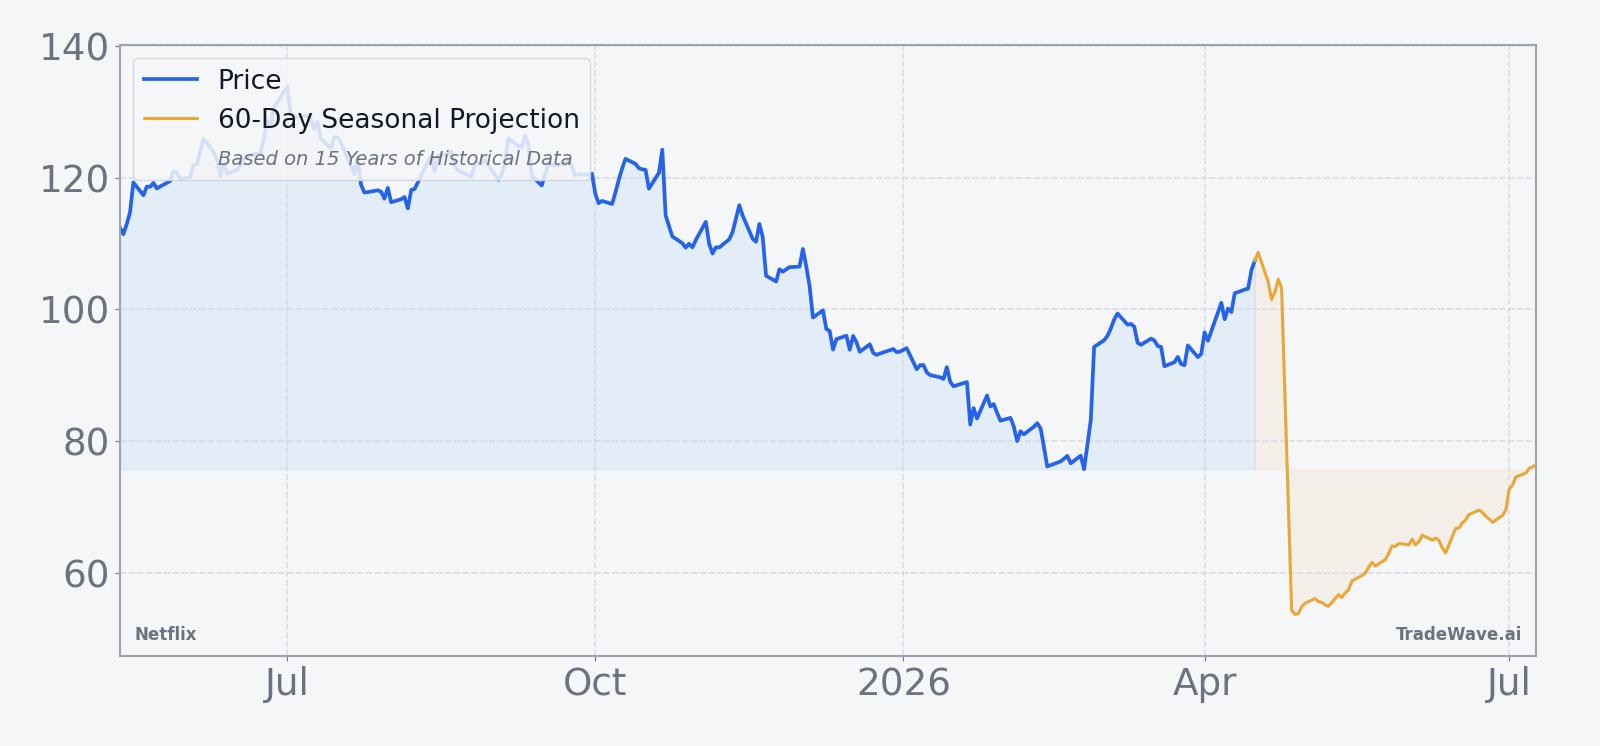
- The upcoming 65-trading-day window starts on May 11, 2026 and has historically favored long positions in NFLX.
- Percent Profitable is 100%, with 15 winners and 0 losers in the historical sample.
- Individual winning years have ranged from modest 1.63% advances to a 28.18% surge, showing both consistency and upside punch.
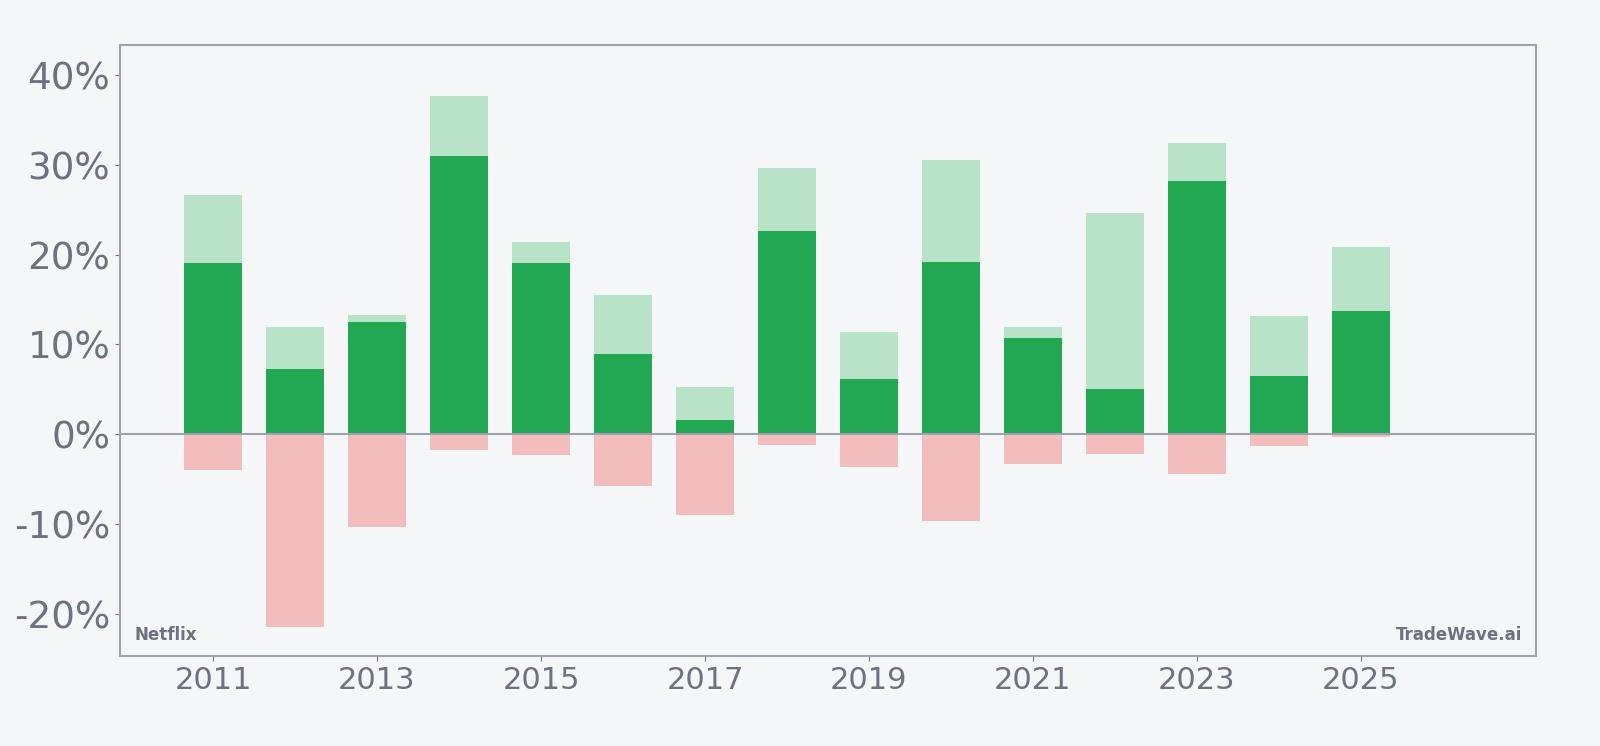
- Intraperiod swings have been meaningful, with some years seeing double-digit drawdowns even as the window finished higher.
- The pattern’s TradeWave Ratio of 2.07 and Sharpe ratio of 1.53 point to a historically strong risk-adjusted profile for this specific Netflix trading window.
According to historical data from TradeWave.ai, this mid-May stretch has behaved very differently from an average month on the Netflix calendar, and the next iteration is only weeks away.
How has Netflix (NFLX) traded in this May-to-summer window?
Netflix has posted gains in every one of the past 15 years during the 65-trading-day window that begins on May 11, averaging a 14.1% advance with a long bias. Shares finished Monday at 94.83, down 2.5% on the day and about 17.7% below their 52-week high of 115.25, leaving the stock in a pullback ahead of a historically strong stretch.
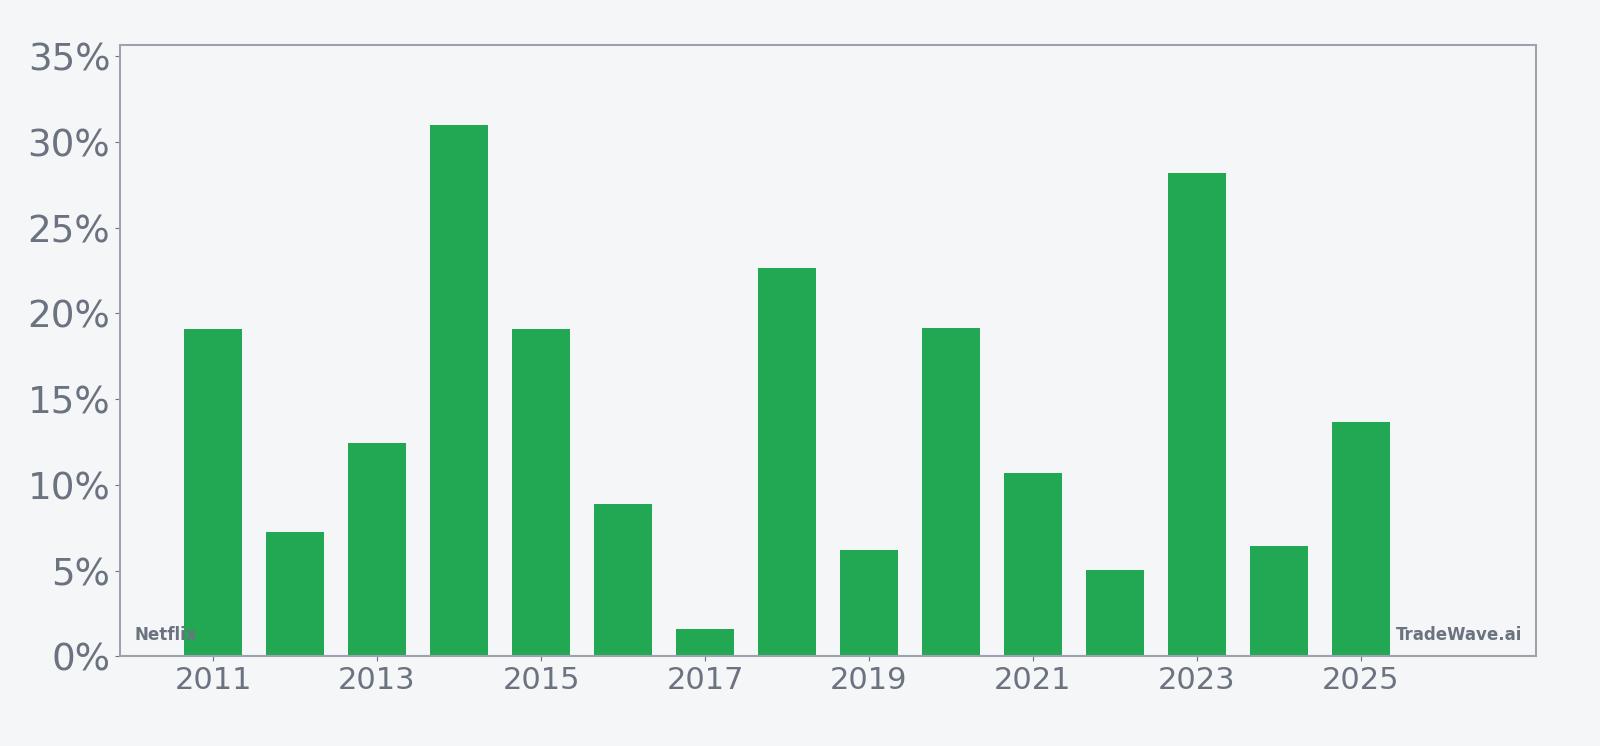
Historically, this Netflix trading window has been firmly tilted in favor of long exposure. Percent Profitable sits at 100%, with 15 winners and no losing years, and the average gain of 14.1% means the typical season has delivered a double-digit move higher. The median outcome of 12.47% shows that the strength is not just about one or two outlier years; most seasons have produced solid, mid-teens type returns.
Individual years show a wide but consistently positive range. The softest outcome in the sample was 2017, when Netflix gained 1.63% between the May 11 start and the end of the 65-day window, while the strongest was 2023, when the stock advanced 28.18% over the same stretch. In 2018, the stock climbed 22.67% during the window, and in 2020 it added 19.15%, underscoring how often this period has lined up with powerful rallies.
Intraperiod swings have been meaningful. In 2020, the maximum favorable move, or best point-to-peak run-up, reached 30.61%, while the worst drawdown from entry, or maximum adverse move, was a sizable 9.68%. In 2017, the stock ultimately finished higher but endured a 9.01% intraperiod drop before recovering, showing that even winning seasons have tested conviction.
The typical path inside the window has leaned steadily higher rather than relying on a single late burst. Trend statistics show 81 days with a positive long trend signal versus zero for shorts across the composite pattern, and a similar 80-to-0 skew in the shorter-term trend view. That suggests the average year has seen gains accrue across much of the 65-day span instead of clustering in just a few sessions.
Year-by-year bars with peak run-ups and worst drawdowns show how consistently the window has finished higher despite sizable swings along the way.
The combination of a 2.07 TradeWave Ratio and a 1.53 Sharpe ratio points to a window where Netflix has historically moved a long way in the trade direction with attractive risk-adjusted results. Add it up: 594% cumulative gains across the 15 spring windows in this sample, with no losing years. History does not guarantee a repeat, but the record is unusually clean for a single stock.
History does not guarantee future results, and even in a perfect win streak, adverse excursions within the window have at times been large enough to challenge risk limits.
Why does Netflix (NFLX) follow this seasonal pattern?
One likely driver is Netflix’s earnings and content calendar, which often clusters major releases and investor updates around late spring and early summer. Analysts have also pointed to portfolio rebalancing and sector rotation into growth and communication-services names during this part of the year, especially when macro risk feels contained. The pattern may reflect a mix of fresh guidance, new hit content and renewed risk appetite that has repeatedly lined up in this May-to-summer stretch.
What is driving Netflix (NFLX) today?
Netflix closed at 94.83 on Monday, down 2.5% on the session, as the stock extended a pullback that has left it well below its 52-week high of 115.25. Trading volume of about 62.9 million shares ran well ahead of the recent 20-day average of roughly 37.3 million, signaling active repositioning as investors digest the latest fundamental backdrop.
In October 2025, Netflix’s third-quarter earnings missed expectations after a $619 million Brazilian tax expense cut into profit, even as revenue met forecasts and management said the tax hit should be immaterial for future periods.[2] The company guided to fourth-quarter 2025 revenue of $11.96 billion and projected full-year 2025 revenue growth of about 16%, while trimming its operating margin outlook to 29% to reflect the tax charge.[2] That combination of solid top-line growth and a one-off margin headwind has shaped how investors frame the current valuation.
In January 2026, analysts again focused on Netflix’s ability to convert strong subscriber trends and advertising momentum into durable earnings growth, with some on the Street flagging concerns about engagement and valuation after a strong multi-year run.[1] The broader streaming and content sector has been wrestling with the same trade-off, as platforms push into ad-supported tiers and live content while trying to keep spending in check.[1] Against that backdrop, Netflix’s current pullback leaves it trading below its 50-day moving average of 91.61 but still well above the 52-week low of 9.48, a reminder of how far the stock has climbed off its trough.
Analyst sentiment remains constructive overall. Various providers, including TipRanks and Wedbush, show a “Moderate Buy” consensus rating on Netflix with a blended price target around 124.8, implying meaningful upside from Monday’s close if those longer-term forecasts prove accurate.[1] In March 2026, JPMorgan’s Douglas Anmuth reiterated a buy rating and set a $120 target, citing confidence in Netflix’s content strategy and growth trajectory despite lingering concerns about competition and macro volatility.[1]
Macro themes also matter. Analysts have highlighted Netflix as one of the media names most likely to benefit from artificial intelligence in areas like content discovery, personalization and production efficiency, even as investors weigh the broader impact of heavy AI spending by mega-cap tech peers on market leadership and risk appetite.[1] Within streaming, the company’s push into advertising and password-sharing crackdowns has helped support revenue growth, but the market remains sensitive to any sign that engagement or pricing power is slipping.[1]
The chart below shows how Netflix’s recent slide fits into its 12-month rally, alongside a 60-day seasonal projection for the upcoming window.
What should traders watch as the Netflix seasonal window opens?
First, the calendar. The 65-day Netflix seasonal window begins on May 11, so the next few weeks are about positioning rather than immediate seasonality. Historically, the pattern has favored long exposure with a clean 15-for-15 record, but the intraperiod drawdowns in years like 2017 and 2020 show that the ride has rarely been smooth.
Second, price levels. With the stock about 17.7% below its 52-week high, traders will be watching whether Netflix can stabilize above the 50-day moving average near 91.61 and then challenge the 100 level as the window progresses. A failure to hold that moving average, especially if accompanied by heavy volume, would signal that this year’s setup is starting from a weaker technical base than many prior cycles.
Third, fundamentals. While the next earnings date is not yet set, the company’s 2025 revenue growth target of roughly 16% and 29% operating margin outlook remain key markers for how much operating leverage Netflix can deliver from its subscriber and advertising engines.[2] Any update on AI-driven product features, ad-tier monetization or content spending discipline will feed directly into how investors treat this historically strong seasonal stretch.
Finally, behavior inside the window. In prior years, strong seasons have often featured early upside follow-through with contained drawdowns, while weaker but still positive years have seen deeper mid-window dips before recovering. If Netflix enters the May 11 window and quickly builds a sustained uptrend with manageable pullbacks, that would rhyme with the long-term seasonal pattern. A choppy tape with repeated failures at resistance, by contrast, would be an early sign that 2026 may break from the 15-year script.
Sources
About this seasonal analysis
Seasonal pattern data is sourced from TradeWave.ai, which analyzes historical price behavior across annual calendar windows going back up to 30 years. Read the full data methodology or the book The 100-Year Pattern by Afshin Moshrefi (2026 edition). Past performance of seasonal patterns does not guarantee future results. This article is for informational purposes only and does not constitute investment advice.