Netflix (NFLX) Has Rallied in 15 of 15 Late-Spring Windows, Averaging 14.1% Gains
Netflix is trading just under its 52-week high as it heads toward a 65-day late-spring window that has never been negative in the past 15 years, a stretch that has often featured sharp swings as well as strong gains.

What is the seasonal pattern for Netflix (NFLX)?
Netflix has risen in 15 of 15 years during this late-spring 65-day window, with an average gain of 14.1% in winning years.
- 15 for 15 in this window, with average winning-year gains of 14.1% across the past 15 years.
- The pattern runs from May 11 for 65 trading days and has been a consistently bullish NFLX seasonal trend.
- Percent Profitable is 100%, with 15 winners and 0 losers over the lookback period.
- Median gain of 12.47% suggests the typical year still delivers a double-digit move in this Netflix trading window.
- Historical best intraperiod rallies have topped 30% in some years, while adverse moves have at times approached 10% before recovering.
- TradeWave Ratio of 2.07 and a Sharpe ratio of 1.53 point to strong, risk-adjusted upside in this specific seasonal slice.
According to historical data from TradeWave.ai, this late-spring stretch has behaved very differently from an average month on the calendar for Netflix. The next section looks at how that pattern has played out and what it might mean for the coming window.
How has Netflix (NFLX) traded in this late-spring window?
Netflix has posted gains in every single iteration of this 65-day late-spring window for 15 straight years, averaging 14.1% per season. The upcoming window begins on May 11 and arrives with the stock at $107.79, about 6.5% below its 52-week high of $115.25, after a strong 13.82% one-month run.
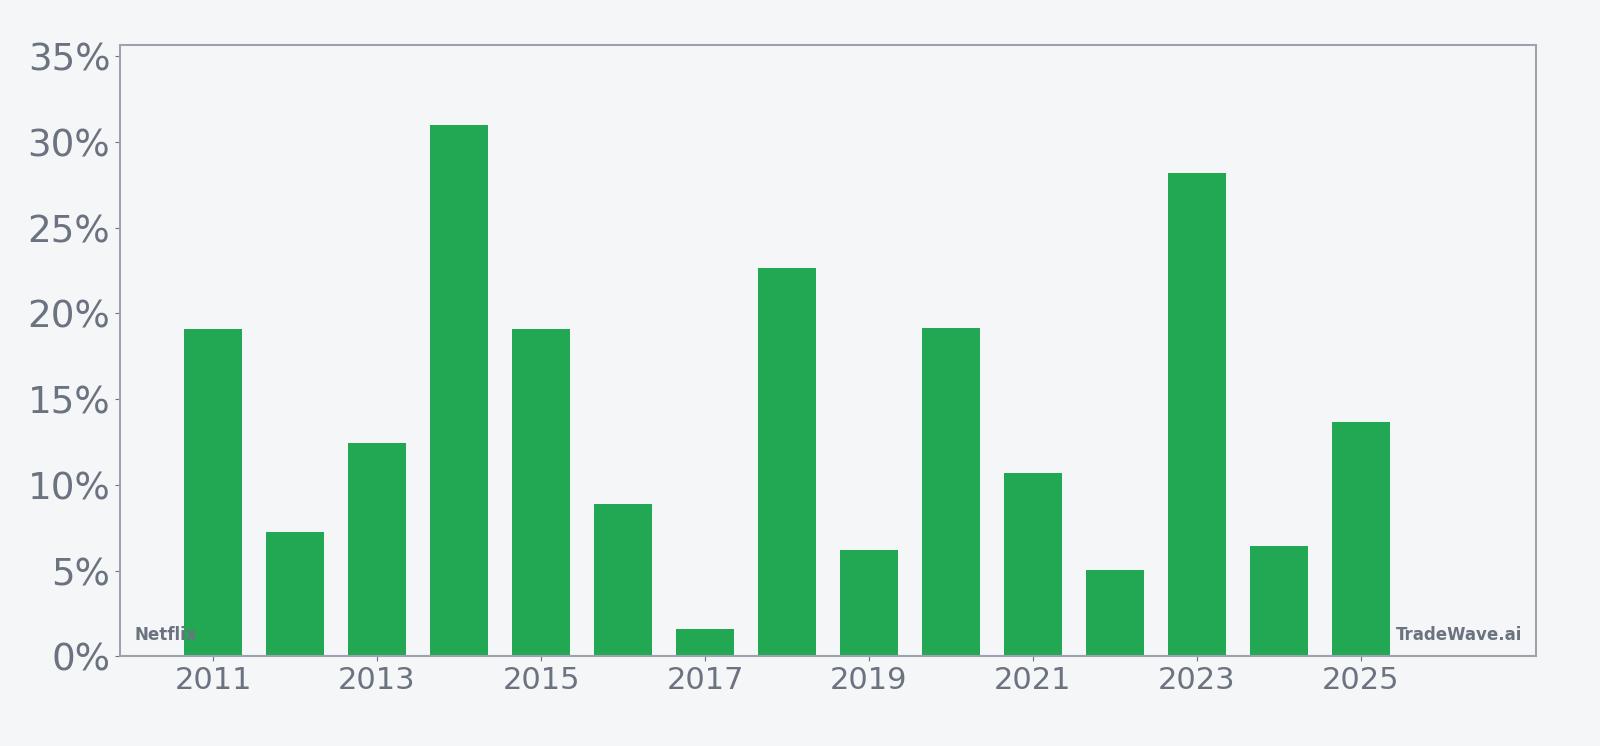
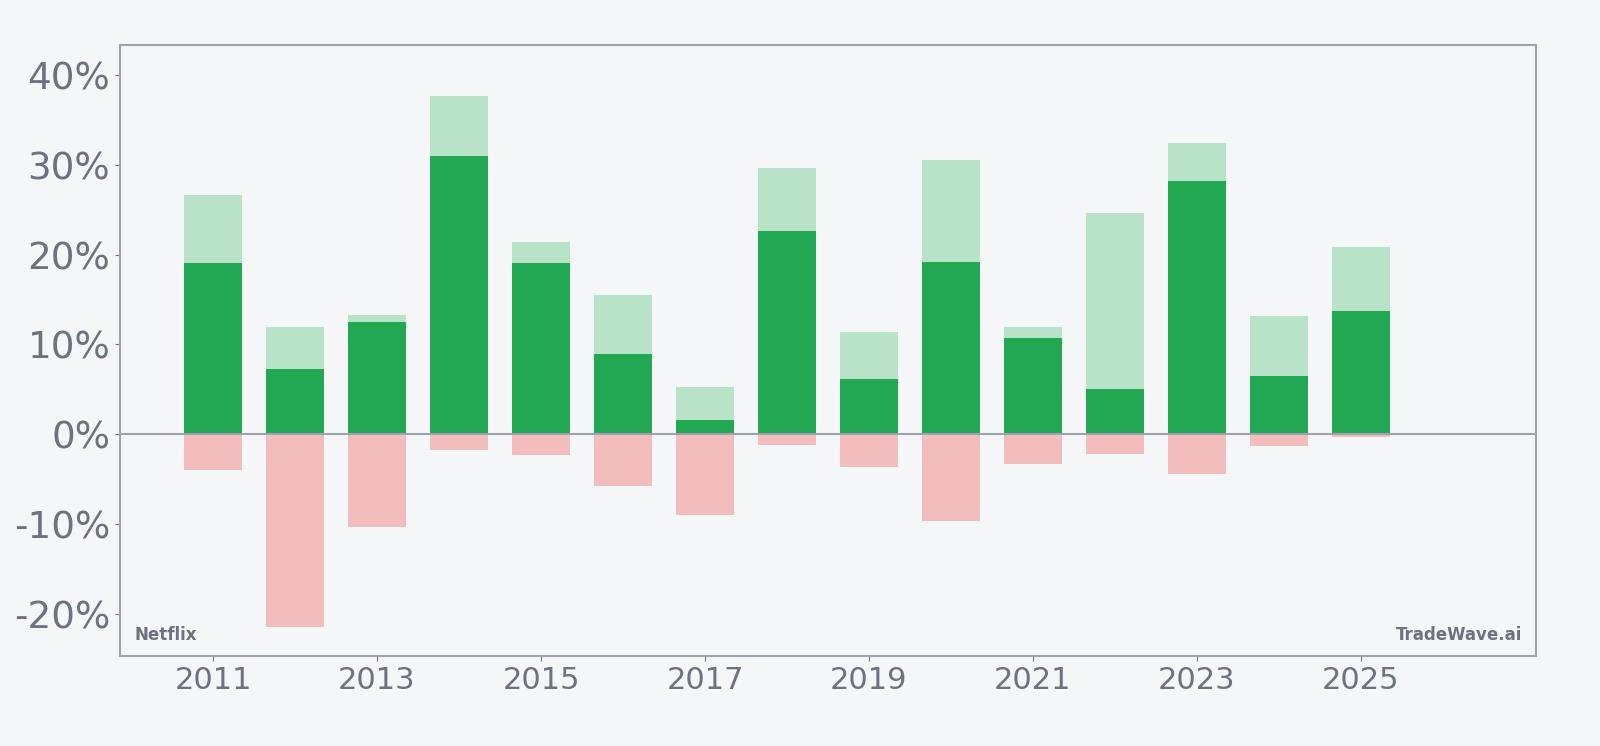
Year-by-year net returns and intraperiod swings show how often Netflix has rallied hard while still enduring meaningful drawdowns along the way.
Across the 15-year sample, the trade direction is firmly long: every season finished higher, with a median gain of 12.47% and cumulative return of 594%. Average winning years delivered 14.1%, but the distribution is wide, from a modest 1.63% gain in 2017 to a 28.18% surge in 2023. In several years, including 2018, 2020 and 2023, the maximum favorable move inside the window topped 29%, showing how explosive this slice of the calendar can be for Netflix when momentum lines up.
The intraperiod risk profile is not trivial. In 2017, the stock still finished up 1.63%, yet it suffered a worst drawdown of 9.01% from the entry point before recovering. In 2020, the maximum adverse move reached 9.68% even as the window closed with a 19.15% gain. That combination of strong maximum favorable excursions and occasional deep pullbacks is what the TradeWave Ratio of 2.07 and Sharpe ratio of 1.53 are capturing: historically, the upside has outweighed the downside, but the path has been bumpy.
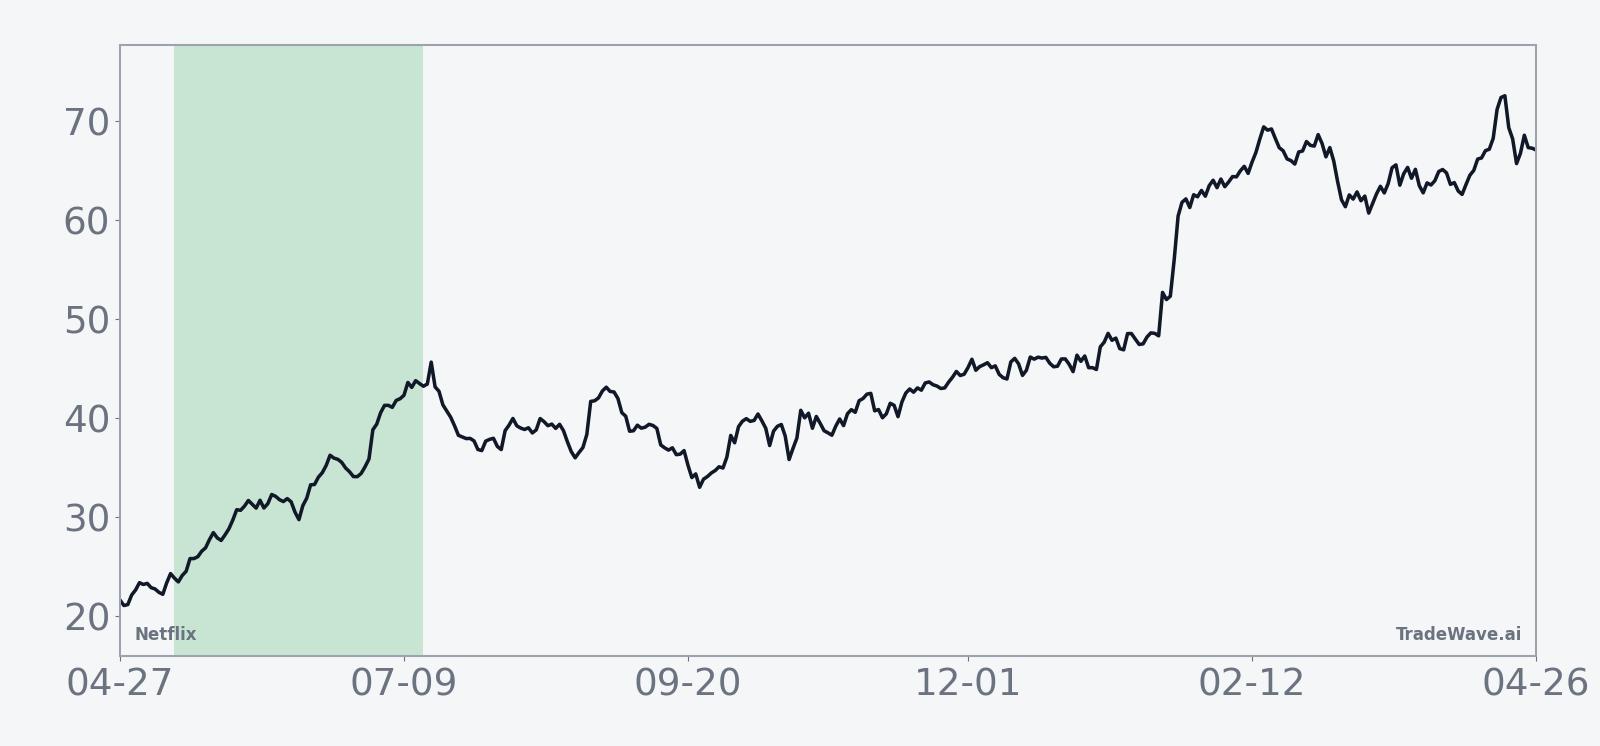
The trend chart suggests gains have tended to build through the middle of the window rather than spiking only at the start or end. In several years, including 2018 and 2023, the strongest rallies came after an early pause, with the stock grinding higher into the back half of the 65-day stretch. The cumulative return profile across all years slopes steadily upward, with no multi-year flat spots, which is unusual for a single stock seasonal pattern.
On a per-year basis, 2023 stands out as the strongest season, with a 28.18% net gain and a maximum favorable move of 32.41%, while 2017 is the weakest at 1.63% net with a 5.25% best intraperiod rally. Even in that softer year, the pattern did not produce a loss, which is why the Percent Profitable metric sits at 100% with 15 winners and 0 losers. For a long-only seasonal setup in a volatile growth stock, that kind of clean record is rare.
History does not guarantee future results; adverse excursions (MAE) can be large even in winning windows.
Why does Netflix (NFLX) follow this seasonal pattern?
One likely driver is Netflix’s earnings and content calendar, which often clusters major releases and investor updates around late spring and early summer, drawing fresh attention to the stock. Analysts have also pointed to institutional portfolio repositioning after first-quarter results, which can favor high-growth names if guidance and subscriber trends look solid. This window may also reflect consumer behavior, as new series drops and school holidays boost engagement metrics that investors watch closely.
What is driving Netflix (NFLX) today?
Netflix shares closed Friday at $107.79, up 0.07% on the day, extending a 13.82% gain over the past month and leaving the stock about 6.5% below its 52-week high of $115.25. Trading volume of roughly 56.3 million shares ran well above the 20-day average of 37.3 million, a reminder that the name still draws heavy interest when the tape turns higher.
In January 2026, investors were still digesting the company’s fourth-quarter earnings, which left parts of Wall Street underwhelmed despite solid headline numbers and a long stretch of strong performance in the shares.[1][2] The prior year’s earnings path was choppy: on Oct 22, 2025, Netflix reported third-quarter earnings of $5.87 per share, missing forecasts after a $619 million Brazilian tax expense, even as revenue grew 17.2% year over year.[3] Two days later, commentary focused on whether that stumble created a buying opportunity or signaled that the easy money in the stock had already been made.[4]
The bigger structural story came on Dec 8, 2025, when Netflix announced a $72 billion deal to acquire Warner Bros., a move that triggered at least one downgrade as analysts flagged regulatory risk, integration complexity and the chance of a bidding war that could inflate the price tag.[7] Around the same time, a 10-for-1 stock split and a prior $250 billion rally had already reset expectations, with some strategists warning that any earnings disappointment could hit a richly valued stock hard.[9][14] By mid-December, Yahoo Finance reported that the retail crowd was “loading up” on Netflix after a roughly $40 billion selloff tied to skepticism over the acquisition, underscoring how quickly sentiment can swing in a name that sits at the center of the streaming trade.[13]
Sector context has been equally nuanced. In late 2025, coverage from major outlets described Netflix as still dominating streaming in original content, but facing slowing growth, rising expenses and intensifying competition from deep-pocketed rivals.[2][7][12] Some analysts argued that the Warner Bros. deal could cement Netflix’s leadership if executed well, while others worried that dependence on external infrastructure like AWS and flatlining user trends in mature markets left little room for error.[7][12] Against that backdrop, a consensus “Moderate Buy” rating and a price target around $124.80 from firms including KeyBanc and Wedbush reflected cautious optimism rather than unbridled enthusiasm.[1][3][5][6][7]
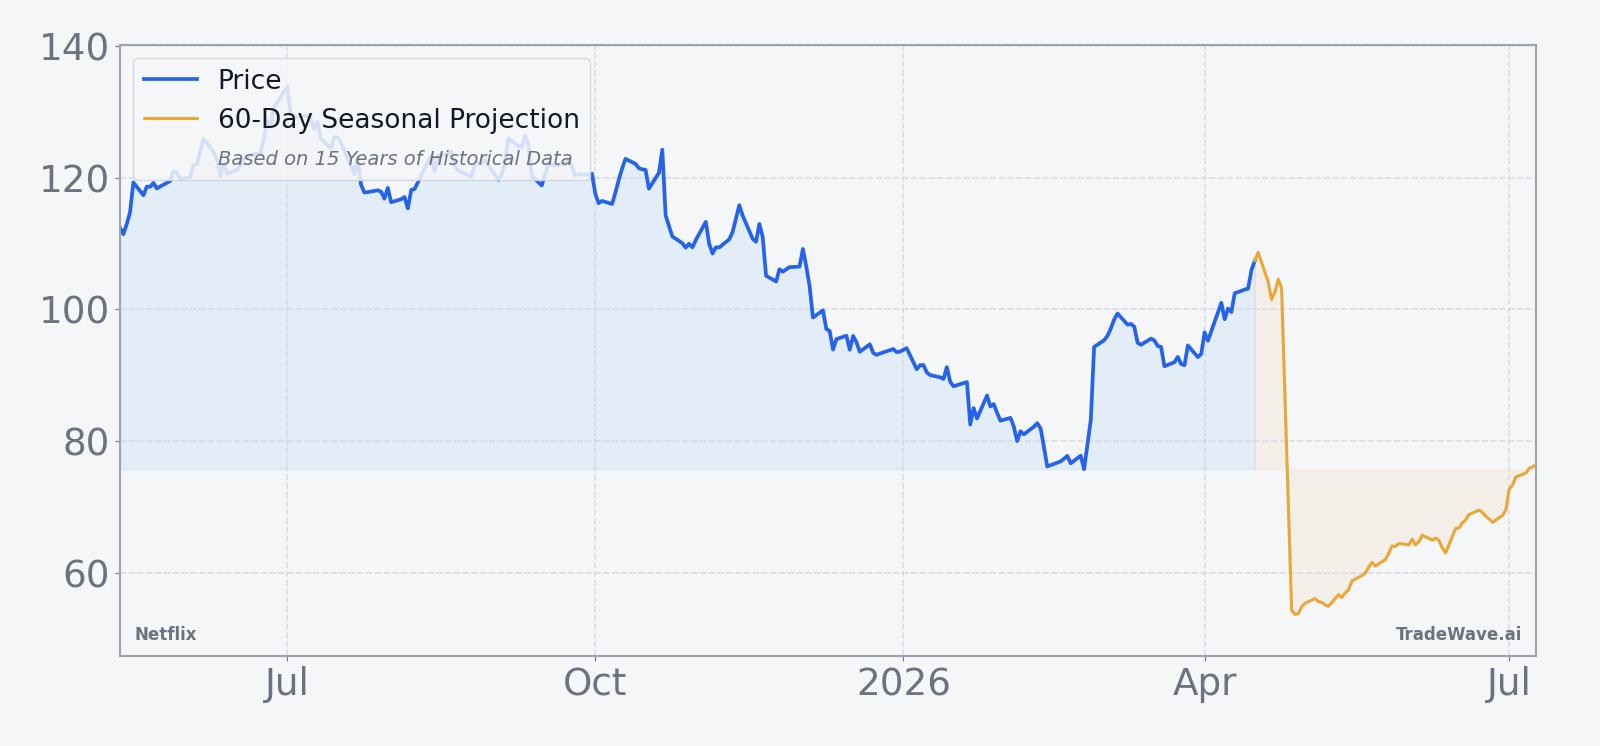
The chart below situates the latest move in its recent multi-month context, alongside a 60-day seasonal projection that echoes the historical late-spring bias.
How do earnings and valuation frame this seasonal setup for Netflix?
Looking back to the most recent full reporting cycle, Netflix’s Q3 2025 results showed how quickly one-off items can skew the narrative. Earnings of $5.87 per share fell short of the $6.89 consensus because of the Brazilian tax charge, yet revenue still climbed 17.2% from a year earlier, and full-year revenue guidance of about $51.6 billion came in slightly ahead of projections.[3][4][6] Management also pointed to 12% to 14% revenue growth for 2026, a pace that would keep Netflix in the upper tier of large-cap growth stories if it delivers.[6]
Analyst commentary around those numbers was split between concern over slowing margin expansion and confidence that advertising, password-sharing crackdowns and international subscribers could keep the top line growing.[1][6][10][14] In July 2025, for example, Yahoo Finance highlighted how a blowout second quarter was overshadowed by a softer margin outlook, which knocked the stock despite strong subscriber additions.[10] By November, Forbes was asking what it would take to turn Netflix into Wall Street’s “hot pick” again, pointing to the need for sustained earnings beats and clearer visibility on profitability from newer initiatives like gaming and live sports.[12]
Against that backdrop, the current price near $108 and a consensus target around $124.80 imply moderate upside rather than a deep value setup.[1][3][5][6][7] With the 50-day moving average at $91.61, the stock is trading comfortably above its intermediate trend line, and the 52-week range from $9.48 to $115.25 shows how dramatic the post-split reset has been. For traders, that means the upcoming seasonal window will intersect with a stock that is already in a constructive trend but still carrying plenty of execution and deal risk.
What should traders watch as this Netflix seasonal window approaches?
First, the calendar. The 65-day window starting May 11 has been one of the most reliable bullish stretches in Netflix’s history, with 15 winners out of 15 and average gains north of 14%. The key question is whether the stock can hold above its 50-day moving average and push back toward the 52-week high near $115 as the window opens, or whether deal headlines and macro worries knock it off course.
Second, earnings and guidance updates. While the next scheduled earnings date in the data set was Jan 20, 2026, the market will still be trading on expectations for 12% to 14% revenue growth and the integration path for Warner Bros.[3][4][6][7] Any commentary that tightens or loosens that growth band, or that changes the narrative around advertising and password-sharing initiatives, could either reinforce or undercut the historical seasonal tailwind.
Third, positioning and flows. The December 2025 episode, when retail traders “loaded up” on Netflix after a roughly $40 billion selloff tied to acquisition skepticism, showed how quickly the crowd can swing from fear to FOMO in this name.[13] If a similar wave of retail buying or options activity appears as the late-spring window opens, it would signal that investors are leaning into the historical pattern rather than fading it.
Finally, watch the intraperiod swings. History says this window has been friendly to longs, but the MAE profile shows that 5% to 10% drawdowns inside the season have been common even in winning years. If Netflix rallies early and then gives back a chunk of those gains without breaking key support levels, that would still be consistent with the pattern. A sharp break below the 50-day moving average with no quick recovery, on the other hand, would be one of the cleaner signs that this cycle is diverging from the past.
Sources
- [1] CNBC, "Netflix's fourth-quarter results left the Street disappointed. Where analysts see the stock going" (Jan 21, 2026)
- [2] The Wall Street Journal, "Netflix Stock Drops After Streamer Posts Strong Earnings, Muted Outlook" (Jan 21, 2026)
- [3] Barchart.com, "Netflix Drops Post Q3 Earnings. Is NFLX Stock Trading at a Bargain?" (Oct 22, 2025)
- [4] The Motley Fool, "Is Now the Time to Buy Netflix Stock?" (Oct 24, 2025)
- [5] Barchart.com, "Netflix Just Announced a 10-for-1 Stock Split. Should You Buy NFLX Stock Here?" (Oct 31, 2025)
- [6] Yahoo Finance, "Netflix About To Report Q4 Earnings -- Here's What To Expect" (Jan 16, 2026)
- [7] CNBC, "Netflix gets a downgrade after announcing Warner Bros. film and streaming acquisition" (Dec 8, 2025)
- [10] Yahoo Finance, "NFLX: Netflix Stock Hit After Margin Forecast Offsets Blowout Second Quarter" (Jul 18, 2025)
- [12] Forbes, "What Could Turn Netflix Into Wall Street’s Hot Pick?" (Nov 12, 2025)
- [13] Yahoo Finance, "Retail Crowd Is Loading Up on Netflix After $40 Billion Selloff" (Dec 11, 2025)
- [14] Bloomberg, "Netflix Is at Risk of Earnings Letdown After $250 Billion Rally" (Jul 17, 2025)
About this seasonal analysis
Seasonal pattern data is sourced from TradeWave.ai, which analyzes historical price behavior across annual calendar windows going back up to 30 years. Read the full data methodology or the book The 100-Year Pattern by Afshin Moshrefi (2026 edition). Past performance of seasonal patterns does not guarantee future results. This article is for informational purposes only and does not constitute investment advice.