PTC Inc. (PTC) Has Rallied in 15 of 15 May-July Windows, Averaging 5.64% Gains
PTC Inc. is trading near the bottom of its 12‑month range just weeks before a 54‑day spring window that has delivered gains in every year of the past decade and a half.

What is the seasonal pattern for PTC Inc. (PTC)?
PTC Inc. has risen in 15 of 15 years during this May–July window, with an average gain of 5.64% in winning years.
- 15 for 15 in this window, averaging 5.64% gains in winning years across the past 15 cycles.
- Seasonal window starts May 11 and runs for 54 trading days, covering late spring into mid‑summer trading.
- Percent Profitable is 100%, with 15 winners and 0 losers over the full lookback period.
- Typical winners have posted a cumulative return of 125% across all windows, with a Sharpe ratio of 1.47 on end‑of‑window results.
- The TradeWave Ratio of 2.2 signals meaningful intraperiod travel in the long direction, even when final closes are more modest.
- Individual years have seen adverse moves as deep as about 15% inside the window before finishing higher, underscoring real drawdown risk.
According to historical data from TradeWave.ai, this late‑spring stretch has behaved very differently from an average month on the calendar for PTC Inc., and the next iteration is about to open again.
How has PTC Inc. (PTC) traded in this May–July seasonal window?
PTC Inc. has booked gains in every one of the past 15 years during the 54‑day window that begins on May 11, averaging a 5.64% rise with a long bias. Shares finished Thursday at 140.60, down 0.23% on the day and sitting about 36.0% below their 52‑week high of 219.69, with the stock hugging the lower end of its one‑year range.
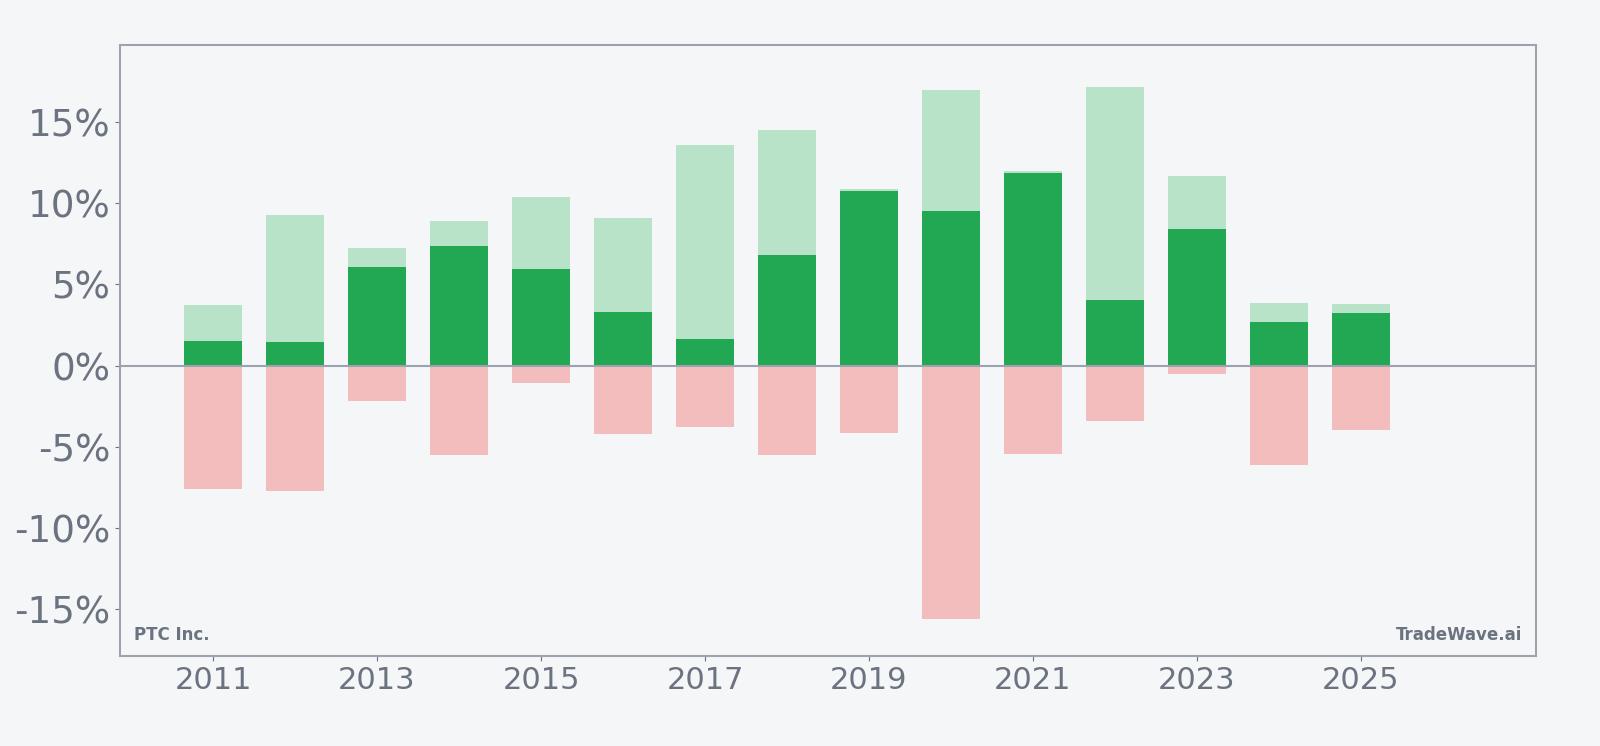
A stacked view of net results with peak rallies and worst drawdowns shows how much the stock has typically moved inside the window.
Across the full sample, the long trade direction has lined up cleanly with outcomes: 15 winners, 0 losers, and a 100% hit rate. Average profit of 5.64% per window sits on top of a 125% cumulative gain across all 15 iterations, with a Sharpe ratio of 1.47 that reflects solid risk‑adjusted performance based on end‑of‑window closes.
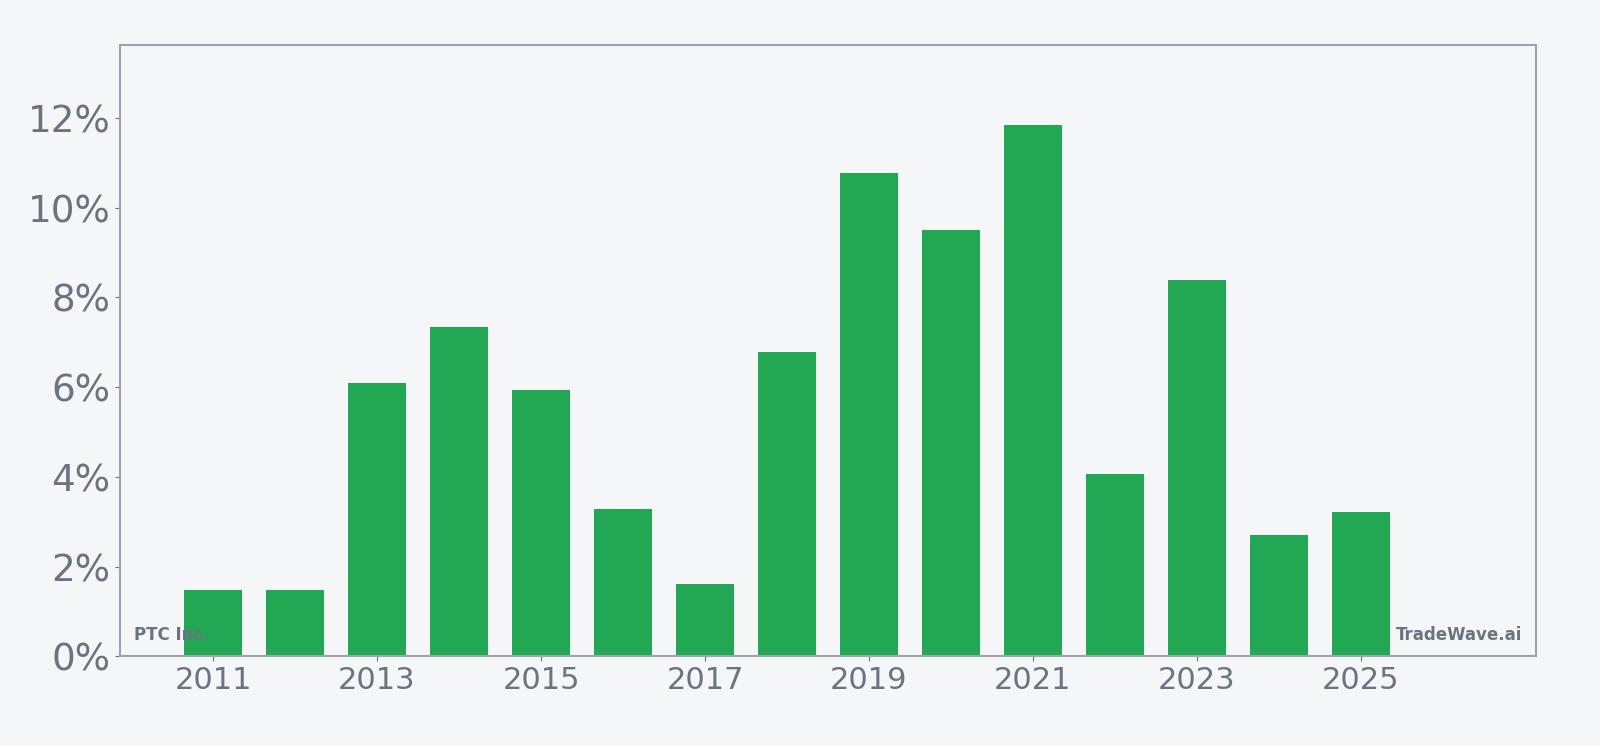
The per‑year table shows how that plays out in practice. Strong years like 2019 and 2021 delivered double‑digit net gains of 10.77% and 11.85%, while even softer years such as 2016 and 2017 still finished up 3.29% and 1.62%. The weakest outcome in the sample on a net basis was 1.62%, which means every single May–July stretch in this lookback has ended green for PTC Inc.
Intraperiod swings have been more dramatic than the final numbers suggest. Maximum favorable excursions, or the best point‑to‑peak moves inside the window, have reached as high as 17.17% in 2022 and 16.98% in 2020, showing that rallies often overshoot the eventual close. On the downside, maximum adverse excursions, or the worst drawdowns from entry, have run as deep as about 15.56% in 2020 and more than 6% in 2024, reminding traders that even winning windows can feel rough in the middle.
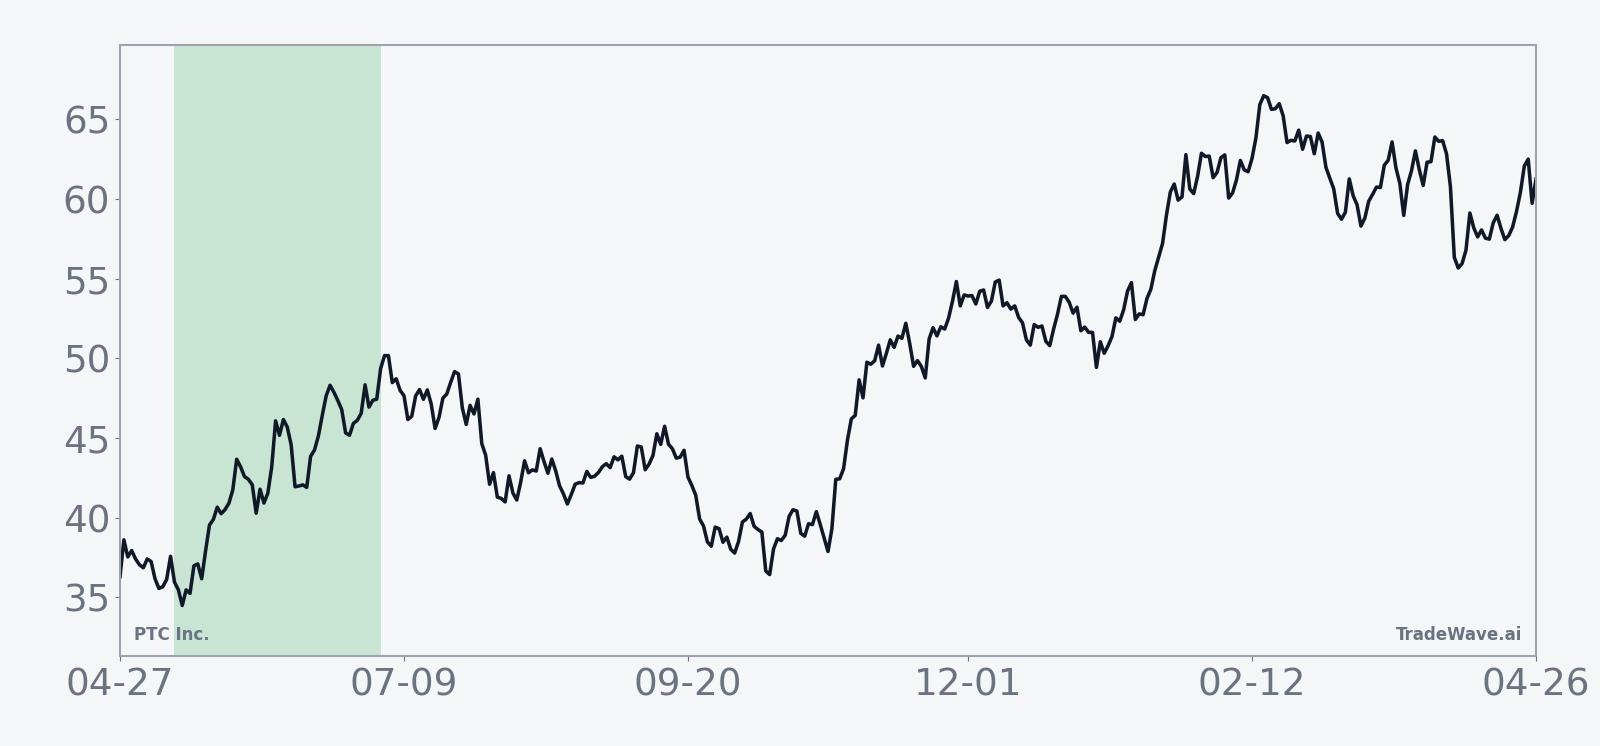
The 15‑year seasonal trend chart tilts upward fairly steadily, with gains tending to build rather than spike in a single burst. That suggests a pattern where PTC Inc. often grinds higher through late spring and early summer instead of relying on one or two outsized days. The cumulative return profile reinforces this, with the average path climbing over the 54‑day span rather than chopping sideways.
Year‑by‑year bars that combine net results with peak rallies and worst drawdowns show a consistent story: upside has usually been larger than downside, but the stock has rarely moved in a straight line. In several years, such as 2018 and 2020, PTC Inc. first dipped several percentage points below the starting level before reversing into strong gains, a pattern that can shake out weak hands even in a bullish seasonal window.
History does not guarantee future results; adverse excursions can be large even in winning windows, and traders should treat this pattern as context rather than a forecast.
Why does PTC Inc. (PTC) follow this seasonal pattern?
One likely driver is the clustering of software earnings updates and guidance resets in late spring, which can reset expectations and fuel trend moves in application and industrial software names. Institutional portfolio managers also tend to rebalance around mid‑year, which can favor higher‑conviction growth holdings after early‑year volatility. For a design and product‑lifecycle software provider like PTC Inc., that combination of earnings visibility and allocation flows may help explain why this May–July window has repeatedly leaned positive.
What is driving PTC Inc. (PTC) today?
PTC Inc. closed Thursday at 140.60, down 0.23% on the session, extending a one‑month slide of 1.65% and leaving the stock about 6.9% above its 52‑week low of 130.94 while sitting well below the 50‑day moving average of 149.56. Trading volume of roughly 892,000 shares came in below the recent 20‑day average of about 1.04 million, suggesting a quiet tape as investors wait for the next catalyst.
The chart below situates the latest move against the past year of trading and a 60‑day seasonal projection.
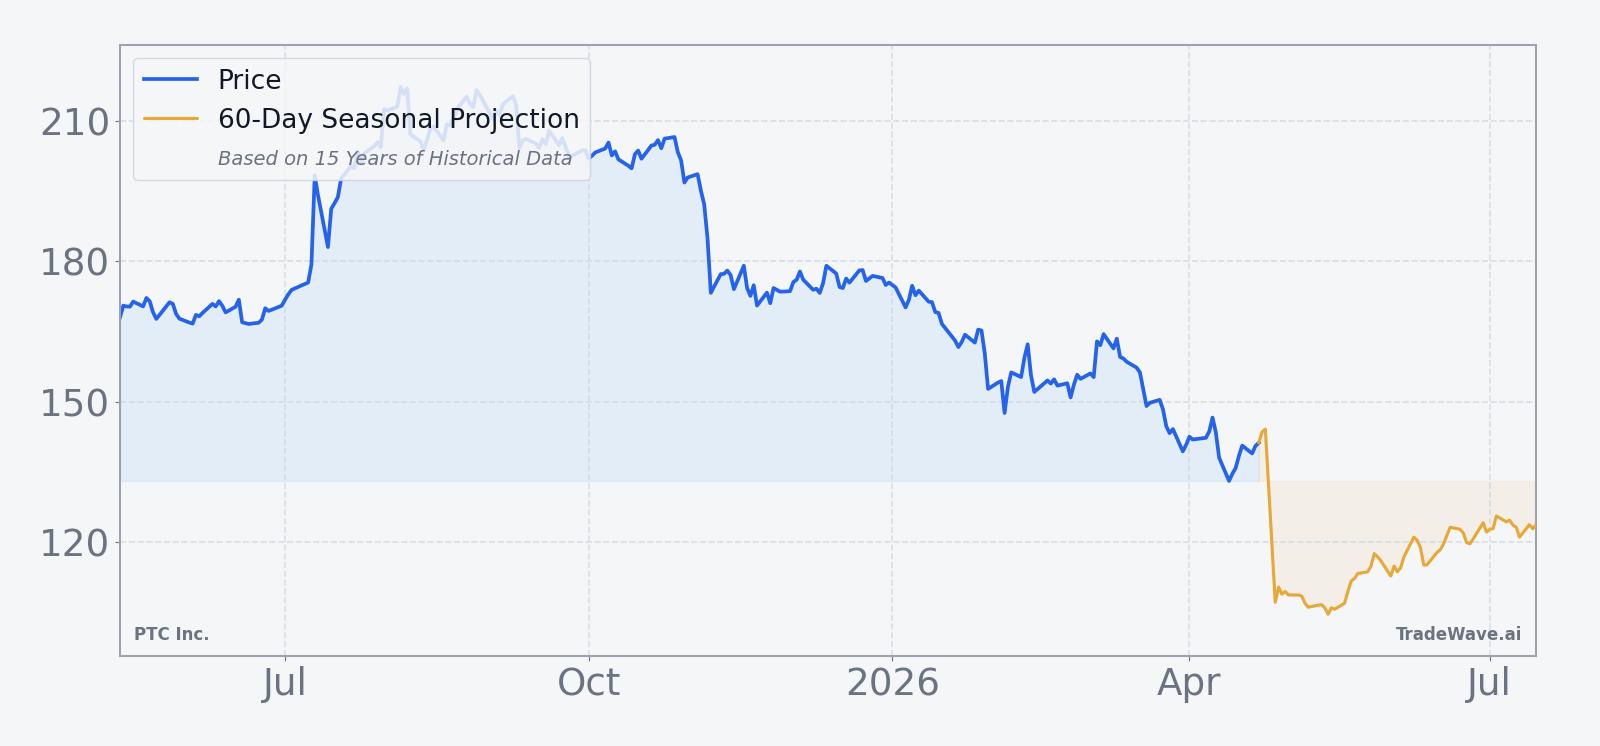
With no fresh earnings date, guidance update, or major sector headline in the latest data, the near‑term story is mostly technical. PTC Inc. is trading below its 50‑day moving average and closer to its 52‑week low than its high, which means the upcoming seasonal window will open from a relatively depressed starting point. For traders who track historical seasonality, that setup makes the May 11 start date a notable waypoint on the calendar rather than just another day in a drifting tape.
What should traders watch as the May 11 window approaches?
First, the calendar. The 54‑day PTC Inc. trading window tied to this historical pattern opens on May 11 and runs into mid‑summer, so any shift in momentum around that date will be watched closely by seasonal traders. A move back above the 50‑day moving average near 149.56 during the window would signal that price is starting to behave more like the historical spring pattern than the recent downtrend.
Second, volatility inside the window. Past years show that maximum adverse excursions have sometimes reached double‑digit losses before the stock recovered, so a sharp early dip would not automatically break the pattern. What would contradict the historical playbook is a sustained move that finishes the window below the May 11 starting level, something that has not happened in this 15‑year sample.
Third, catalysts. While the latest dataset does not flag a specific upcoming earnings date, any announcement that lands inside the May–July stretch could amplify the existing seasonal bias, for better or worse. Traders will be watching how PTC Inc. reacts to its next fundamental update relative to this historical spring tailwind.
Add it up: PTC Inc. is heading into a 15‑for‑15 seasonal window from a weak price base, with history pointing to upside but the path often running through real drawdowns. How the stock behaves between May 11 and the end of the 54‑day window will show whether this long‑running pattern still has teeth in the current cycle.
Sources
About this seasonal analysis
Seasonal pattern data is sourced from TradeWave.ai, which analyzes historical price behavior across annual calendar windows going back up to 30 years. Read the full data methodology or the book The 100-Year Pattern by Afshin Moshrefi (2026 edition). Past performance of seasonal patterns does not guarantee future results. This article is for informational purposes only and does not constitute investment advice.