14-for-14: Fidelity National Information Services (FIS) Enters a 65-Day Window With 100% Gains
Fidelity National Information Services just moved into a 65-day seasonal window that has never produced a loss in the past 14 years, even as shares trade near their 52-week low and investors digest its new AI crime-fighting push.

What is the seasonal pattern for Fidelity National Information Services (FIS)?
Fidelity National Information Services has risen in 14 of 14 years during this May-to-summer window, with an average gain of 4.89% in winning years.
- 14 for 14 in this 65-day window, with average gains of 4.89% across all winning years.
- Seasonal window runs from May 12 for 65 trading days and has historically favored long positions in FIS.
- Percent Profitable is 100%, with 14 winners and 0 losers across the 14-year lookback.
- TradeWave Ratio of 1.75 suggests price typically travels meaningfully in the trade direction within the window.
- Sharpe ratio of 1.08 points to a solid risk-adjusted profile for this specific FIS seasonal trend.
- Intraperiod swings have included notable drawdowns in some years, so gains have not come in a straight line.
According to historical data from TradeWave.ai, this stretch of the calendar has behaved very differently for Fidelity National Information Services than an average month. The next section looks at how that pattern has played out and where the risk has tended to cluster.
How has Fidelity National Information Services (FIS) traded in this 65-day window?
Fidelity National Information Services has posted gains in 14 of 14 years during this 65-day spring-to-summer window, averaging a 4.89% profit for long positions. The latest iteration of the pattern begins today with the stock at about 47.6% below its 52-week high of roughly 80.79 and hovering just above its 52-week low of 41.64. That combination of a clean historical win streak and a depressed starting point gives this year’s FIS seasonal window unusual tension.
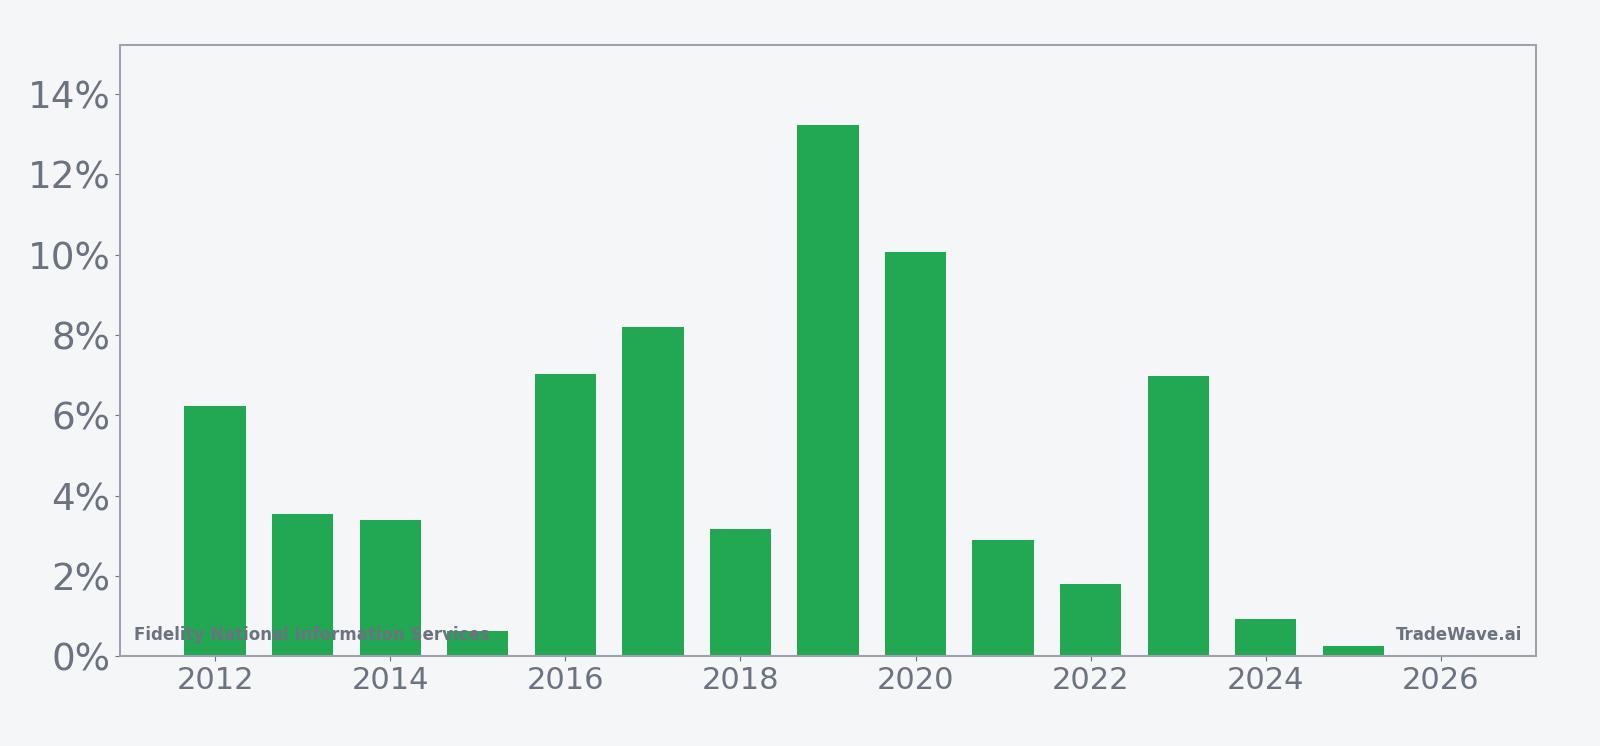
Across the 14-year history, the strongest year in this Fidelity National Information Services trading window was 2019, when the stock gained 13.24% from entry to exit, while the weakest was 2025 with a modest 0.26% rise. Average winners at 4.89% sit between those extremes, suggesting that while the FIS seasonal trend has been consistently positive, the magnitude of gains has varied widely from year to year.
Intraperiod swings have been meaningful. In 2019, the maximum favorable move, or best point-to-peak excursion, reached 13.52%, while the maximum adverse move, or worst drawdown from entry, was a small 0.32%. By contrast, 2016 saw a 7.03% net gain but included a worst drawdown of 4.87%, showing that even winning years have tested conviction before finishing higher.
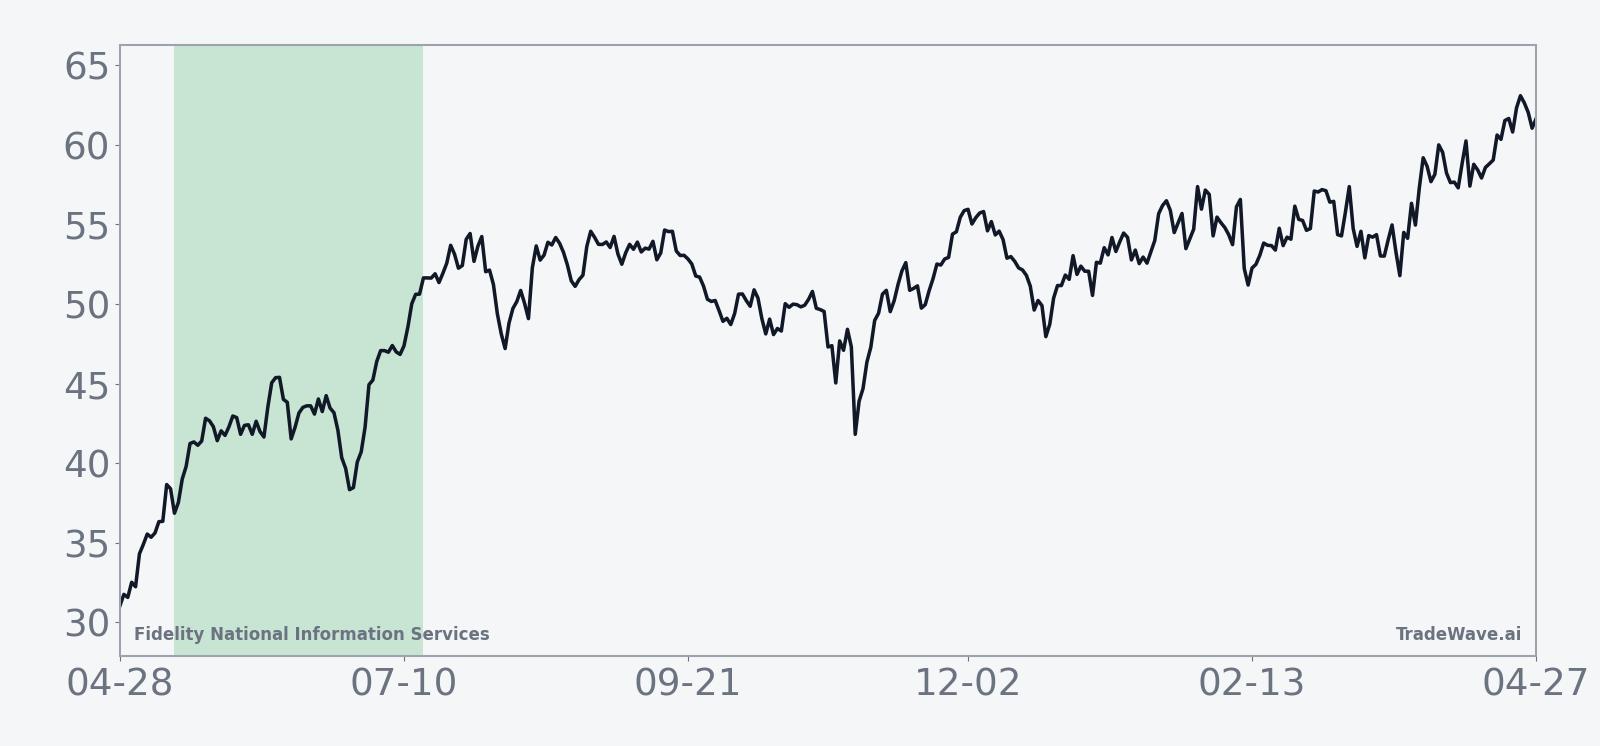
The historical seasonal average for this FIS window shows gains tending to build gradually rather than in a single burst, with the curve grinding higher through much of the period. That profile lines up with the long bias in the TradeWave stats, where Trend Short readings are low and the pattern has favored patient long exposure over quick flips.
Year-by-year bars with peak rallies and worst drawdowns show how often FIS has swung sharply inside an otherwise positive window.
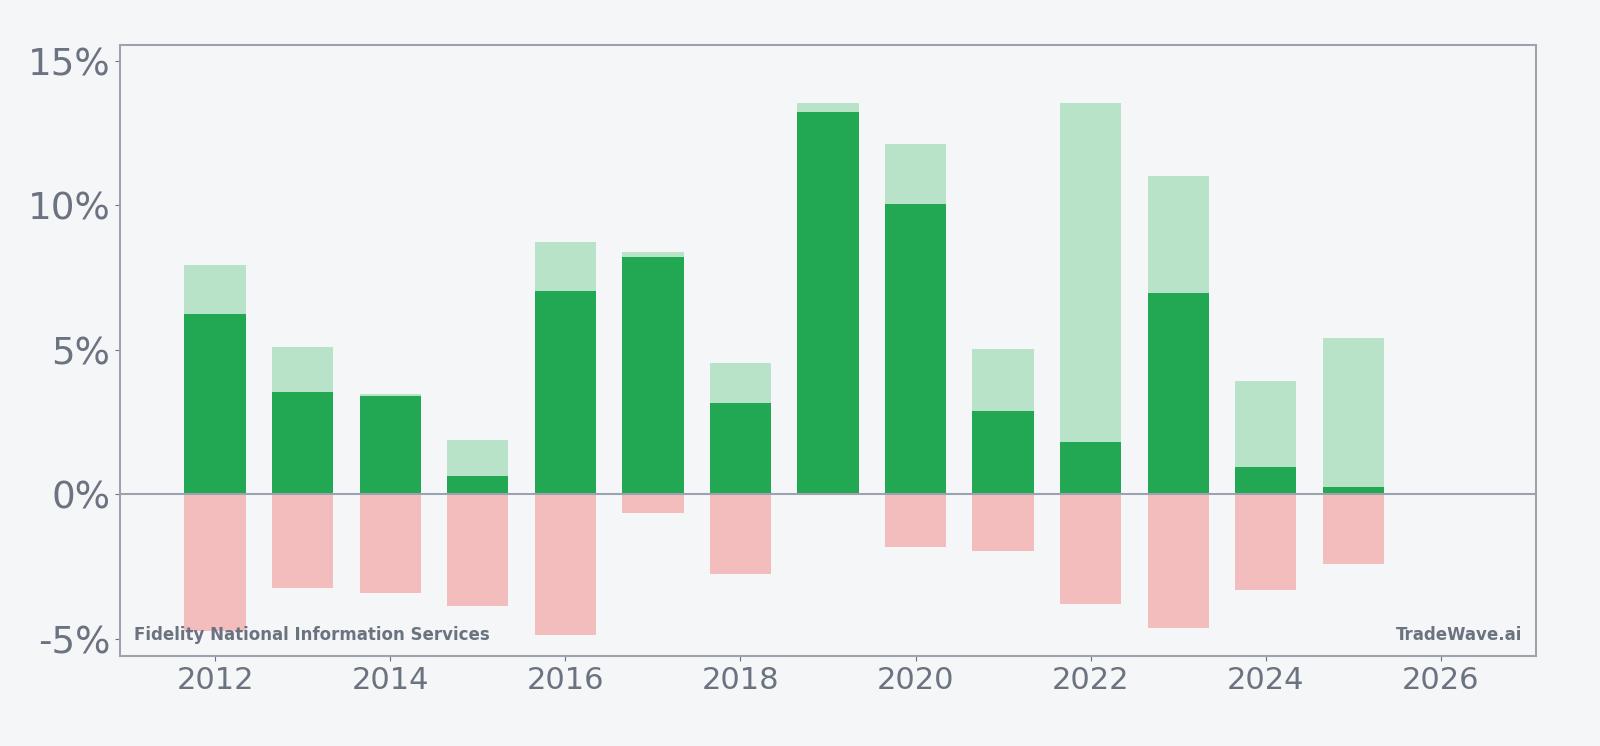
Those bars highlight a key nuance: several years, such as 2022 and 2023, saw double-digit peak rallies inside the window, with maximum favorable excursions of 13.52% and 11.02% respectively, but also experienced drawdowns of 3% to 5% along the way. The pattern is clear: this window has favored longs in every year of the sample, but the path has often involved sizable swings before the final gain locked in.
History does not guarantee future results; adverse excursions (MAE) can be large even in winning windows.
Why does Fidelity National Information Services (FIS) follow this seasonal pattern?
One likely driver is the timing of bank and fintech spending cycles, as large financial institutions finalize midyear technology budgets and push projects with vendors like Fidelity National Information Services. Analysts have also pointed to portfolio rebalancing in payment and processing stocks around midyear, which can create steady inflows into names that screen as value or restructuring stories. This FIS seasonal pattern may reflect that mix of budgeted tech spend, sector rotation in financial technology, and institutional positioning rather than any single catalyst.
What is driving Fidelity National Information Services (FIS) today?
Fidelity National Information Services shares closed at 42.31 on Monday, down 2.7% on the day and roughly 47.6% below their 52-week high near 80.79, with the stock trading just above its 52-week low of 41.64 on heavy volume of about 6.5 million shares versus a 20-day average near 5.0 million. The slide leaves FIS well under its 50-day moving average around 47.72, underscoring how far sentiment has reset after years of restructuring and portfolio changes.
Near-term attention is fixed on the company’s push into artificial intelligence for banks. On May 4, The Wall Street Journal reported that Anthropic and Fidelity National Information Services are building an AI agent to help banks detect and prevent financial crimes, a move that could deepen FIS’s role in compliance workflows and potentially open new revenue streams in financial crime prevention and risk analytics.[2] The partnership also slots FIS more squarely into the “fintech and AI in banking” theme, where investors have been willing to pay up for credible growth stories tied to automation and fraud detection.[2]
Longer-running legal overhangs remain in the background. In November 2025, law firm Halper Sadeh LLC said it was investigating Fidelity National Information Services for potential breaches of fiduciary duties by officers and directors, urging shareholders to contact the firm to discuss their rights.[1] That kind of shareholder-rights scrutiny has become common across the payments and processing space, but it can still influence how some investors handicap governance risk and potential strategic moves.
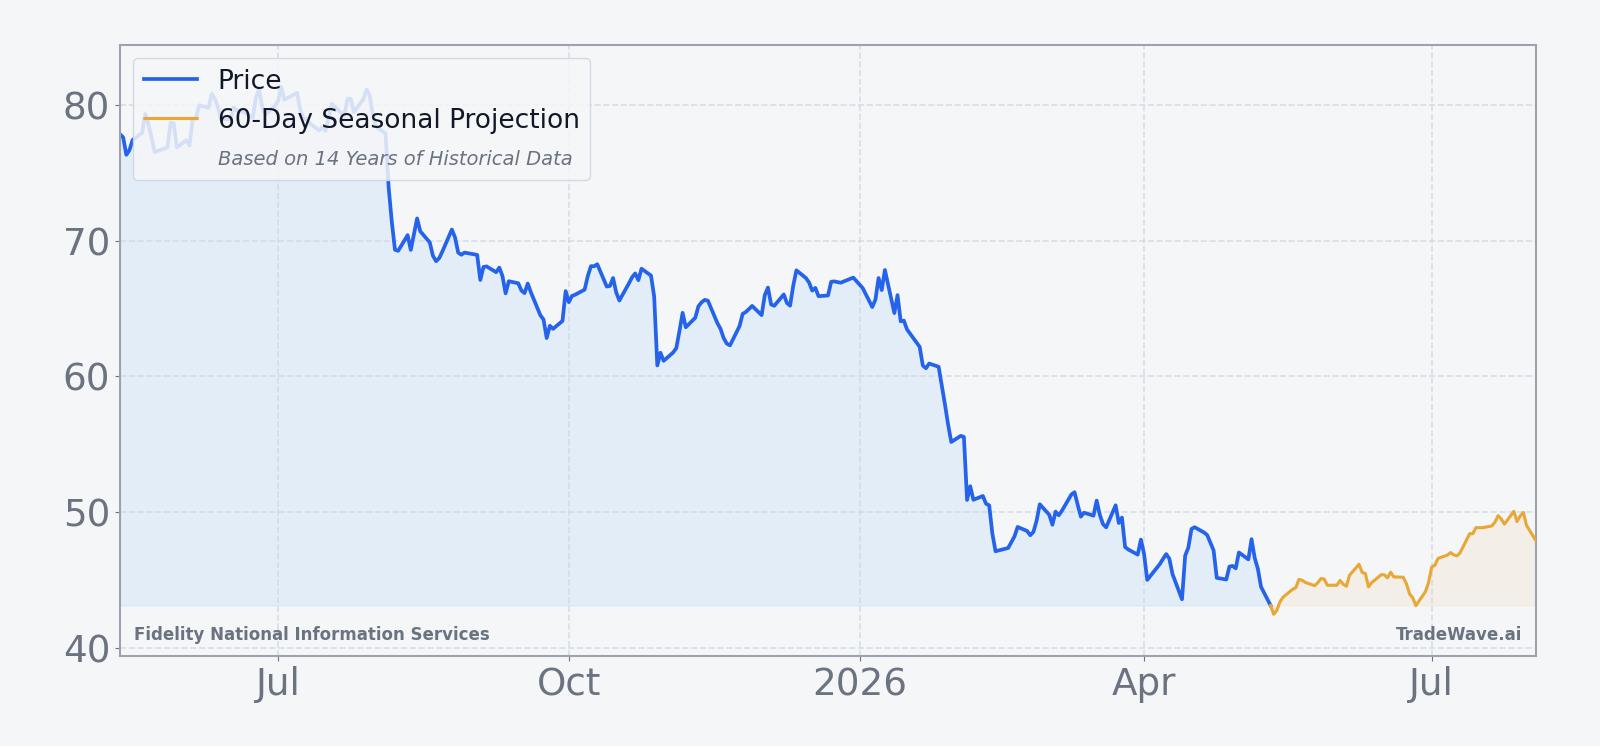
The chart below situates the latest move in its recent multi-month context and overlays the next 60 days of the historical seasonal projection.
How do earnings, macro trends and valuation frame this FIS seasonal window?
Fidelity National Information Services has not yet set a confirmed date for its next earnings release in the available data, leaving investors to trade the seasonal window without a clearly defined results catalyst on the calendar. That absence can cut both ways: some seasonal windows are dominated by earnings gaps, while others, like this one, have historically played out through a series of smaller news items, client wins and macro headlines rather than a single binary event.
On the macro side, the key story for FIS is less about broad economic growth and more about how banks and financial institutions are prioritizing technology budgets. The Anthropic partnership underscores that compliance, fraud detection and financial crime prevention remain high on the spending list, even as banks trim costs elsewhere.[2] For a stock that has already been repriced sharply lower from its highs, any evidence that AI-enabled services can stabilize or grow revenue could matter more than small shifts in GDP or rate expectations during this window.
Valuation context is thin in the current dataset, but the price action itself tells a story. Trading at roughly half its 52-week high and below its 50-day moving average, FIS sits in territory where value-oriented investors often start to re-engage, especially when a company is leaning into secular themes like AI in banking. The historical FIS seasonal trend has rewarded that kind of contrarian timing in prior years, though the path has rarely been smooth.
What should traders watch in this FIS seasonal window?
Three things will matter most as this 65-day Fidelity National Information Services trading window unfolds. First, price behavior relative to the 41.64 52-week low: in prior years, the seasonal pattern has worked from a variety of starting points, but a decisive break below that level would signal that current fundamentals are overwhelming the historical tendency. Second, how the stock trades around any updates or client wins tied to the Anthropic AI crime-prevention partnership, since concrete adoption news could validate the fintech and AI in banking narrative that underpins part of the bull case.[2]
Third, intraperiod volatility: traders should monitor whether drawdowns inside the window resemble the 3% to 5% adverse moves seen in years like 2016, 2022 and 2023, or whether selling pressure deepens beyond that range. If FIS can hold above its recent lows while showing the kind of steady grind higher that has characterized past seasonal windows, it would line up with the 14-for-14 historical record. If instead the stock slices through support and fails to recover, that would be a clear sign that this year is breaking from the usual FIS seasonal pattern.
Sources
About this seasonal analysis
Seasonal pattern data is sourced from TradeWave.ai, which analyzes historical price behavior across annual calendar windows going back up to 30 years. Read the full data methodology or the book The 100-Year Pattern by Afshin Moshrefi (2026 edition). Past performance of seasonal patterns does not guarantee future results. This article is for informational purposes only and does not constitute investment advice.