Near 52-Week High, Cisco (CSCO) Faces 86% Short-Side Win Rate in Coming Mid-May Slide
Cisco is trading just below record territory on AI optimism as it heads into a mid-May seasonal window that has historically favored short setups.

What is the seasonal pattern for Cisco (CSCO)?
Cisco has fallen in 6 of 7 mid-May windows during midterm election years, with an average gain of 5.56% in winning short years.
- 6 for 7 in this window, with winning short years averaging 5.56% moves in Cisco’s favor.
- The 14-day window starts May 16 and is grouped across the last 7 midterm election years.
- Percent Profitable is 86%, with 6 winners and 1 loser for the short-side pattern.
- Avg Profit - All, which includes the lone losing year, still comes in at 5% for the short direction.
- Maximum adverse excursions have reached as deep as -16.29% intraperiod, underscoring the risk of sharp squeezes.
- The TradeWave Ratio of 1.27 and Sharpe ratio of 1.25 point to a historically efficient but volatile short window.
According to historical data from TradeWave.ai, this mid-May stretch has behaved very differently from an average month for Cisco, and the next iteration is just days away.
How has Cisco (CSCO) traded in this mid-May election-cycle window?
Cisco has delivered profitable short setups in 6 of the last 7 mid-May windows during midterm election years, with winning years averaging 5.56% moves in the trade direction. Shares finished Friday at 92.16, up 0.6% on the day and about 2.7% below the 52-week high of 94.72.[8] That puts the stock near the top of its recent range just as a historically bearish-for-price, bullish-for-shorts window opens on May 16.
Grouping the data by the presidential election cycle matters here because midterm years often bring policy uncertainty, budget wrangling and shifting regulation that hit large-cap tech spending plans. For a networking heavyweight tied to enterprise and cloud capex like Cisco, those mid-cycle pauses have historically shown up in short, sharp trading windows rather than smooth trends.
Across those seven midterm-year samples, the pattern is defined as a short. Negative returns for the stock price are favorable outcomes for the strategy, while upside squeezes mark losing years. Percent Profitable sits at 86%, with 6 winners and just 1 loser, and the all-years average outcome of 5% in the trade direction shows that the lone losing year did not erase the edge.
Average profit in winning years is 5.56%, which is meaningfully higher than the -1.27% average loss in the single losing year. That gap is what lifts the Sharpe ratio to 1.25, a solid risk-adjusted profile for a two-week window. The TradeWave Ratio of 1.27 indicates that, within the window, Cisco’s price has typically traveled a sizable distance in the short direction before the period ends, even when intraday swings cut into the final close.
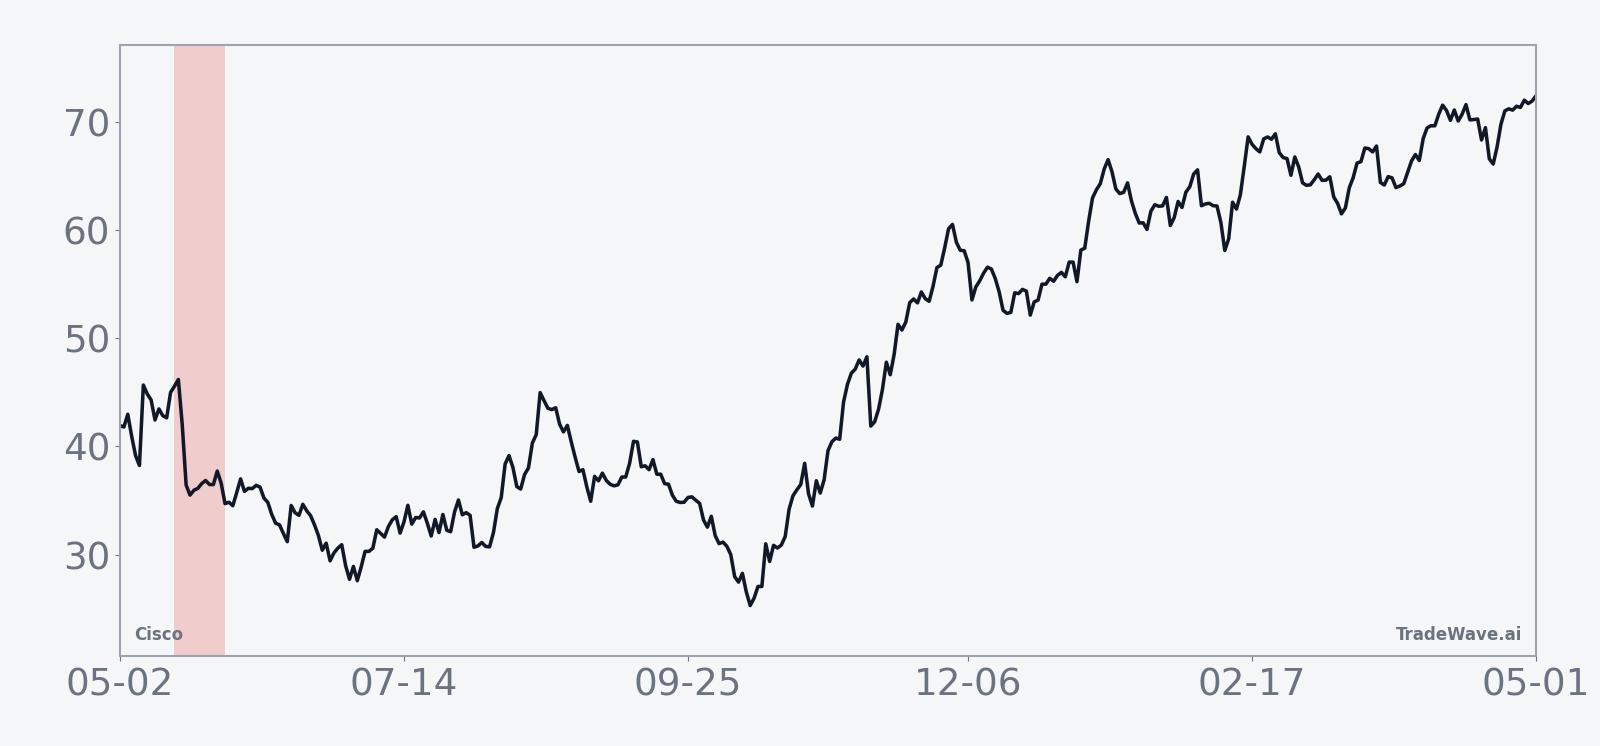
The historical seasonal trend chart shows that, in many years, the bulk of the move has tended to occur early in the window, with pressure building in the first several sessions before flattening out. That pattern fits a narrative where investors react quickly to macro or policy headlines in mid-May, then stabilize as the news flow clears.
Year-by-year bars with maximum favorable and adverse moves show how far Cisco has swung inside this window.
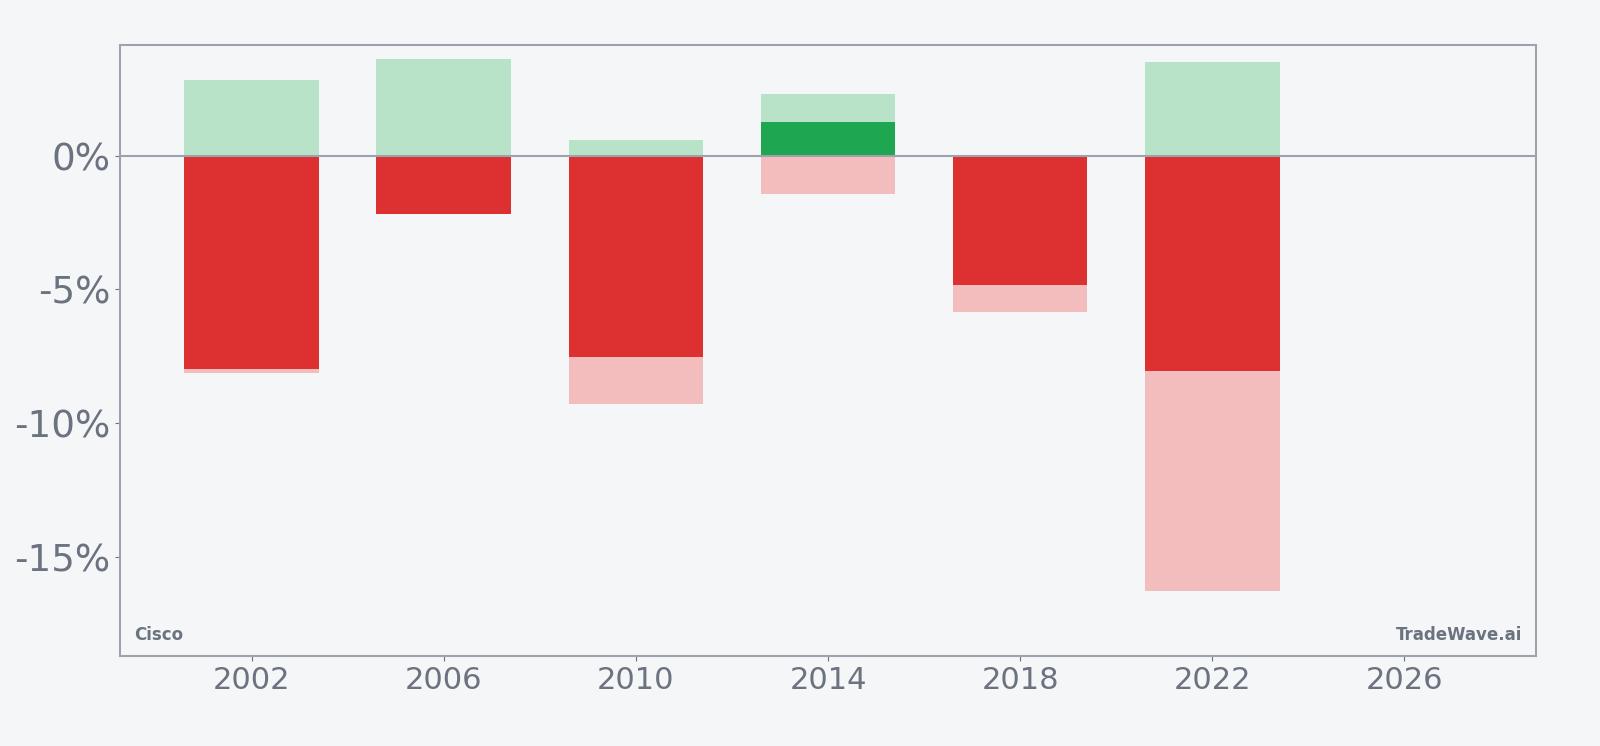
The per-year bars with maximum favorable and adverse excursions underline how volatile this Cisco trading window can be. In 2022, for example, the best intraperiod move in the short direction reached 3.51%, but the worst drawdown from entry stretched to -16.29%, a reminder that even ultimately profitable shorts have faced violent squeezes inside the window. Earlier cycles such as 2010 also saw deep adverse moves of -9.29% before finishing as winning short years, while the lone losing year in 2014 still posted a modest 2.3% favorable swing before reversing.
History does not guarantee future results, and maximum adverse excursions can be large even in winning windows, so traders should size risk accordingly.
Why does Cisco (CSCO) follow this seasonal pattern?
One likely driver is the way enterprise and government IT budgets line up with the fiscal and policy calendar in midterm election years, creating short bursts of hesitation around mid-May. Analysts have also pointed to sector rotation in large-cap tech during these years, as investors rebalance between AI beneficiaries and more defensive names when Washington headlines heat up.[5] This mid-May Cisco trading window may reflect that temporary pause in networking and data center spending enthusiasm before the typical pre-election year tailwind resumes.
What is driving Cisco (CSCO) today?
Cisco closed Friday at 92.16, up 0.52 on the session, extending a roughly 9.5% gain over the past month as the stock pushes toward its 52-week high of 94.72.[8] The move caps a stretch in which Cisco has ridden a wave of AI infrastructure demand, with networking revenue up 21% in its fiscal second quarter and management guiding to full-year revenue between $61.2 billion and $61.7 billion.[1] In February 2026, Cisco topped earnings and revenue expectations but saw its shares wobble as investors focused on guidance and the pace of AI orders, a reminder that expectations are already high.[1][2][7] In March 2026, chart-based analysis from CNBC highlighted that Cisco had finally broken above its dot-com era highs, framing the stock as a potential leadership name in large-cap tech rather than a laggard.[8]
The chart below situates the latest move against Cisco’s past year of trading and a 60-day seasonal projection.
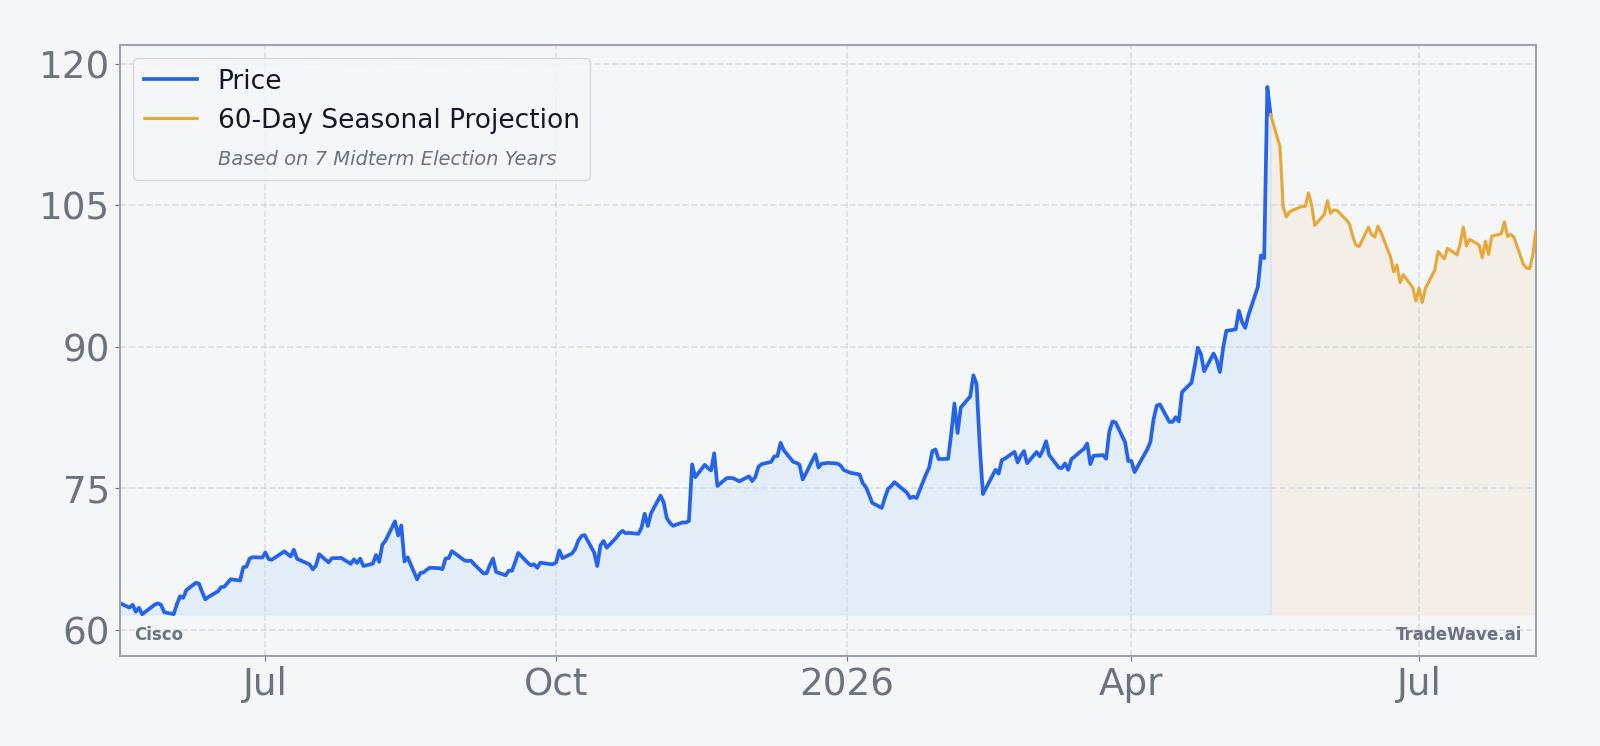
Macro themes remain supportive in the background. AI infrastructure demand from hyperscalers has been a key tailwind, with Reuters reporting in November 2025 that strong equipment orders helped lift Cisco shares in Europe.[6] Sector commentary around networking and AI has emphasized that Cisco’s Silicon One chips and data center offerings position it to capture a meaningful slice of that capex cycle.[4] At the same time, the consensus analyst rating sits at Buy with a 90 price target from LSEG data cited by CNBC, a level that now sits slightly below the current share price and reflects earlier price regimes rather than today’s breakout zone.[2][3][5]
Looking back to late 2025, Cisco’s stock jumped 7.22% in premarket trading after an AI-fueled earnings beat and raised outlook, underscoring how quickly sentiment can swing when orders surprise to the upside.[3][4][6][9] That kind of gap behavior is exactly what makes the upcoming seasonal window worth watching: the historical pattern favors shorts, but the fundamental story is one of renewed growth and a stock that has finally cleared a two-decade ceiling.
Sources
- [1] CNBC, "Cisco's stock drops 7% on mediocre forecast even as earnings and revenue top estimates" (Feb 11, 2026)
- [2] CNBC, "Cisco shares slide after earnings fail to wow the Street. Here's our plan for the stock" (Feb 12, 2026)
- [3] CNBC, "We're increasing our Cisco Systems price target after an AI-fueled beat and raise" (Nov 13, 2025)
- [4] CNBC, "Cisco beats on earnings and guidance, lifting stock" (Nov 12, 2025)
- [5] CNBC, "Cisco has finally surpassed its dotcom bubble high. Is the reinvented stock a buy from here?" (Feb 3, 2026)
- [6] Reuters, "Cisco shares climb on strong AI-fueled equipment demand" (Nov 13, 2025)
- [7] Barron's, "Cisco Stock Falls Despite Earnings Beat" (Feb 11, 2026)
- [8] CNBC, "Cisco may finally extend meaningfully beyond prior highs, based on latest chart action" (Mar 25, 2026)
- [9] CNBC, "Stocks making the biggest moves premarket: Walt Disney, Cisco Systems, Firefly Aerospace and more" (Nov 13, 2025)
- [10] Forbes, "How Will Cisco's Stock React To Its Upcoming Earnings?" (May 13, 2025)
About this seasonal analysis
Seasonal pattern data is sourced from TradeWave.ai, which analyzes historical price behavior across annual calendar windows going back up to 30 years. Read the full data methodology or the book The 100-Year Pattern by Afshin Moshrefi (2026 edition). Past performance of seasonal patterns does not guarantee future results. This article is for informational purposes only and does not constitute investment advice.