Parker Hannifin (PH) Has Dropped in Every One of the Last 10 Midterm Summer Windows
Parker Hannifin is approaching a historically bearish 57-day midterm-year window even as the stock trades near record territory, setting up a sharp test of its industrial-seasonal pattern.

What is the seasonal pattern for Parker Hannifin (PH)?
Parker Hannifin has fallen in 10 of 10 midterm-year summer windows during this 57-day stretch, with an average gain of 8.99% in winning years for short positions.
- 10 for 10 in this window, with short trades averaging 8.99% gains across the last 10 midterm election years.
- Seasonal direction is bearish: the 57-day window starting May 17 has historically favored downside in Parker Hannifin.
- Percent Profitable is 100%, with 10 winners and 0 losers for the short-side pattern in this election-cycle slice.
- Average winner profit of 8.99% comes with a Sharpe ratio of 1.3, indicating strong risk-adjusted returns for the window.
- The TradeWave Ratio of 1.85 signals that price typically travels meaningfully in the trade direction during the window, highlighting active swings.
- Intraperiod drawdowns have still been sizable in some years, so even a historically strong short window has carried real risk.
According to historical data from TradeWave.ai, this midterm-year stretch has behaved very differently from an average summer for Parker Hannifin. The next section walks through how that election-cycle pattern has played out and what it implies for the upcoming 57-day window.
How has Parker Hannifin (PH) traded in this midterm-year summer window?
Parker Hannifin has fallen in every single one of the last 10 midterm election years during this 57-day window, with short trades averaging 8.99% gains. The stock last closed at 878.51, leaving it about 15.1% below its 52-week high of 1,034.96 and well above its 52-week low near 597.18, so the upcoming window will test whether that elevated level can withstand a historically weak stretch.
Because this pattern is grouped by the presidential election cycle, it only looks at Parker Hannifin’s behavior in the midterm election year, not in every calendar year. That matters in 2026 because the market is in the midterm election year phase, a part of the cycle that often features policy uncertainty, shifting fiscal expectations and more volatile industrial-sector positioning as investors handicap the next two years of infrastructure and defense spending.
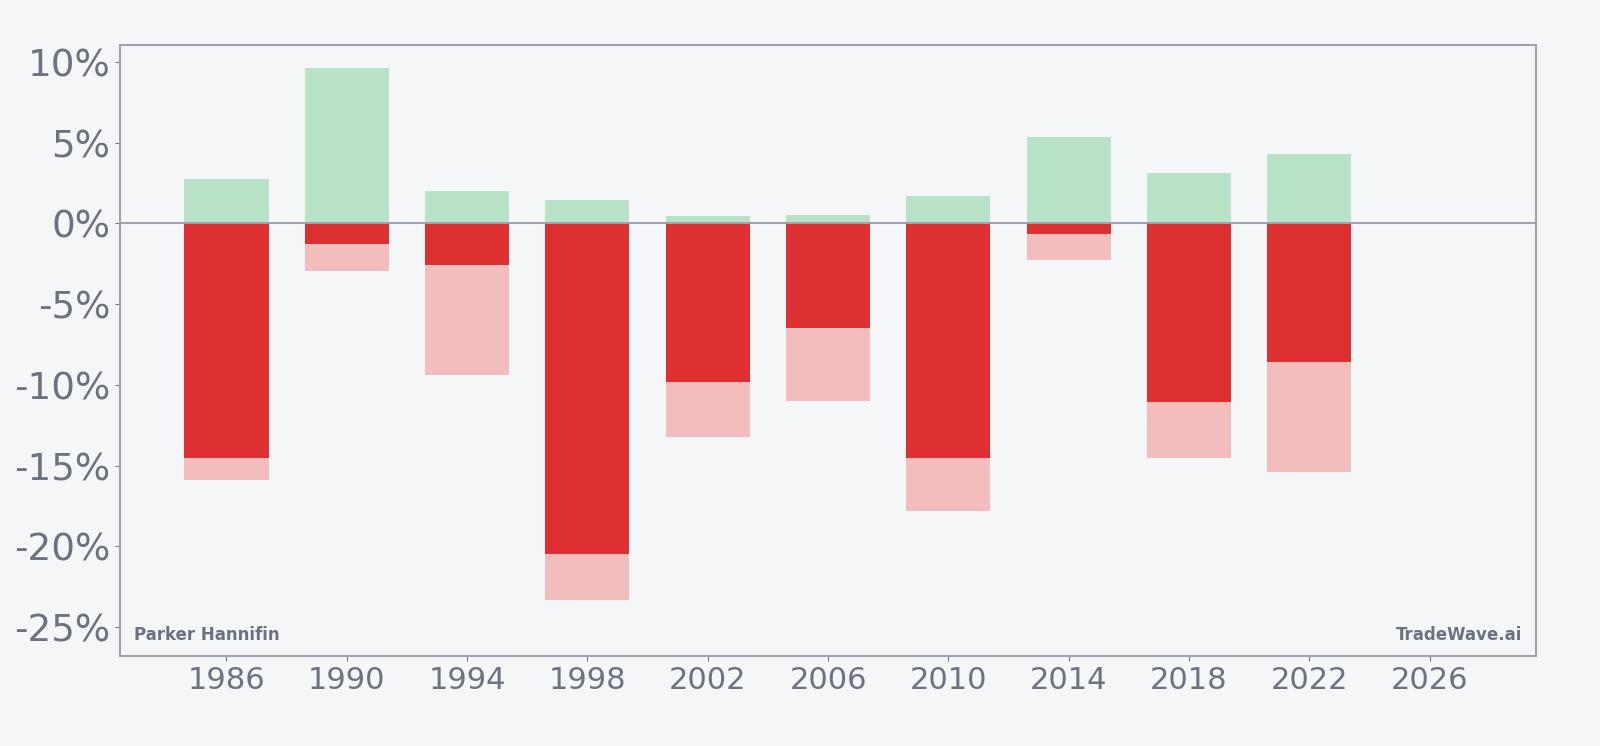
A second view layers in both the best and worst intraperiod swings for each year, highlighting how far price has tended to travel before the window closes.
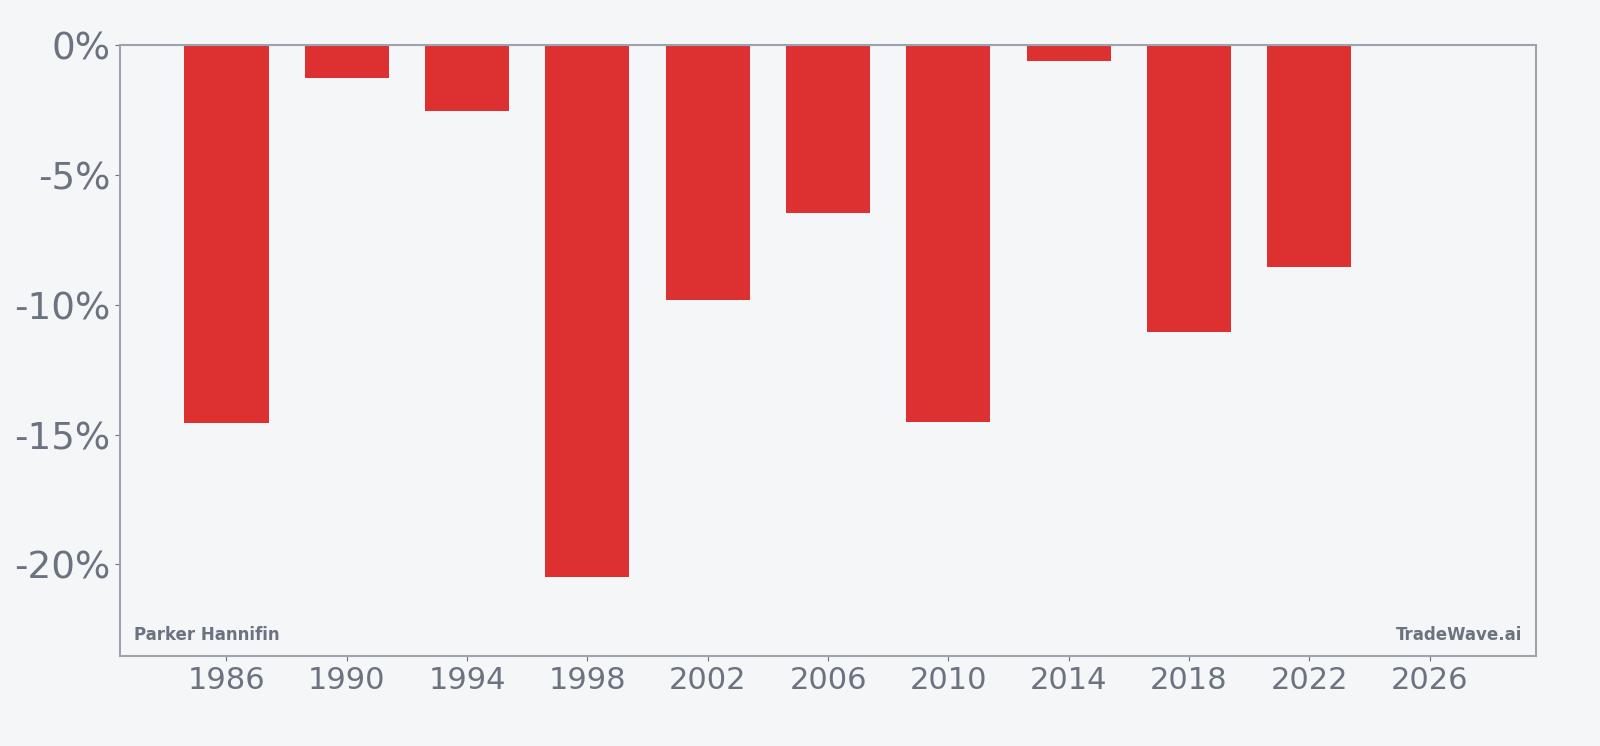
The trade direction for this pattern is short, and the history is unusually one-sided. Across the last 10 midterm election years, every iteration of this 57-day Parker Hannifin trading window finished with the stock lower, which translated into 10 winning short trades and a 100% Percent Profitable record. Average profit for those short positions was 8.99%, while the median outcome was a 9.19% gain, suggesting the typical year has delivered a mid-to-high single-digit move in the trade direction rather than being skewed by a single outlier.
The per-year table shows that the strongest short year was 1998, when the stock fell 20.47% during the window, while 1986 and 2010 also posted double-digit declines of 14.54% and 14.5% respectively. On the milder side, 1990 and 2014 saw net drops of just 1.26% and 0.64%, reminding traders that even a perfect win record can include relatively flat stretches. The Sharpe ratio of 1.3, calculated on end-of-window outcomes, points to a favorable balance between average return and volatility for this specific short setup.
Intraperiod swings have been meaningful. Maximum favorable excursion, or the best point-to-peak move in the trade direction, reached 9.62% in 1990 and 5.35% in 2014, while several other years saw smaller but still notable favorable runs. Maximum adverse excursion, the worst drawdown from entry, has at times been deeper than the final profit, including a 23.32% adverse move in 1998 and a 17.8% drawdown in 2010 before the trades ultimately finished in the green. That mix of large MFE and large MAE in some cycles lines up with the TradeWave Ratio of 1.85, which measures how far price typically travels in the trade direction within the window independent of the final close.
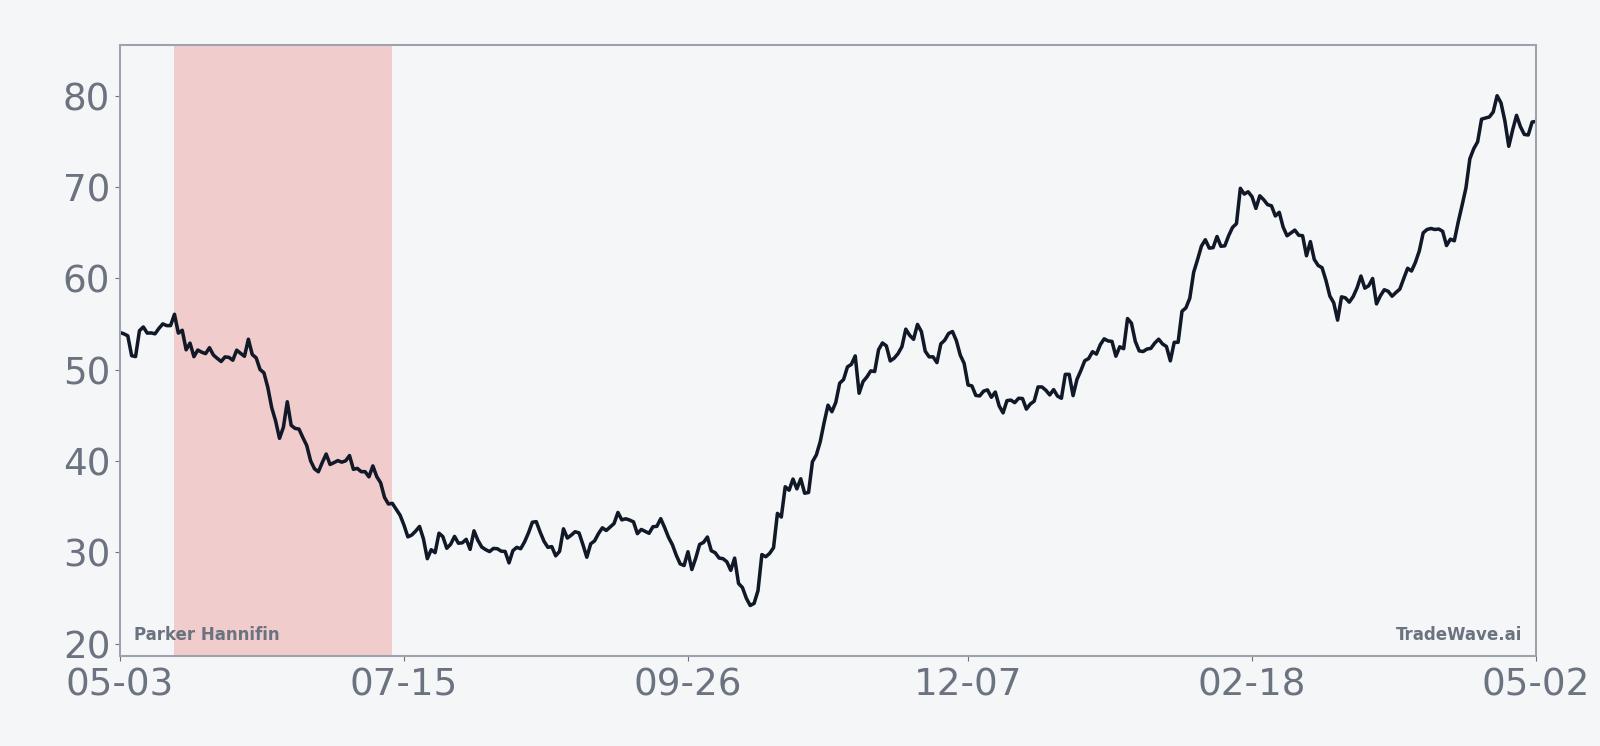
The historical seasonal trend chart suggests that weakness has often been front-loaded, with Parker Hannifin tending to roll over early in the window and then grind lower rather than collapsing all at once. The cumulative return profile across the 10 midterm-year samples builds to a 132% total gain for the short strategy, equivalent to an annualized return of 8.82% when the pattern is applied only in this 57-day slice. Add it up: 10 for 10, with a steady bias toward lower prices during this specific midterm-year summer stretch.
History does not guarantee future results; even in a window with a perfect win record, adverse excursions have at times been large enough to challenge conviction before the pattern played out.
Why does Parker Hannifin (PH) follow this seasonal pattern?
One likely driver is the way industrials like Parker Hannifin sit at the intersection of policy and capital spending in midterm election years. Analysts often point to midyear budget debates, shifting expectations for infrastructure and defense outlays, and portfolio rebalancing ahead of the stronger pre-election year as reasons institutional investors trim cyclical exposure in this part of the cycle. This pattern may also reflect a tendency for earnings guidance resets and cautious management commentary to cluster in late spring and early summer, creating a softer backdrop for a stock that has already run hard into the midterm year.
What is driving Parker Hannifin (PH) today?
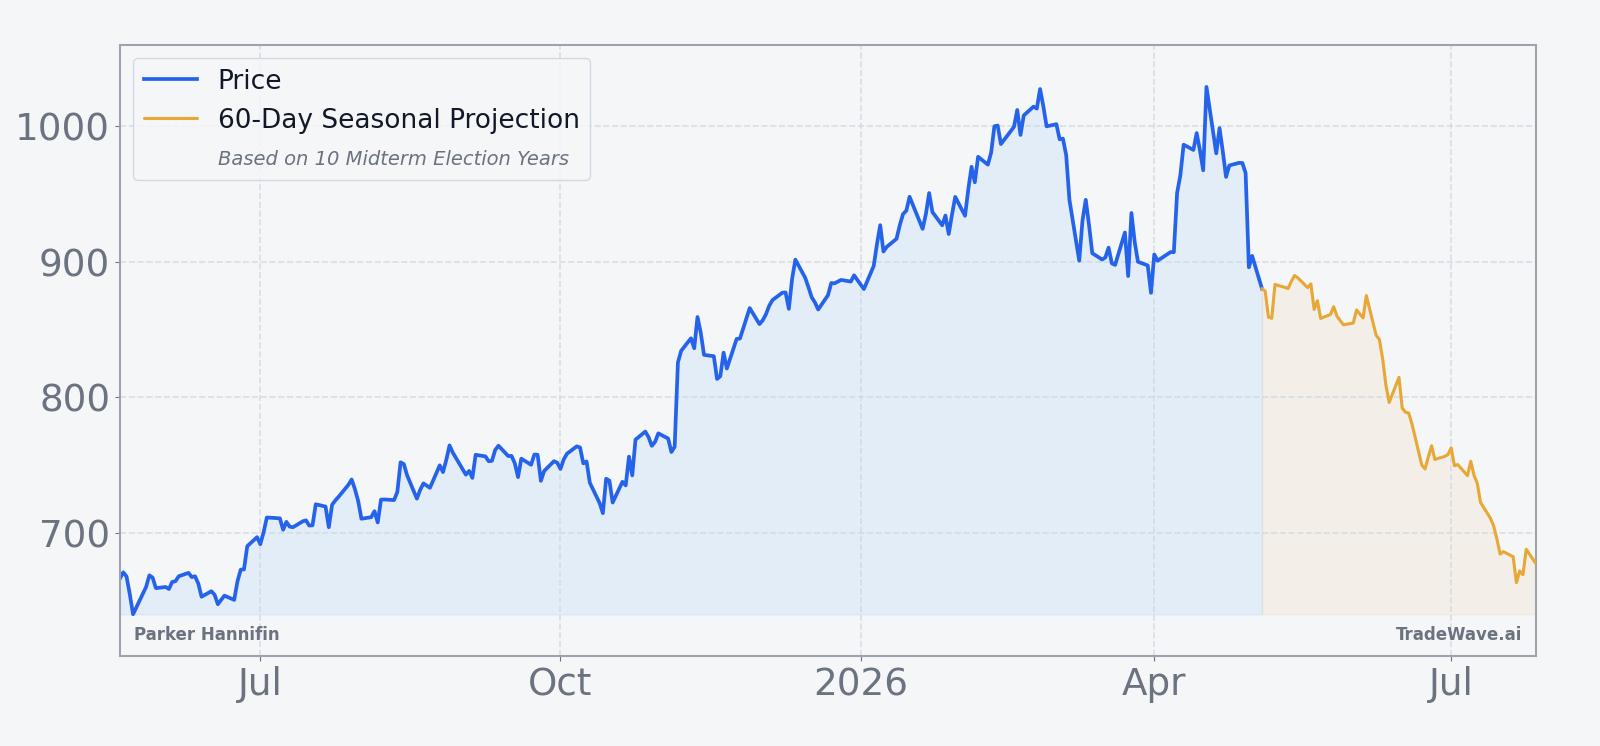
Parker Hannifin shares last traded at 878.51, down 0.04% on the day, after swinging between an intraday low of 862.69 and a high of 880.25 on volume of about 320,000 shares.[1] The stock sits roughly 15.1% below its 52-week high of 1,034.96 and well above its 52-week low near 597.18, after slipping 4.86% over the past month even as its 50-day moving average around 944.80 remains higher than the current quote, a sign that momentum has cooled following a powerful multi-quarter run.[1]
The chart below situates the latest move in its recent multi-month context and overlays the upcoming 60-day seasonal projection.
From a macro and policy standpoint, the midterm election year often brings a more complicated backdrop for industrials. Investors weigh the trajectory of infrastructure programs, defense appropriations and regulatory shifts that can affect order books for motion and control systems, filtration and aerospace components. In that environment, a stock like Parker Hannifin, which has already priced in strong earnings power, can be more sensitive to any hint of slowing capital expenditure or margin pressure, especially as the calendar approaches a window that has historically seen the stock give back ground.
Looking ahead, the key tension is between Parker Hannifin’s elevated absolute level and the historical seasonality that has favored shorts in this midterm-year slice. If the stock holds firm or breaks to new highs through the 57-day window starting May 17, it would mark the first clear violation of a 10-for-10 pattern. If instead the shares resume their recent pullback and trade lower into early summer, the move would be consistent with the long-running PH seasonal trend that has tended to pressure the stock between mid-May and mid-July in midterm election years.
Sources
About this seasonal analysis
Seasonal pattern data is sourced from TradeWave.ai, which analyzes historical price behavior across annual calendar windows going back up to 30 years. Read the full data methodology or the book The 100-Year Pattern by Afshin Moshrefi (2026 edition). Past performance of seasonal patterns does not guarantee future results. This article is for informational purposes only and does not constitute investment advice.