Ford Motor Company (F) Has Rallied in 7 of 8 Midterm May Windows Starting May 20
Ford Motor Company is sprinting toward a 52-week high just as a historically bullish 12-day midterm-year seasonal window approaches, adding another layer of volatility to an AI-and-energy-fueled surge.

What is the seasonal pattern for Ford Motor Company (F)?
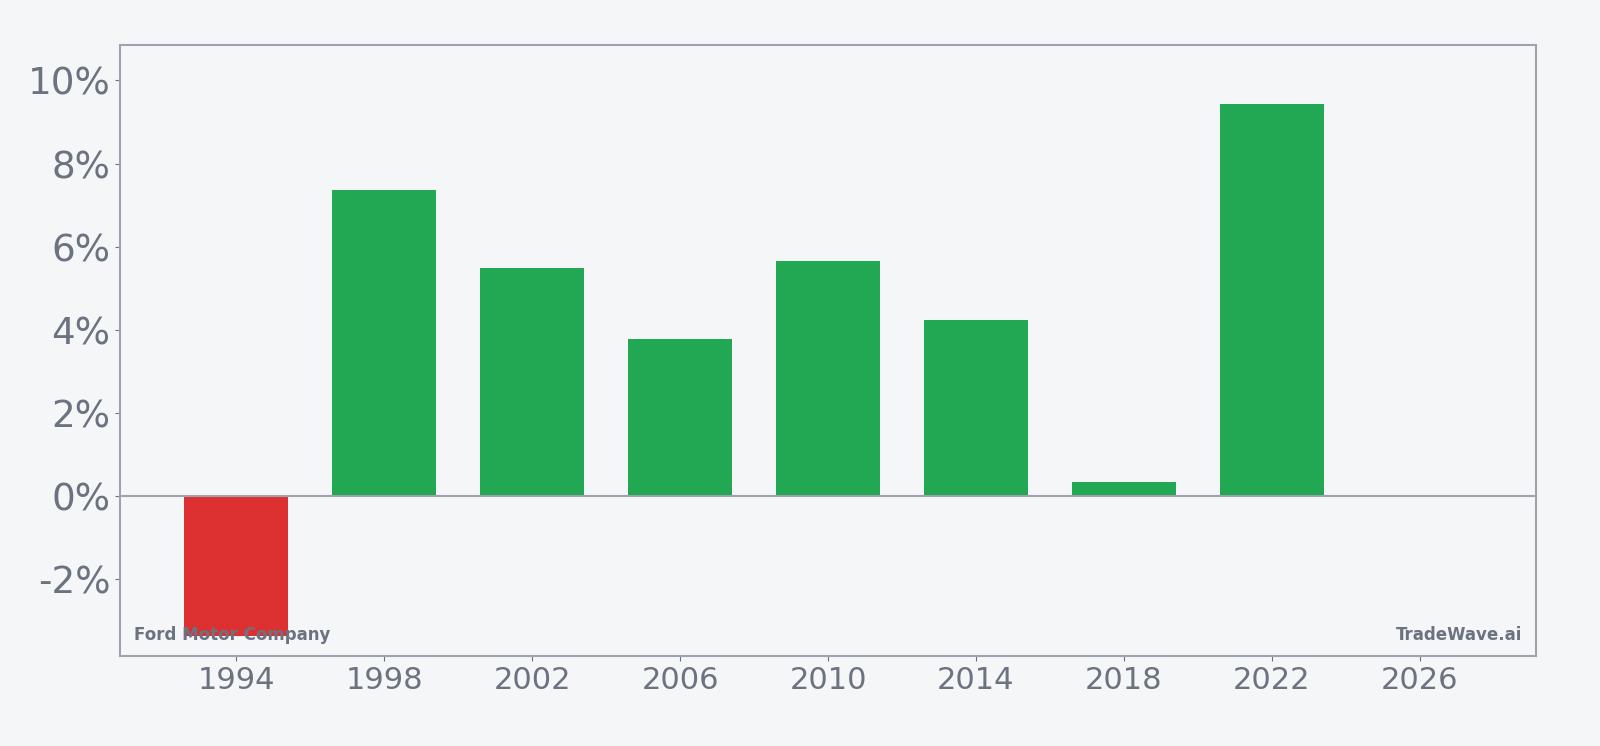
Ford Motor Company has risen in 7 of 8 midterm-election-year windows starting May 20, with an average gain of 5.19% in winning years.
- 7 wins and 1 loss in this 12-day window across the last 8 midterm election years, with winners averaging 5.19% gains.
- Percent Profitable stands at 88%, with 7 winners and 1 loser in the historical sample.
- Including every year, Avg Profit - All is 4%, showing the lone losing year has not erased the upside bias.
- The strongest year in this window delivered a 9.44% net gain, while the weakest saw a 3.35% loss.
- TradeWave Ratio of 1.64 suggests price has typically traveled meaningfully in the long direction within the window.
- Sharpe ratio of 0.99 points to a historically favorable risk-adjusted profile for this specific Ford Motor Company trading window.
According to historical data from TradeWave.ai, this mid-May stretch has behaved very differently from an average month for Ford Motor Company in past midterm election years.
How has Ford Motor Company (F) traded in this midterm-year May window?
Ford Motor Company has risen in 7 of the last 8 midterm-election-year windows that begin on May 20 and run for 12 trading days, averaging 5.19% gains in the winning years. Shares finished Thursday at $14.47, up 6.6% on the day and about 3.1% below their 52-week high of $14.94, after a two-day surge tied to AI and energy buzz.[5][10] That combination of a strong historical seasonal trend and a stock pressing against its recent ceiling gives this upcoming window more weight than a typical calendar quirk.
Because this pattern is grouped by the presidential election cycle, it only looks at the last eight midterm election years, not eight consecutive calendar years. That matters for an automaker like Ford, where tariffs, regulation and industrial policy often move in multi-year waves that line up with Washington’s policy calendar rather than the simple January-to-December clock.[3]
The trade direction for this Ford Motor Company trading window is long, and the historical record has been decisively skewed to the upside. Percent Profitable is 88%, with 7 winners and just 1 loser, and the all-years average outcome of 4% suggests that even after accounting for the down year, the typical result has been a gain rather than a flat drift. The median profit of 4.88% sits close to the average winner, which points to a fairly consistent payoff profile rather than one or two outlier years doing all the work.
Looking at individual years, the weakest outcome came in 1994, when the stock lost 3.35% in the window, while the strongest was 2022, with a 9.44% gain. In several of the better years, such as 2010 and 2022, the maximum favorable move inside the window ran into double digits, even when the final close-to-close gain was smaller, which is where the TradeWave Ratio of 1.64 comes from. That metric captures how far price has typically traveled in the trade direction during the window, independent of where it finished.
The per-year maximum favorable excursion and maximum adverse excursion show that upside has usually dominated, but not without some turbulence. In 2010, for example, Ford’s best intraperiod run-up reached 11.85%, while the worst drawdown from entry during the same window was 5.83% in the opposite direction. Other years, such as 1998 and 2002, saw more modest adverse moves paired with solid positive closes, suggesting that while the window has often rewarded patience, it has not been a straight line.
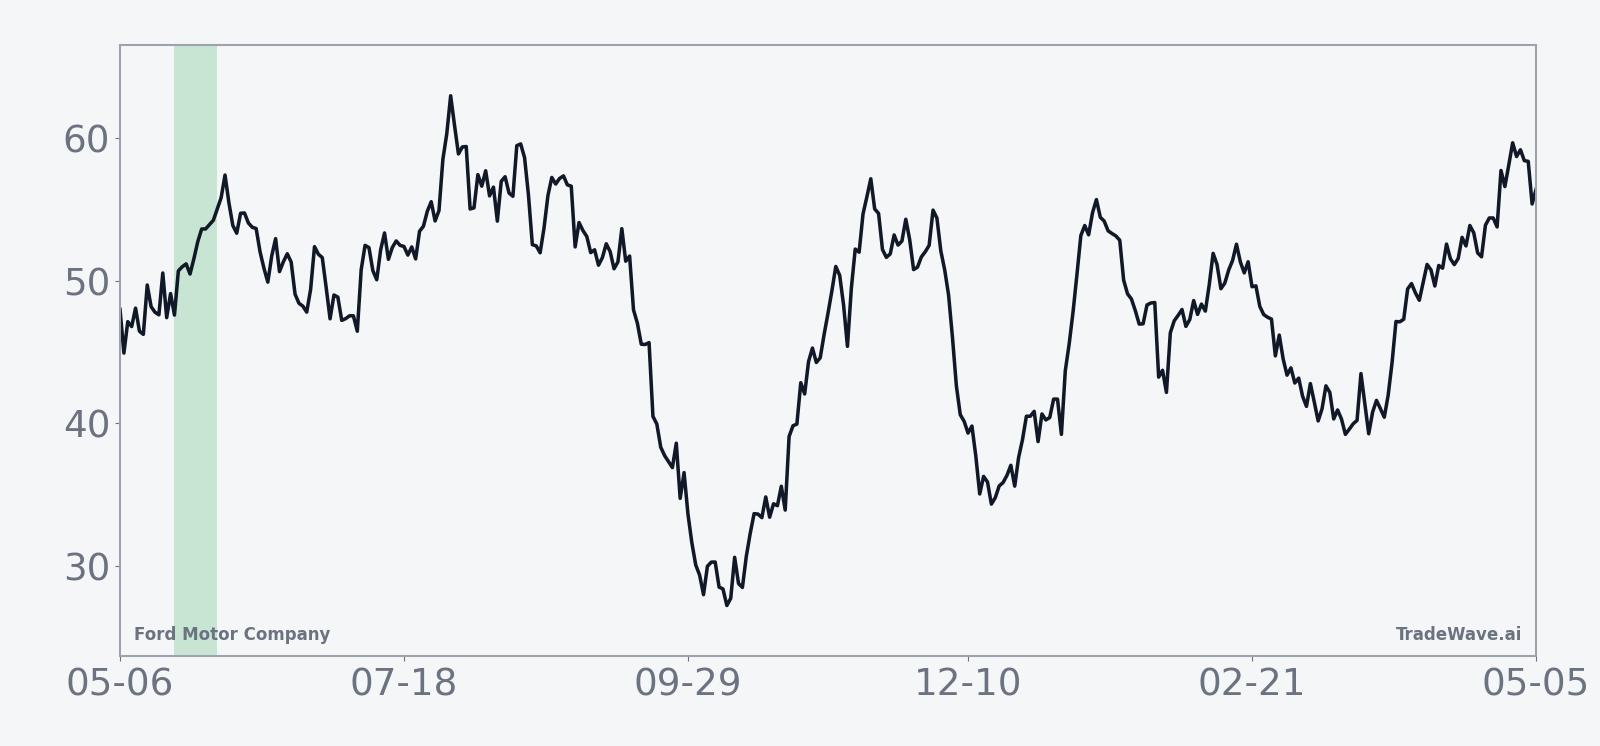
The historical seasonal trend chart for this mid-May stretch tilts higher across most of the 12 days, with gains tending to build rather than spike on a single session. That pattern is echoed in the cumulative return profile, which climbs steadily across the window instead of whipping back and forth, hinting at a bias where rallies often extend over several days once they start.
Yearly net and peak moves highlight how often upside has persisted even when intraperiod drawdowns appeared.
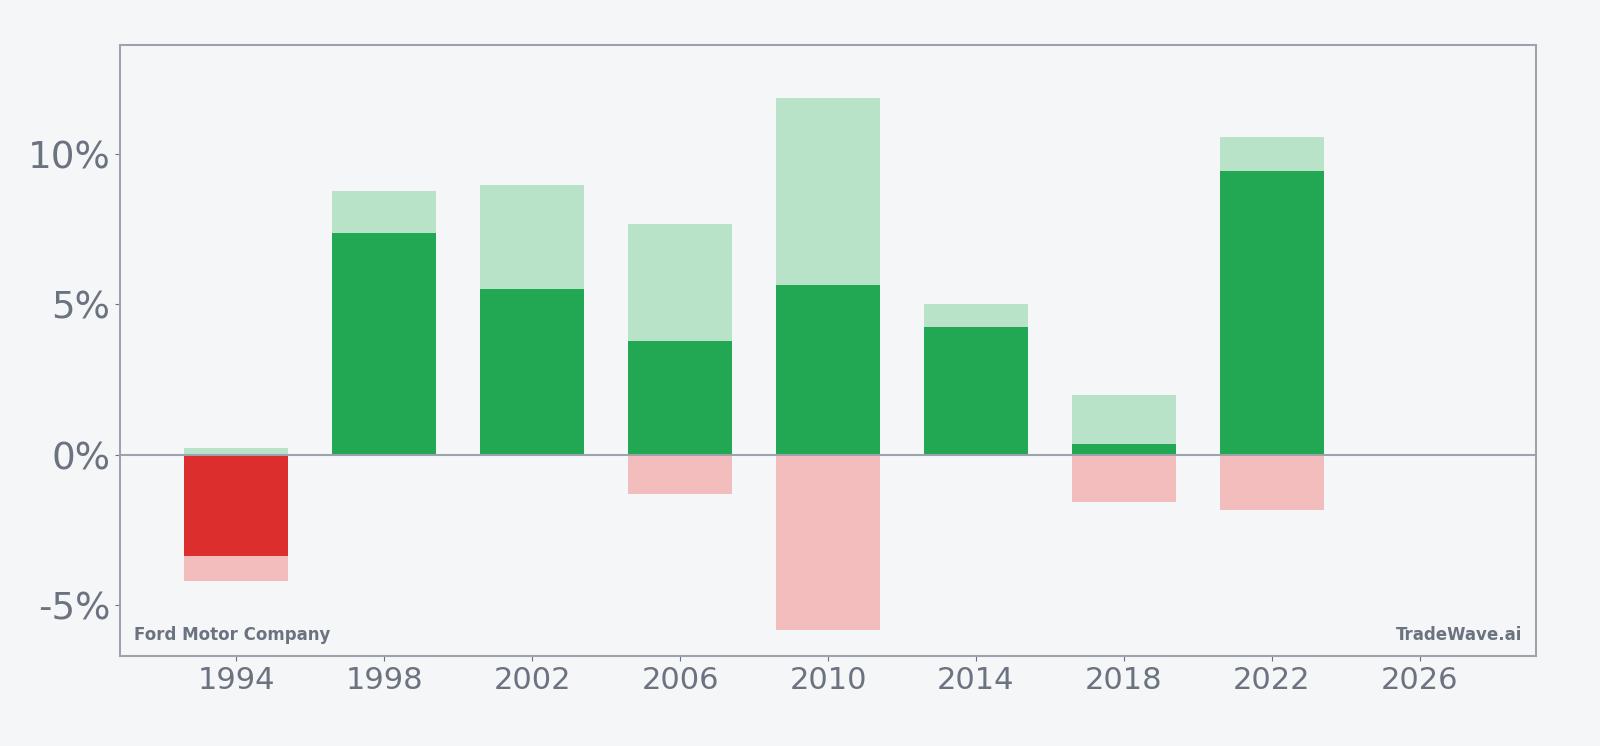
Viewed together, the net-return bars and the maximum favorable and adverse excursions show a window that has usually rewarded long exposure but has occasionally tested conviction. Large positive maximum favorable moves paired with contained maximum adverse moves in years like 1998 and 2014 point to clean upside runs, while 2010 and 2022 show that even strong windows can include sharp intraperiod dips before finishing higher. Add it up: 7 wins out of 8, a 4% all-years average gain and a near-1.0 Sharpe ratio make this one of Ford’s more reliable midterm-year seasonal stretches.
Why does Ford Motor Company (F) follow this seasonal pattern?
One likely driver is the way midterm election years concentrate policy headlines around tariffs, industrial subsidies and labor, all of which matter directly to a legacy automaker’s margins and capital plans.[3] Analysts have also pointed to institutional portfolio repositioning in late spring, as funds adjust exposure to cyclical names like autos ahead of the summer and the next leg of the policy calendar. This pattern may also reflect how Ford’s earnings and guidance cadence interacts with those macro themes, with investors using this window to lean into or fade the latest narrative around EV strategy and manufacturing footprint.
History does not guarantee future results; adverse excursions (MAE) can be large even in winning windows.
What is driving Ford Motor Company (F) today?
Ford shares have exploded higher this week, closing at $14.47 on Thursday after a 6.6% jump that left the stock about 3.1% below its 52-week high of $14.94 and up 16.4% over the past month.[5][10] The move has been fueled by a burst of enthusiasm around Ford’s energy storage partnership with China’s CATL and a narrative that the stock is morphing into an AI-adjacent “meme” play, even as the company continues to navigate tariffs, EV restructuring and a heavy capital spending plan.[3][5][10]
In late April, CNBC highlighted Wall Street’s focus on how tariffs, the conflict in Iran and supplier issues could filter into Ford’s Q1 2026 earnings and full-year guidance, with the company targeting adjusted EBIT of $8 billion to $10 billion and adjusted free cash flow of $5 billion to $6 billion for 2026.[3] At the same time, Ford still trails General Motors on profitability and stock performance, a gap that has kept the consensus analyst rating anchored at Hold and the long-running debate alive over whether Ford’s EV and energy strategy can close the margin gap.[1][6]
Thursday’s surge followed fresh analyst commentary that framed Ford’s CATL-backed energy storage business as a potential competitive advantage in the U.S. market, just as investors are hunting for new ways to play the intersection of autos, batteries and AI-related infrastructure.[5][10] The stock’s two-day, roughly 20% run has also likely pulled in short-term traders and options activity, amplifying volume and intraday swings as Ford trades more like a high-beta tech name than a traditional industrial.[10]
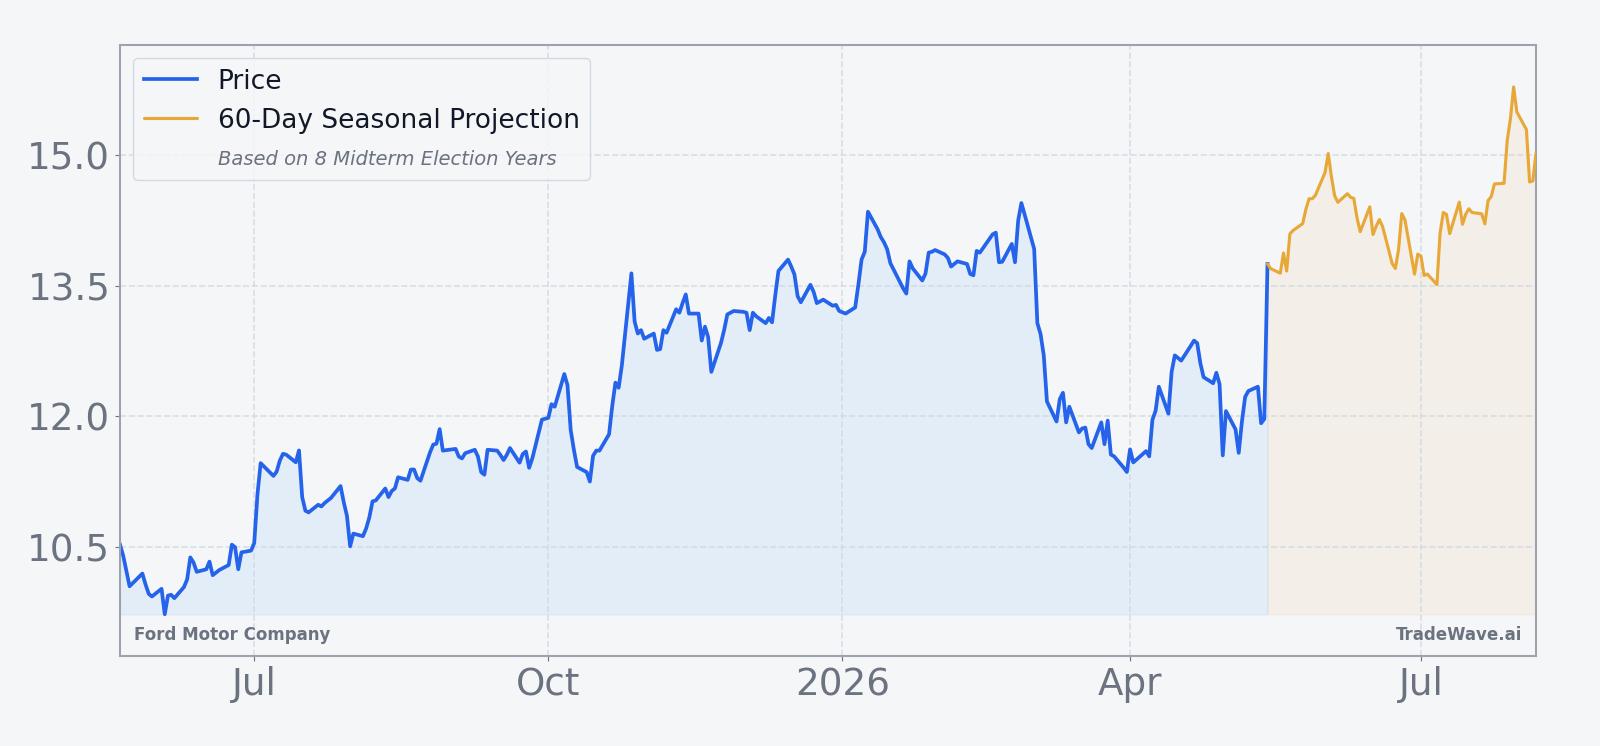
The chart below situates the latest move in its recent multi-month context and overlays the upcoming seasonal projection.
What should traders watch as this Ford Motor Company seasonal window opens?
First, the calendar: the 12-day midterm-year window begins on May 20, so traders will be watching whether Ford can hold above the low-to-mid teens as that period kicks in or whether profit-taking knocks it back from the $14.94 52-week high area.[5][10] A pattern-consistent move would see the stock grind higher or at least stay resilient through the window, even if intraday swings remain large.
Second, the policy and macro backdrop will matter, especially around tariffs and industrial policy that directly affect Ford’s manufacturing footprint and EV economics.[3] Any new headlines on trade, subsidies or auto regulation during this midterm election year could either reinforce or undercut the historical seasonal tailwind.
Third, traders will be tracking whether the recent volume and momentum tied to the AI-and-energy narrative persists or fades. If the stock continues to attract heavy interest and elevated turnover as the window opens, that would echo prior strong years where upside maximum favorable moves built quickly; if enthusiasm cools and volume normalizes, the seasonal pattern may have less fuel to work with.[5][10]
Finally, behavior inside the window itself will be a tell. A rally that extends the recent breakout while keeping intraperiod drawdowns contained would line up with the historical 7-for-8 record, while a sharp reversal or unusually deep adverse move would mark a clear break from the typical F seasonal trend in midterm election years.
Sources
- [1] GuruFocus, “Ford (F) Faces Pressure for Domestic Manufacturing Shift,” Jun 2, 2025.
- [2] CNBC, “Ford Motor is set to report earnings after the bell,” Oct 23, 2025.
- [3] CNBC, “Ford Motor is set to report earnings after the bell,” Apr 29, 2026.
- [4] CNBC, “Ford Motor is set to report results after the bell,” Feb 10, 2026.
- [5] Yahoo Finance, “Ford shares jump 6% as Morgan Stanley hails CATL-backed energy business,” May 13, 2026.
- [6] CNBC, “GM's ability to balance profits, politics under Trump is paying off for investors,” Jan 29, 2026.
- [10] CNBC, “Ford surges 20% in two days. It might be an AI 'meme' stock after energy pivot,” May 14, 2026.
About this seasonal analysis
Seasonal pattern data is sourced from TradeWave.ai, which analyzes historical price behavior across annual calendar windows going back up to 30 years. Read the full data methodology or the book The 100-Year Pattern by Afshin Moshrefi (2026 edition). Past performance of seasonal patterns does not guarantee future results. This article is for informational purposes only and does not constitute investment advice.