9 of 10 Midterm June Windows Have Seen Advanced Micro Devices (AMD) Drop for Shorts
Advanced Micro Devices is rallying on AI strength, but an early-summer midterm-year seasonal window has usually seen the stock drift lower.
What is the seasonal pattern for Advanced Micro Devices (AMD)?
Advanced Micro Devices has fallen in 9 of the last 10 midterm-year windows starting around Jun 12, with an average 7.33% gain in winning years for the short side.
- 9 for 10 in this window for short trades, with winning years averaging 7.33% moves in the trade direction.
- The 21-day Advanced Micro Devices trading window begins Jun 12 in midterm election years and has historically favored downside drift.
- Percent Profitable is 90%, with 9 winners and 1 loser across the last 10 midterm-year samples.
- Avg Profit - All, which includes the lone losing year, still comes in at 6%, pointing to a persistent AMD seasonal trend.
- The TradeWave Ratio of 2.32 signals that price has typically traveled meaningfully in the short direction inside the window.
- Intraperiod swings have been wide in some years, with sizable adverse excursions even when the short pattern ultimately worked.
According to historical data from TradeWave.ai, this early-summer stretch in midterm election years has behaved very differently from a typical month for AMD, and the next iteration is less than a month away.
How has Advanced Micro Devices (AMD) traded in this midterm-year June window?
Advanced Micro Devices has moved lower in 9 of the last 10 midterm election years during the 21-day window that starts around Jun 12, with short trades averaging 7.33% gains in winning years. Today the stock closed at $449.70, up 0.9% on the session and about 4.2% below its 52-week high of $469.22.[13] Options traders recently priced in nearly a 9% move around AMD’s Q1 earnings, underscoring how volatile this name can be when catalysts line up.[6]
Because this pattern is grouped by the presidential election cycle, it only looks at midterm election years, a phase that often brings policy uncertainty, regulatory noise and choppy risk appetite. For a megacap semiconductor stock tied to AI and data center spending, that backdrop can translate into sharp position resets as funds rebalance exposure between midterm-year volatility and the historically stronger pre-election year that follows.
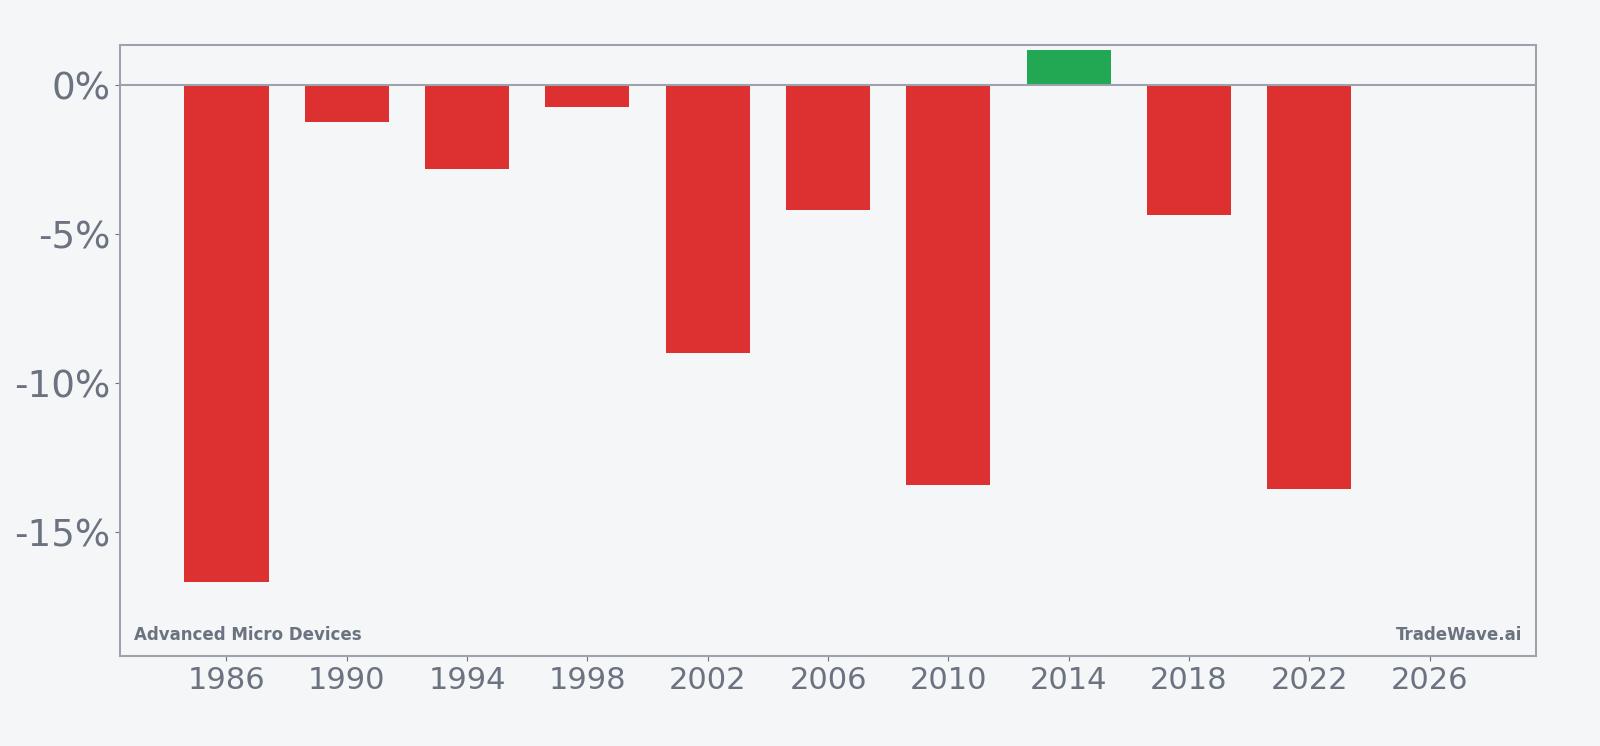
Historically, this seasonal window begins on Jun 12 and runs for 21 trading days, and it has been a weak stretch for AMD when viewed through a short lens. Percent Profitable sits at 90%, with 9 winning short years and just 1 losing year, so the pattern has been both directional and consistent. The average gain for winning shorts is 7.33%, while including the lone losing year pulls the all-years average to 6%, which is still sizable for a three-week window.
The per-year table shows how that plays out in practice. The strongest year for the short side was 1986, when AMD dropped 16.67% during the window, with a worst intraperiod drawdown of 19.79% from the entry before stabilizing. The weakest year for shorts was 2014, when the stock actually rose 1.17% over the window, illustrating that even in this historically bearish slice, squeezes can and do occur.
The historical seasonal average trend for this window slopes lower rather than crashing, which fits a pattern of steady downside drift rather than a single shock. In many years, AMD has tended to soften early in the window, see a brief countertrend bounce, then resume grinding lower into the back half of the period.
The combined net, best-case and worst-case bars highlight how far AMD has typically moved inside this window, both in and against the short direction.
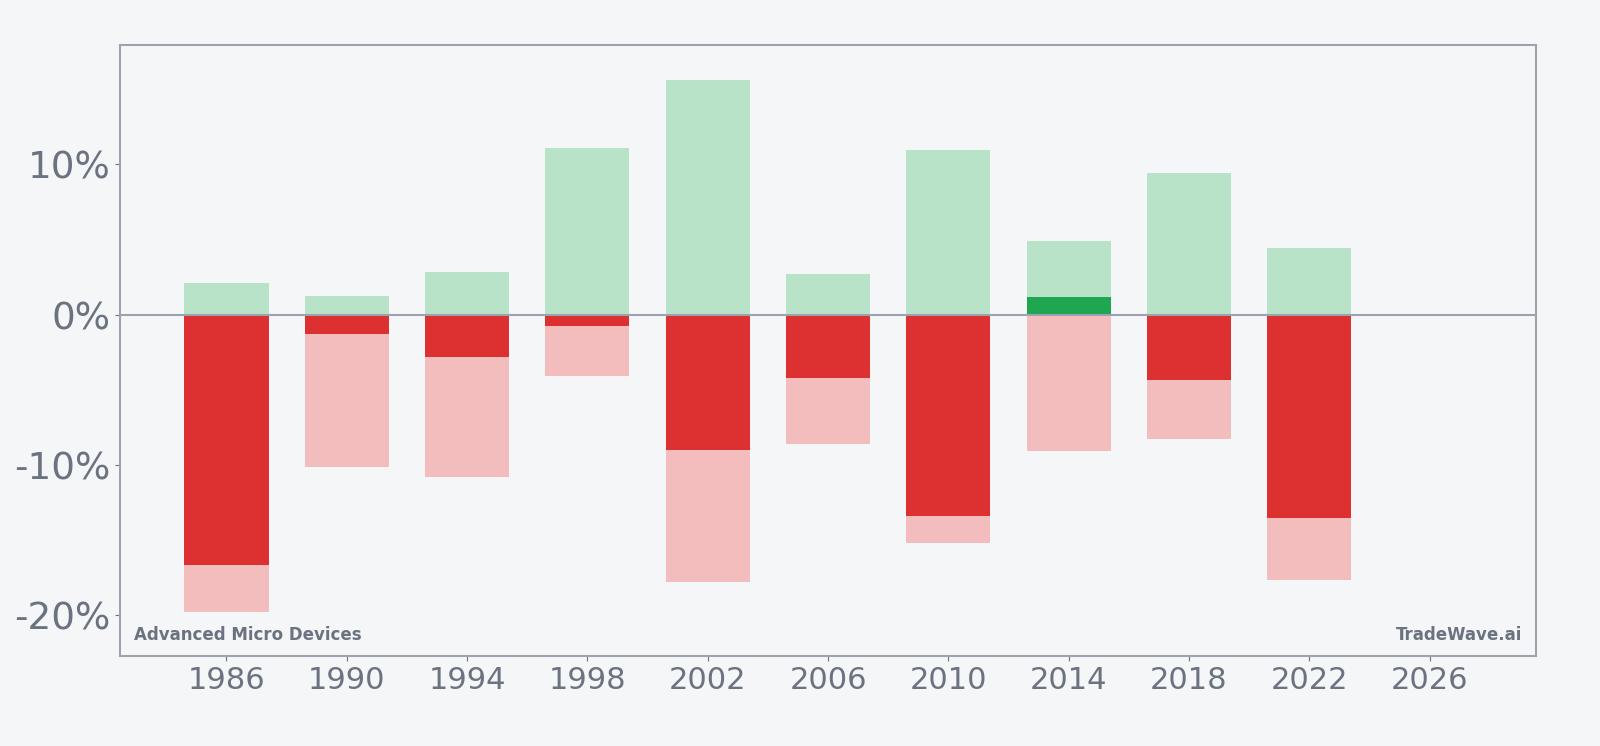
The stacked net/MFE/MAE bars show that in several years, such as 2002 and 2022, the maximum favorable move for shorts exceeded 15%, but the worst intraperiod drawdowns also ran into the mid-teens. That mix of large favorable and large adverse excursions points to a high-variance AMD seasonal pattern where the stock can swing hard in both directions before settling lower by the end of the window.
Put together, the message is simple: nine for ten. In midterm election years, this specific June window has usually rewarded patience on the short side, even if the path has been bumpy.
Why does Advanced Micro Devices (AMD) follow this seasonal pattern?
This midterm-year June pattern may reflect a cluster of factors: portfolio managers trimming high-beta tech into summer, midyear index rebalances, and a lull between major product and earnings catalysts. Analysts have also pointed to the way policy debates in midterm years can hit risk appetite for growth stocks just as liquidity thins into vacation season.[1] For a name as sentiment-driven as AMD, those forces can turn small disappointments into outsized three-week swings.
History does not guarantee future results; adverse excursions can be large even in winning windows, and AMD’s intraperiod drawdowns have at times exceeded its final net move.
What is driving Advanced Micro Devices (AMD) today?
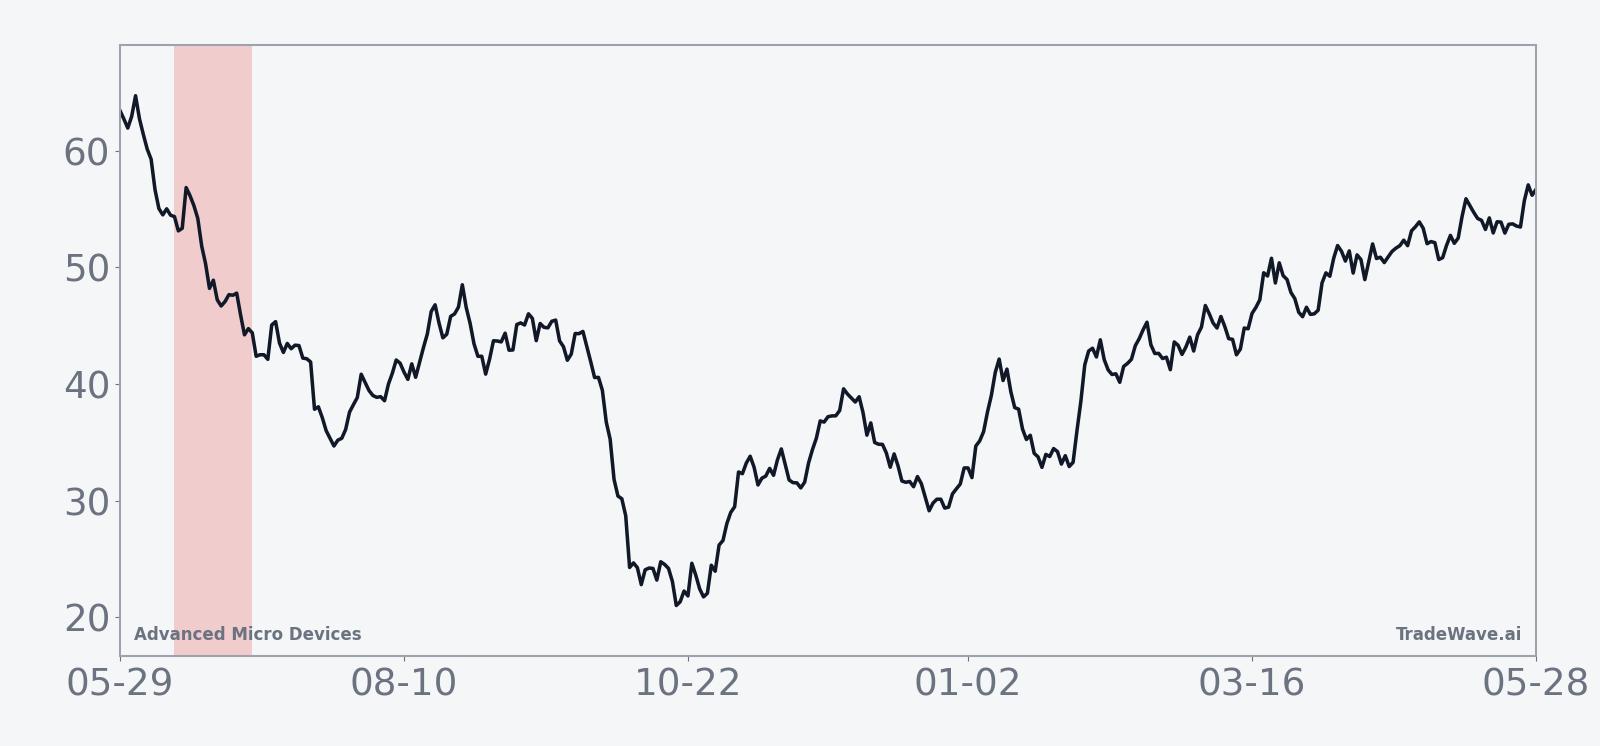
AMD closed Friday at $449.70, up 0.9% on the day, after a powerful run that has left the stock about 61.6% higher over the past month and roughly 4.2% below its 52-week high of $469.22.[13] The latest leg of the rally followed Q1 2026 results in early May, when AMD reported revenue of $10.25 billion, up 38% year over year, and net income that nearly doubled to $1.38 billion on surging demand for AI infrastructure and data center chips.[13] Into that print, options traders were pricing nearly a 9% post-earnings move, a sign of how aggressively the market was bracing for volatility around AMD’s AI narrative.[6]
In May 2026, AMD’s profit surge reinforced a broader macro theme: AI and data center spending remain one of the few clear growth engines in a market still digesting higher rates and uneven global demand.[13] The company has been gaining CPU share and pushing deeper into the GPU market, positioning itself as a key challenger in high-performance computing and AI accelerators.[2] That backdrop has helped pull in momentum money, but it also raises the stakes for any hint of slowing orders or competitive pressure as the year progresses.
The chart below situates the latest move against AMD’s past year of trading and a 60-day seasonal projection.
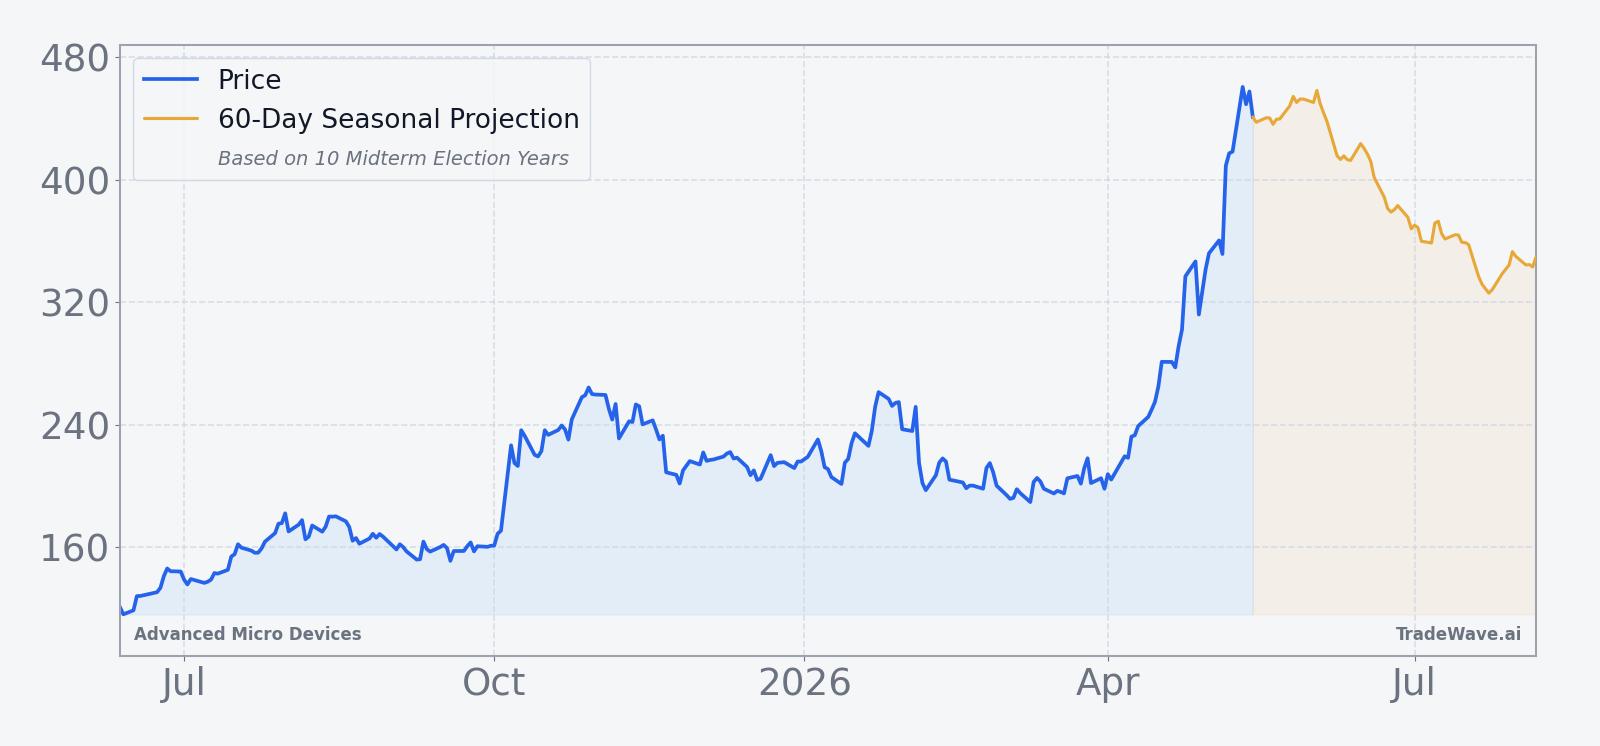
AMD’s current rally also sits awkwardly against the upcoming seasonal window. The stock is in a powerful uptrend, trading far above its 50-day moving average of $274.72 and supported by heavy volume that has recently run above its 20-day average of about 44.98 million shares.[13] Even so, the historical midterm-year June pattern has repeatedly flagged a pocket of downside risk, and when AMD has rolled over in this stretch, the swings have sometimes spilled into broader semiconductor benchmarks.
What should traders watch as this AMD seasonal window approaches?
First, the calendar: the 21-day midterm-year window begins on Jun 12, so any shift from relentless dip-buying to more two-way trade in late May or early June would be an early sign that the historical pattern might be asserting itself. Price-wise, the 52-week high near $469 is the obvious line in the sand; how AMD behaves if it retests or breaks that level into the window will tell traders whether this cycle is tracking closer to the strong short years or the rare outlier like 2014.[13]
Second, watch the AI and data center narrative for any signs of fatigue. The last earnings report showed explosive growth, but midterm years often bring policy and macro headlines that can cool risk appetite even when fundamentals stay solid.[13] A softer tone from large cloud customers, a delay in product ramps, or a shift in guidance later this year could all interact with the historical seasonality to amplify downside moves.
Third, keep an eye on options and volume. Into Q1, options markets were pricing a nearly 9% swing around earnings, and realized volatility has not been shy about delivering that kind of move.[6] If implied volatility and speculative call activity stay elevated as Jun 12 approaches, another crowded positioning setup could make any pullback inside the window sharper than the historical averages suggest.
Finally, the tell for this AMD seasonal trend will be how the stock trades inside the window itself. A pattern of lower highs, heavy intraday reversals from strength, and expanding downside volume would line up with the historical short-friendly record. A clean breakout through the 52-week high that holds into late June would instead argue that this midterm-year cycle is breaking the mold, at least for now.
Sources
- [1] Barchart.com, "Can AMD Stock Hit $210 In 2025?", Jul 31, 2025.
- [2] Yahoo Finance, "AMD Reports August 5—Analyst Sees Q3 Upside and CPU Market Gains", Jul 31, 2025.
- [3] The Motley Fool, "AMD Stock Slips Despite 30% Earnings Growth", Nov 5, 2025.
- [4] Seeking Alpha, "AMD stock rating split", Oct 7, 2025.
- [6] Seeking Alpha, "AMD options traders price ~9% post-earnings move", May 5, 2026.
- [13] Yahoo Finance, "AMD Jumps on AI Surge, Profit Nearly Doubles", May 7, 2026.
- [14] Yahoo Finance, "AMD Shares Rally on GPU Snapback Outlook", Jun 16, 2025.
About this seasonal analysis
Seasonal pattern data is sourced from TradeWave.ai, which analyzes historical price behavior across annual calendar windows going back up to 30 years. Read the full data methodology or the book The 100-Year Pattern by Afshin Moshrefi (2026 edition). Past performance of seasonal patterns does not guarantee future results. This article is for informational purposes only and does not constitute investment advice.