Best Buy (BBY) Faces Inflation Squeeze as 8-Day Late-May Weak Stretch Nears
Best Buy is trading just off its 52-week low as it approaches a late-May seasonal window that has historically favored short sellers and added volatility for the stock.

What is the seasonal pattern for Best Buy (BBY)?
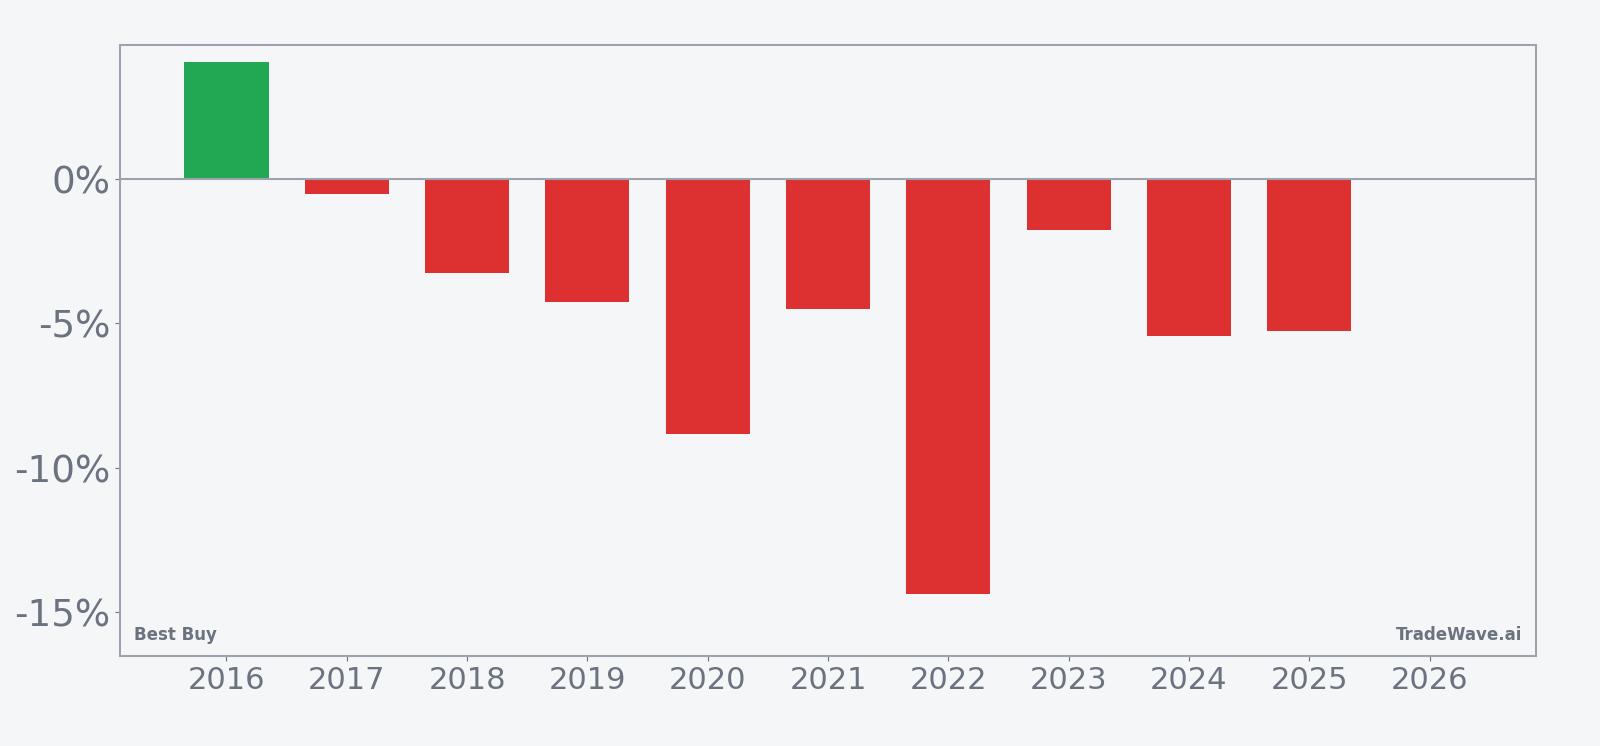
Best Buy has fallen in 9 of 10 years during this late-May 8-day window, with an average gain of 5.36% in winning short years.
- 9 for 10 in this window, with winning short years averaging 5.36% moves in the trade direction.
- The late-May 8-day window starting May 16 has historically been a bearish seasonal stretch for Best Buy.
- Percent Profitable is 90%, with 9 winners and 1 loser for the short-side pattern over the past decade.
- Average profit across all years is 4%, showing that the lone losing year has not erased the typical downside bias.
- Intraperiod swings have been meaningful, with both strong maximum favorable moves and sizable adverse drawdowns inside the window.
- For traders, this BBY seasonal trend has combined a high hit rate with enough volatility to reward precise timing on entries and exits.
According to historical data from TradeWave.ai, this upcoming late-May stretch has behaved very differently from an average week on the Best Buy calendar, and the next iteration is only days away.
How has Best Buy (BBY) traded in this late-May seasonal window?
Best Buy has delivered profitable short-side trades in 9 of the past 10 years during the 8-day window that begins on May 16, with winning years averaging a 5.36% move in the trade direction. The stock last closed at 55.29, down 3.3% on the day and sitting about 33.2% below its 52-week high of 82.79 while hovering just above its 52-week low of 55.10.[7] That combination of a high historical hit rate and current price pressure makes this specific slice of the calendar unusually important for traders watching the BBY seasonal trend.
Trade direction for this pattern is explicitly short, so negative net returns in the window have historically been “wins” for the setup. Across the 10-year lookback, Percent Profitable sits at 90%, with 9 winning short years and just 1 losing year, and the all-years average outcome is a 4% move in favor of the short side. The average winning year has delivered a 5.36% gain for shorts, while the single losing year saw the stock rise enough to offset part of that edge.
The per-year breakdown shows how consistent that bias has been. In 2022, for example, Best Buy dropped 14.37% across the window, with a worst intraperiod drawdown from entry of 18.52% and a best point-to-peak move of 2.42% in the trade direction. In 2020, the stock fell 8.82% over the same stretch, with the worst adverse move inside the window reaching 13.01% before the trade finished in the short seller’s favor.
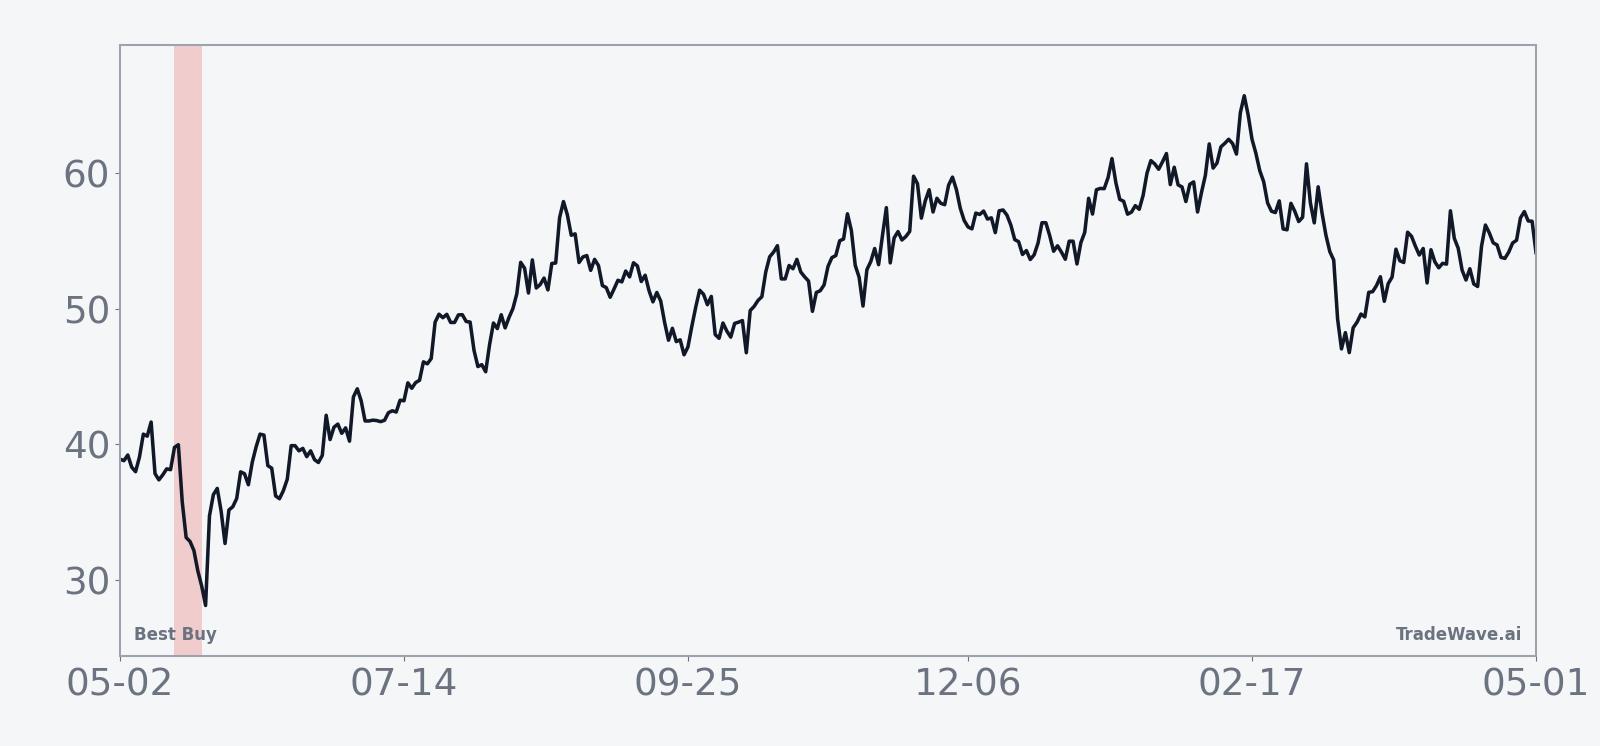
The historical seasonal average suggests that most of the move for this Best Buy trading window tends to accrue steadily rather than in a single gap. The typical path shows pressure building early in the window, with the cumulative return line grinding lower rather than snapping sharply on one day. For traders, that pattern analysis hints that intraday rallies inside the window have often been sold rather than marking durable reversals.
A closer look at yearly net returns alongside peak favorable and adverse moves shows how much room the stock has given both shorts and longs inside this window.
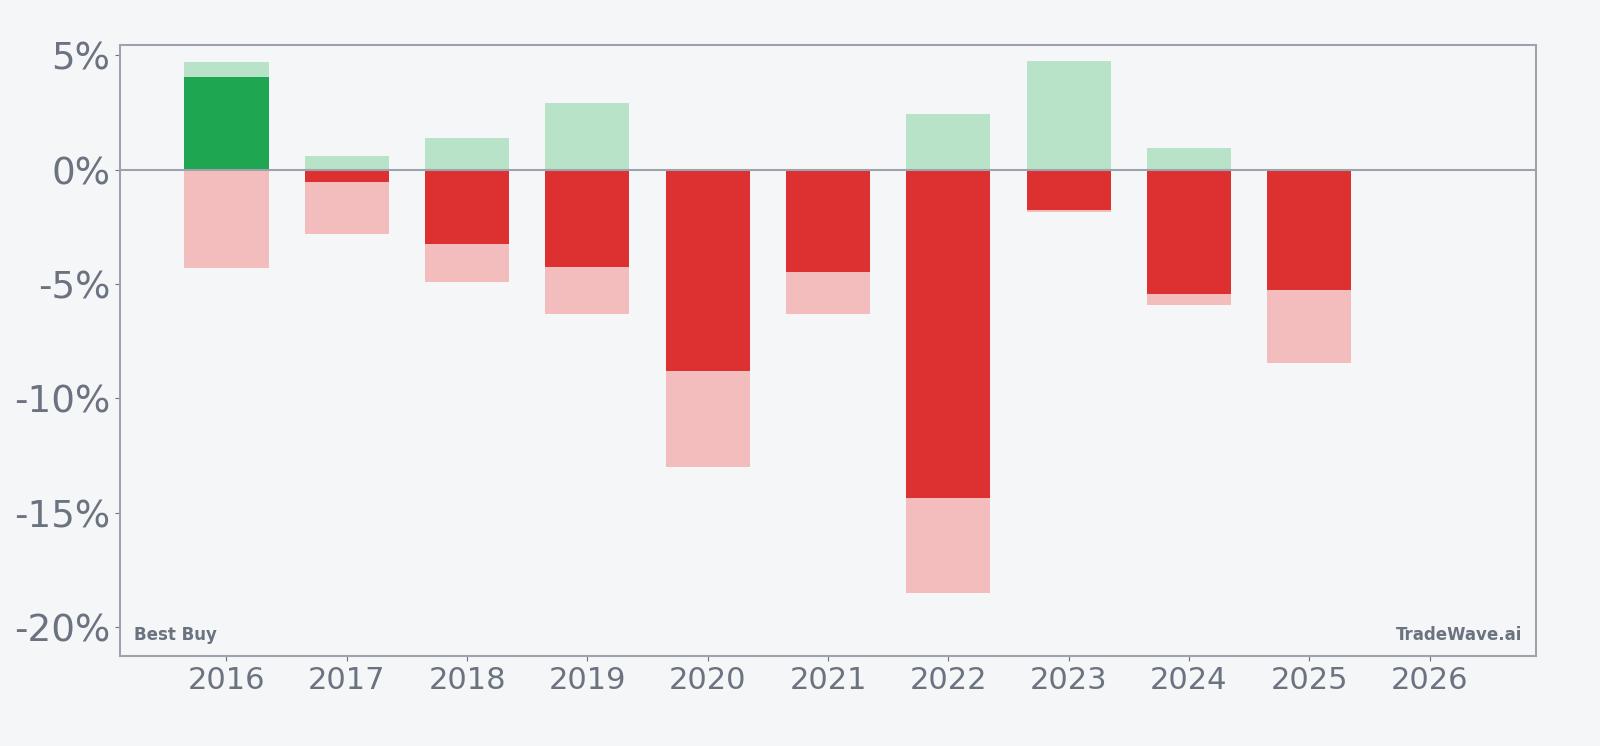
The stacked net, MFE and MAE bars underline that this has been a high-conviction but not low-risk pattern. In strong years for the short setup, maximum favorable excursions have pushed well beyond the final net return, showing that price often traveled further in the trade direction intraperiod than the closing result alone implies. At the same time, adverse excursions have at times been deep, with several years showing MAE readings of 5% to nearly 19%, which means shorts have had to tolerate meaningful rallies against them before the window closed in their favor.
History does not guarantee future results; adverse excursions (MAE) can be large even in winning windows.
Why does Best Buy (BBY) follow this seasonal pattern?
This late-May pattern may reflect how investors position around Best Buy’s first-quarter earnings and updated guidance, which often fall near the same part of the calendar.[1] Analysts have also pointed to broader retail sector seasonality, where electronics demand can soften between the post-holiday upgrade cycle and back-to-school spending, leaving discretionary names more vulnerable to negative revisions.[3] Layer in macro worries about inflation and tariffs that periodically flare around this time of year, and the result has been a window where cautious sentiment has repeatedly lined up with selling pressure in the stock.[5]
What is driving Best Buy (BBY) today?
Best Buy shares last changed hands at 55.29, down 3.3% on the session, extending a one-month slide of 12.42% and leaving the stock about 33.2% below its 52-week high while trading just above its 52-week low of 55.10.[7] The move keeps BBY below its 50-day moving average of 62.36 and comes as traders look ahead to the company’s next scheduled earnings update for its fiscal 2026 first quarter, where earlier expectations called for modest earnings pressure and flat sales.[1] In May 2025, analysts were looking for $1.09 in EPS on $8.82 billion in revenue for the comparable quarter, a setup that framed Best Buy as a mature retailer wrestling with sluggish top-line growth and margin pressure from inflation and tariffs rather than a high-growth story.[1][3]
Through late 2025, commentary around the stock focused on how elevated inflation and higher household expenses were forcing consumers to delay or downsize big-ticket electronics purchases, a headwind that weighed on Best Buy’s revenue trajectory and share price.[3][5] At the same time, the company showed it could still surprise to the upside when product cycles and promotions lined up, as seen in November 2025 when Best Buy reported better-than-expected third-quarter results and raised its full-year outlook on the back of stronger computing, gaming and mobile demand.[2][6] Technical analysts in October 2025 also highlighted improving momentum and potential for gains as the stock attempted to break through resistance at key moving averages, underscoring how quickly sentiment around BBY can swing when the tape turns.[8]
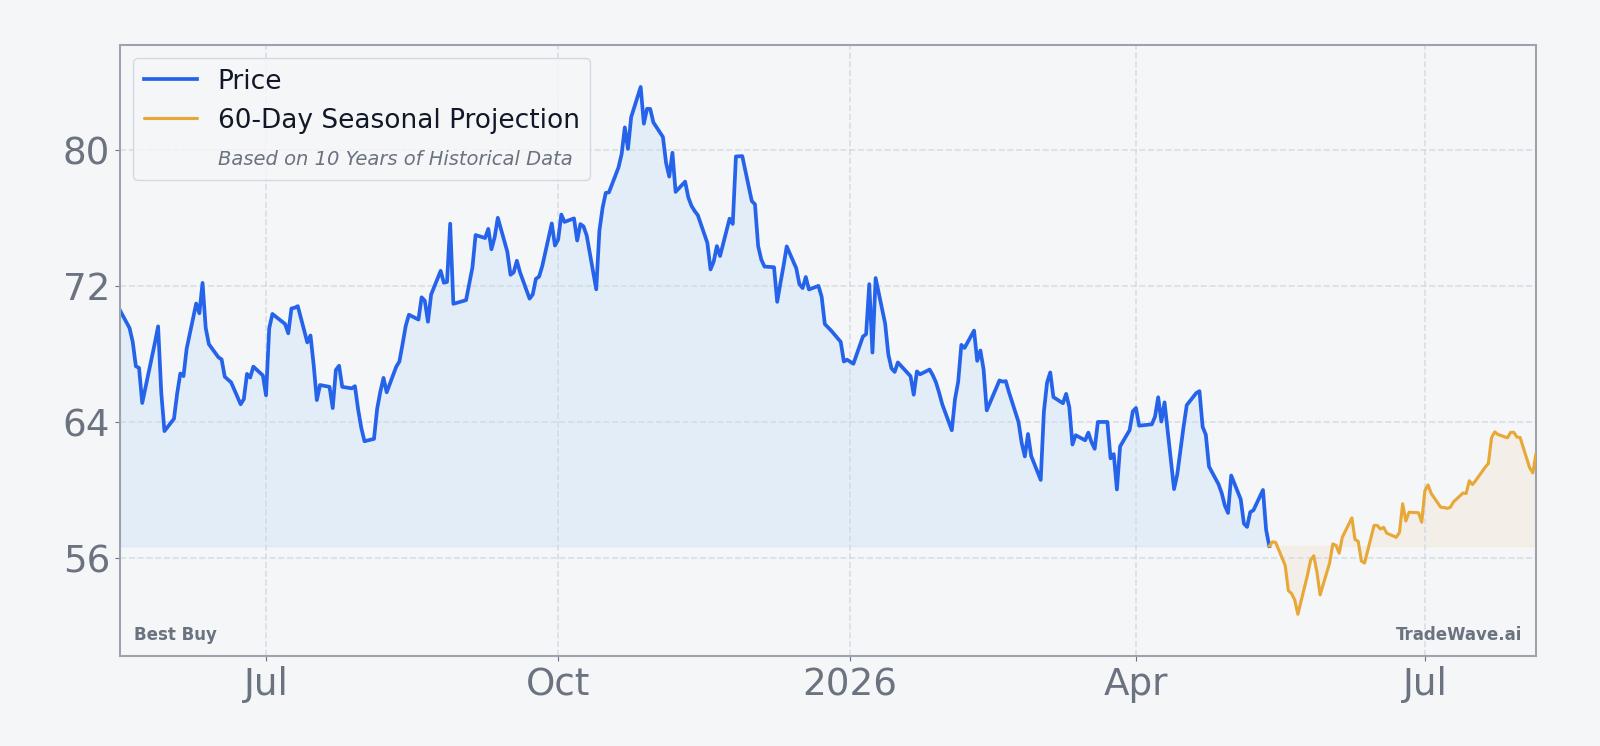
The chart below situates the latest move in its recent multi-month context and overlays a short-term seasonal projection.
How do earnings and guidance shape the Best Buy (BBY) outlook?
In November 2025, Best Buy’s third-quarter fiscal 2026 report showed adjusted EPS of $1.40 versus $1.31 expected and revenue of $9.67 billion versus $9.59 billion, with comparable sales up 2.7% year over year.[2] On the same day, management raised its full-year outlook, guiding for fiscal 2026 revenue of $41.65 billion to $41.95 billion and adjusted EPS of $6.25 to $6.35, alongside comparable sales growth of 0.5% to 1.2%.[6] That guidance framed Best Buy as a steady, cash-generative retailer rather than a growth engine, but it also signaled that the company believed it could navigate tariff and inflation pressures better than some feared.
Earlier in the fiscal year, commentary around the first-quarter setup emphasized that analysts were bracing for a roughly 4% year-on-year earnings decline on flat revenue, reflecting softer demand for big-ticket electronics and a more cautious consumer.[1] Subsequent analysis through late 2025 argued that Best Buy’s growth profile remained challenged, with questions around where the next leg of demand would come from after the pandemic-era upgrade cycle and amid intensifying online competition.[3][4] For traders watching the upcoming seasonal window, that backdrop matters because historically, negative revisions or conservative commentary around this part of the calendar have often coincided with the short-favorable pattern in the stock.
What macro and sector forces are shaping Best Buy (BBY)?
Macro conditions have been a persistent headwind for Best Buy, particularly elevated inflation that has squeezed household budgets and forced consumers to prioritize essentials over discretionary electronics purchases.[3] Analysis in late 2025 highlighted how even modest declines in consumer spending on big-ticket items could translate into weaker revenue growth for BBY, especially when layered on top of already-slowing demand after the pandemic upgrade boom.[5] Tariffs on imported electronics and components have also pressured margins, raising the risk that Best Buy either absorbs higher costs or passes them on to shoppers at the expense of volume.[3][6]
Within the broader retail sector, Best Buy faces the same structural challenges that have dogged brick-and-mortar chains for years: intense online competition, promotional pressure and the need to keep investing in omnichannel capabilities.[3] When macro conditions soften, those pressures tend to intensify, as retailers fight harder for a smaller pool of discretionary dollars. For a stock already trading near its 52-week low and below its 50-day moving average, that backdrop can amplify the impact of any negative surprise that lands during a historically weak seasonal stretch.[7]
How are analysts and technicals framing Best Buy (BBY) here?
Analyst coverage compiled by LSEG and cited by CNBC has characterized Best Buy as a Hold, reflecting a market view that the stock is fairly valued relative to its current growth and margin profile.[2][4] While specific consensus price targets are not available in the latest dataset, prior commentary from major outlets through 2025 framed BBY as a name where upside depended on either a stronger product cycle, such as a new console launch, or a clearer inflection in consumer electronics demand.[4] On the technical side, the stock’s slide below its 50-day moving average and proximity to its 52-week low suggest that momentum has turned against bulls in the near term, even as some chart-based analysis last year flagged the potential for rebounds when sentiment became too negative.[7][8]
What should traders watch in this Best Buy (BBY) seasonal window?
For the upcoming late-May window, the first watchpoint is how BBY behaves as it enters the 8-day stretch that has historically favored shorts in 9 of 10 years. If the stock continues to trade heavy near or below its 50-day moving average and fails to hold bounces, that would be consistent with the historical pattern of downside pressure building through the window.[7] A second focus is the company’s earnings commentary and any updates to fiscal 2026 guidance, since prior cycles have shown that cautious language on consumer demand, tariffs or margins around this time of year can align with the seasonal weakness.[1][3][6]
Traders should also keep an eye on key price levels: the recent 52-week low near 55.10 as immediate support, and the 50-day moving average around 62.36 as a gauge of whether any rally has real traction.[7] A decisive break below the low during the window would fit the historical short-favorable script, while a sustained move back above the 50-day would contradict it and signal that buyers are willing to lean into the stock despite the seasonal backdrop. Finally, given the pattern’s history of sizable intraperiod swings, monitoring intraday volatility and how quickly rallies are sold or bought back can offer clues about whether this iteration of the Best Buy trading window is tracking the past or writing a different script.
Sources
- Forbes: Will Earnings Results Move The Needle For Best Buy? (May 28, 2025)
- CNBC: Best Buy hikes sales forecast as shoppers upgrade tech (Nov 25, 2025)
- Forbes: Best Buy Stock: Where's The Growth? (Oct 21, 2025)
- Forbes: Will Switch 2 Sales Lift Best Buy Stock Out Of Turbulence? (Jun 16, 2025)
- Forbes: Best Buy Stock Is Sliding: Will You Still Hold It? (Dec 30, 2025)
- The Wall Street Journal: Best Buy Raises Outlook As Consumers Shrug Off Tariff Costs (Nov 25, 2025)
- CNBC: Stocks making the biggest moves premarket: Target, Best Buy, MongoDB, Credo Technology & more (Mar 3, 2026)
- CNBC: Best Buy is set for strong gains as momentum improves, according to the charts (Oct 2, 2025)
About this seasonal analysis
Seasonal pattern data is sourced from TradeWave.ai, which analyzes historical price behavior across annual calendar windows going back up to 30 years. Read the full data methodology or the book The 100-Year Pattern by Afshin Moshrefi (2026 edition). Past performance of seasonal patterns does not guarantee future results. This article is for informational purposes only and does not constitute investment advice.