7-for-7: Tractor Supply (TSCO) Has Rallied Every Midterm Window, Averaging 17.45% Gains
Tractor Supply is sliding toward its 52-week low just weeks before a historically strong midterm-year seasonal window that has never produced a losing stretch in this pattern.

What is the seasonal pattern for Tractor Supply (TSCO)?
Tractor Supply has risen in 7 of 7 midterm-election-year windows starting around Jun 13 and lasting 159 days, with an average gain of 17.45% in winning years.
- 7 for 7 in this window, with winning years averaging 17.45% gains across the 159-day stretch.
- The upcoming window begins Jun 13, 2026 and runs for roughly five months, covering the heart of the midterm election year.
- Percent Profitable is 100%, with 7 winners and 0 losers across the last seven midterm-election-year cycles.
- Average gains cluster between about 6% and 30%, with a cumulative return of 203% across all seven windows.
- Intraperiod swings have been meaningful, with some years seeing adverse moves worse than 20% before finishing higher.
- The TradeWave Ratio of 2.74 and Sharpe ratio of 1.94 point to a historically strong long-side seasonal trend for TSCO in this specific election-cycle window.
According to historical data from TradeWave.ai, this midterm-year stretch for Tractor Supply has behaved very differently from an average calendar period. The next section looks at how that election-cycle pattern has played out in prior years and what it implies for the upcoming 159-day window.
How has Tractor Supply (TSCO) traded in past midterm-year seasonal windows?
Tractor Supply has risen in all seven midterm-election-year windows that start around Jun 13 and run for 159 days, averaging 17.45% gains across those winning stretches. Today the stock closed at 29.76, down 2.7% on the session and sitting just above its 52-week low of 29.42 and far below the 52-week high of about 62.96, a slide of roughly 52.7% from peak to trough.[1]
Grouping the data by the presidential election cycle matters here because this window sits in the midterm election year, a phase that often brings policy uncertainty, shifting rate expectations and sector rotation across U.S. equities. For a domestically focused retailer like Tractor Supply, that mix has historically lined up with a favorable stretch as investors reposition into more defensive, cash-generative names during the middle of the cycle.
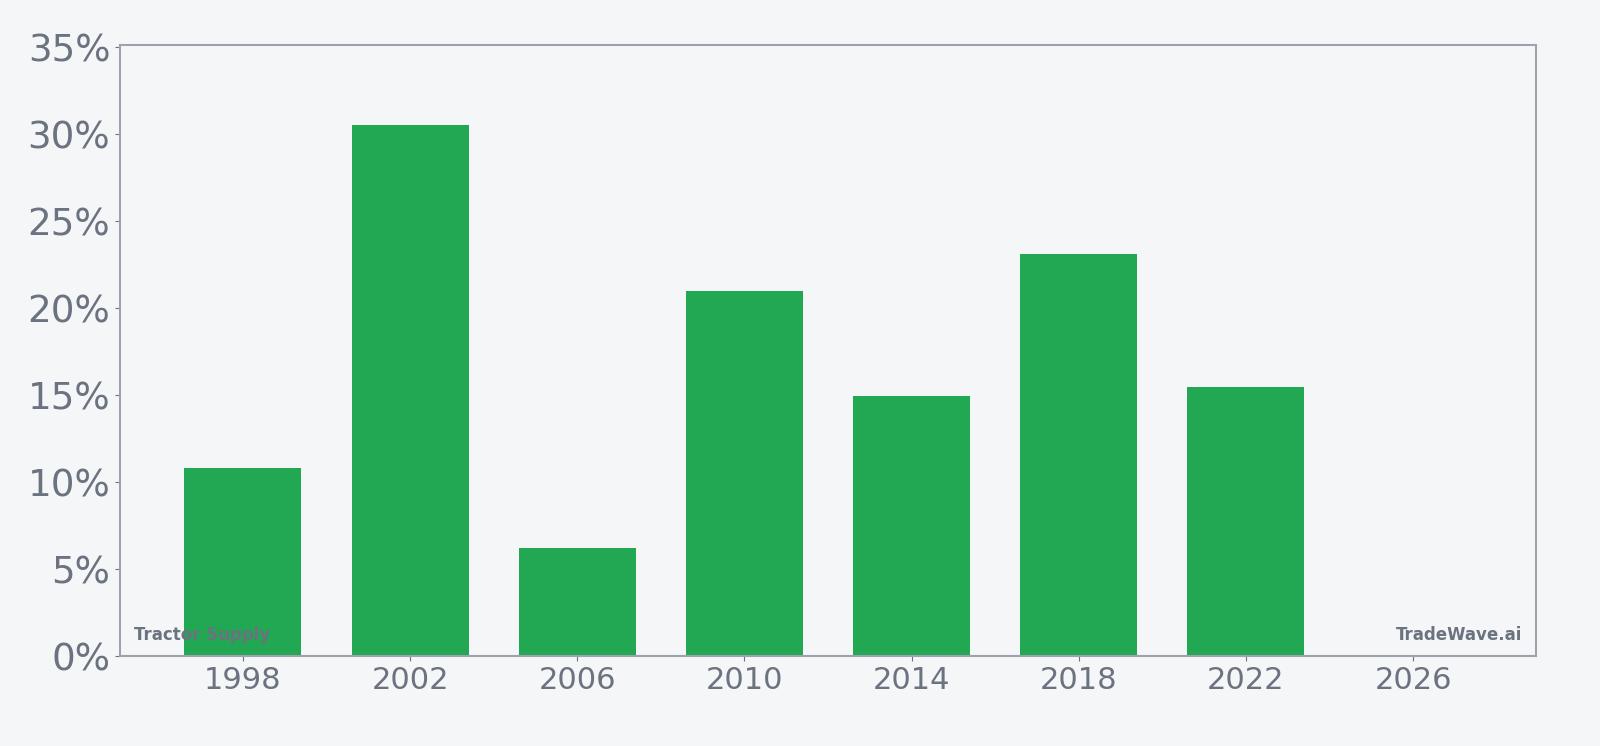
Across the seven midterm-election-year samples, the average outcome for this 159-day Tractor Supply trading window is a 17.45% gain, with a median profit of 15.5%. The weakest year in the sample, 2006, still finished up 6.25%, while the strongest, 2002, delivered a 30.54% net return over the window. Add it up and the cumulative gain across all seven windows is 203%, a sizable contribution for a single recurring slice of the calendar.
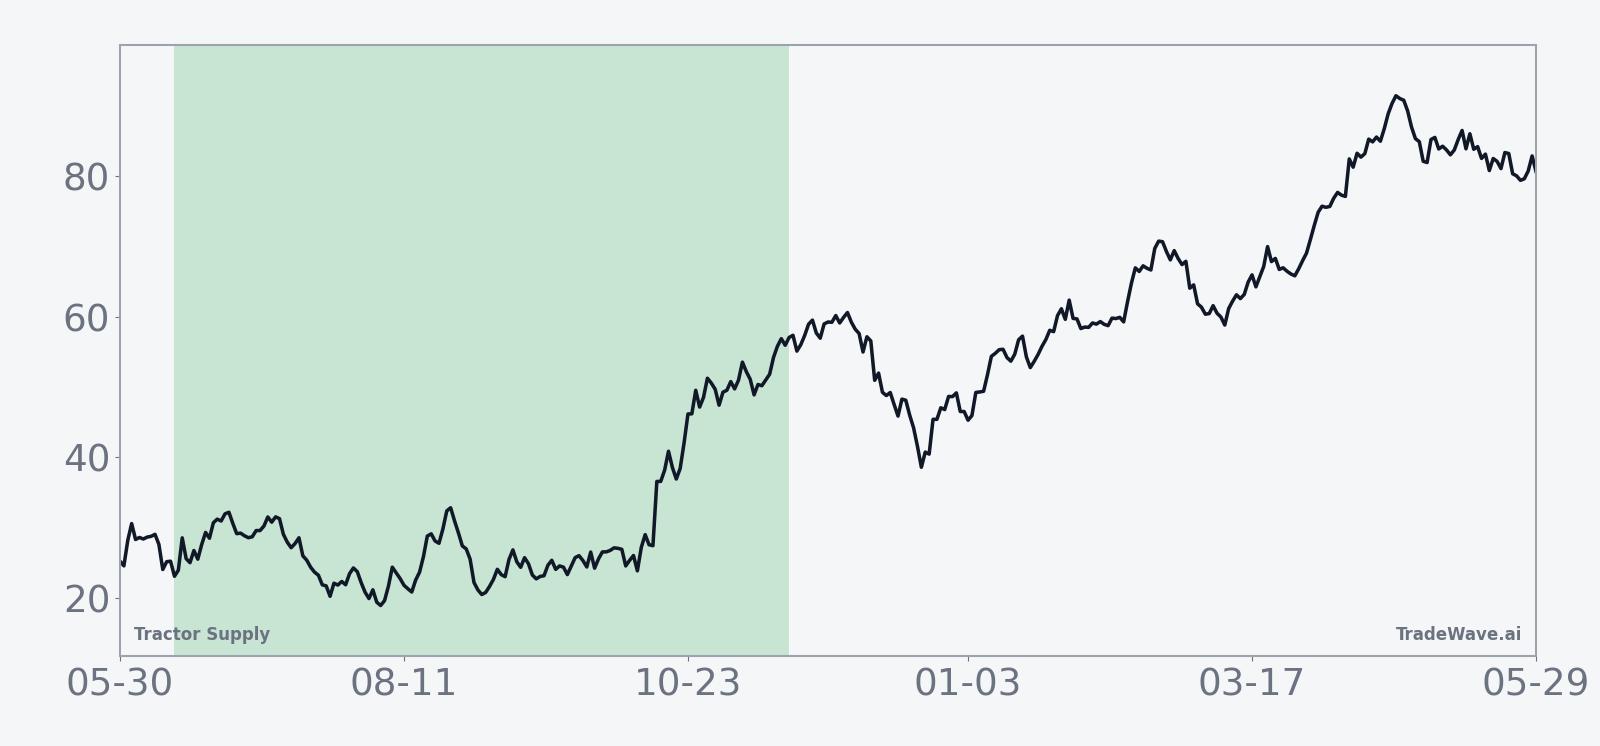
The historical seasonal average trend for this window slopes steadily higher rather than spiking in a single burst. That suggests gains have tended to accrue over the full five-month stretch, with some years front-loading strength and others building later, but without a consistent pattern of early collapse or late-stage blow-off.
The combined net, best-case and worst-case moves by year show how upside and downside have coexisted inside this bullish seasonal trend.
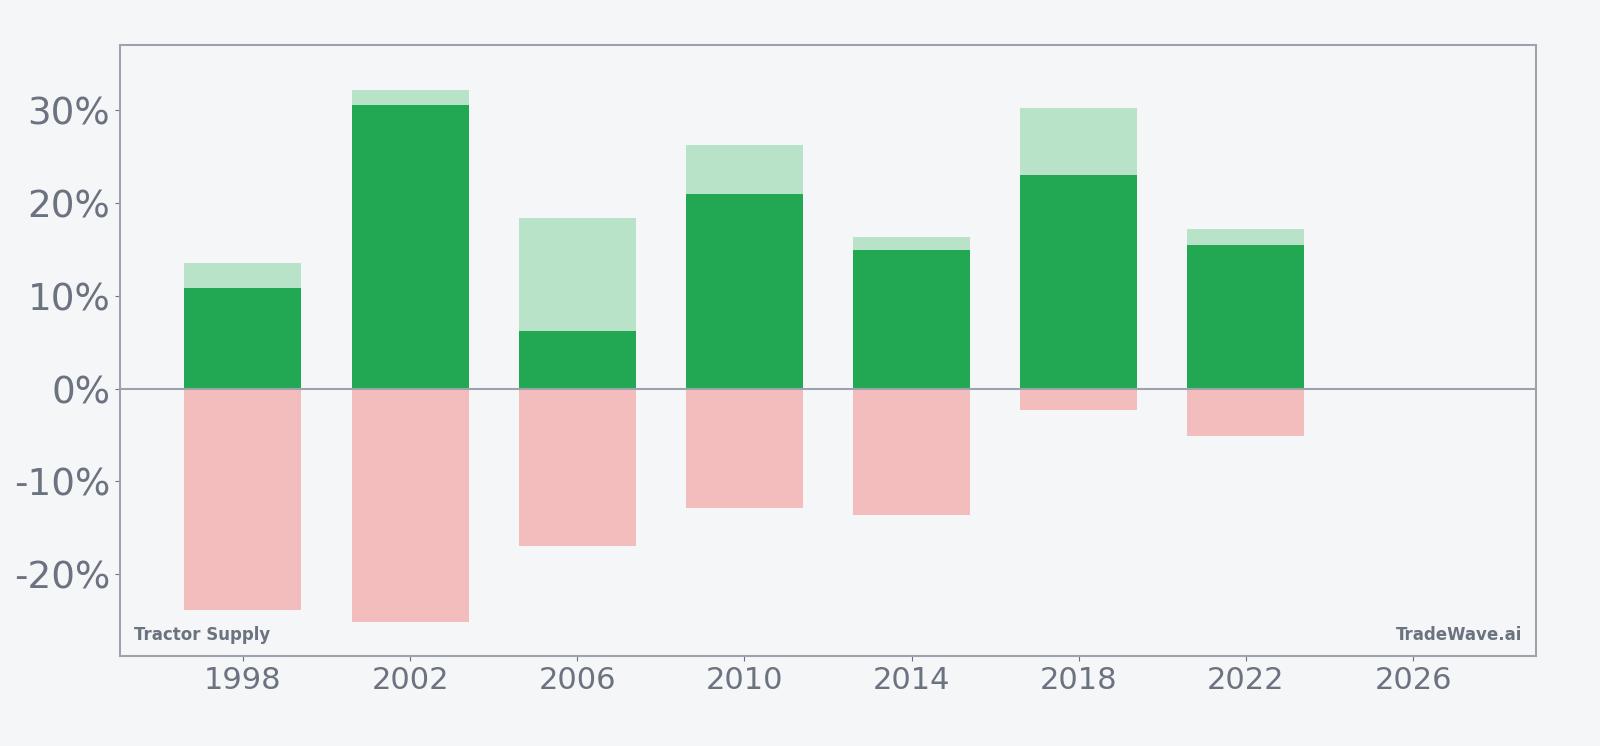
Intraperiod swings have been meaningful even in winning years. In 1998, for example, Tractor Supply finished the window up 10.84% but at one point was down 23.92% from the entry before recovering, while the best run-up reached 13.59%. In 2002, the stock posted a 30.54% net gain with a 32.25% maximum favorable move, yet still saw a 25.14% worst drawdown during the same stretch. More recent cycles have looked smoother: 2018 delivered a 23.08% gain with only a 2.34% worst drawdown, and 2022 finished up 15.5% after a relatively contained 5.11% adverse move.
The pattern is clear: this midterm-year window has favored long positions in Tractor Supply in every sample so far, but the path has not always been comfortable, especially in earlier cycles.
Why does Tractor Supply (TSCO) follow this seasonal pattern?
One likely driver is the way Tractor Supply’s core business lines up with midyear spending in rural and exurban markets, where summer and early fall are peak seasons for outdoor projects, livestock and pet care. Analysts have also pointed to institutional portfolio repositioning in midterm election years, when investors often lean into steady, domestically focused retailers as policy debates heat up. This pattern may also reflect how Tractor Supply’s earnings calendar and guidance updates cluster around this stretch, giving the stock multiple catalysts inside a historically supportive seasonal window.
History does not guarantee future results, and even in a 100% winning window, adverse moves within the period have at times exceeded 20% before the stock recovered.
What is driving Tractor Supply (TSCO) today?
Tractor Supply shares fell 2.7% on May 14 to 29.76, extending a steep one-month slide of 33.3% that has dragged the stock to within pennies of its 52-week low at 29.42 and far below its 50-day moving average of 42.24.[1] Trading volume of about 7.8 million shares was below the recent 20-day average of roughly 13.9 million, suggesting the latest leg lower is more of a grinding selloff than a capitulation flush.[1]
There is little in the way of fresh company-specific news to explain the timing of the move. In Aug 2025, Tractor Supply outlined plans to expand last-mile delivery for bulky goods to rural customers, targeting digital sales of 10% to 12% of revenue by 2029 from about 8% at the time, a strategy aimed at deepening its moat in hard-to-serve markets.[1] The stock’s current slide instead looks more tied to broader pressure on consumer and specialty retail names, as investors reassess rate expectations and discretionary spending sensitivity across the sector.
Despite the drawdown, Barchart’s analyst compilation still shows a “Strong Buy” consensus rating on Tractor Supply, though the lack of a current published price target makes it harder to benchmark how far sentiment has adjusted to the latest selloff.[2] For traders focused on TSCO seasonal trend analysis, the key question is whether this weakness represents a reset ahead of the historically strong midterm-year window or a sign that macro headwinds could blunt the pattern this time around.
The chart below situates the latest move against the past year of trading and a short-term seasonal projection.
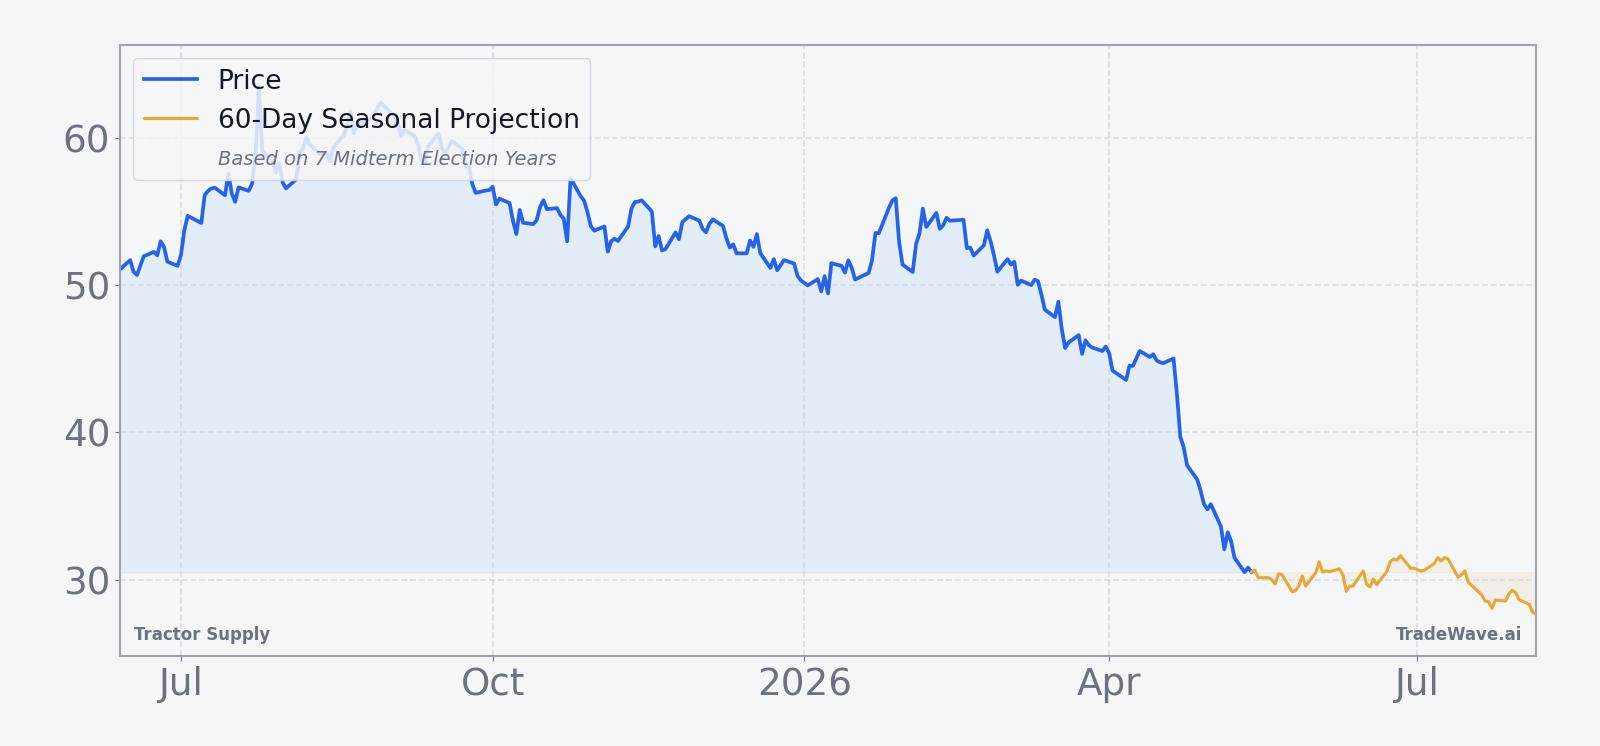
What should traders watch as the next TSCO seasonal window approaches?
With the 159-day midterm-year window set to begin on Jun 13, traders watching Tractor Supply’s seasonal pattern will be focused on whether the stock can stabilize above the 52-week low or whether selling pressure accelerates into the start of the regime. A firm base in the low 30s followed by improving price action would be more consistent with the historical pattern of strong midyear performance, while a decisive break below 29.42 that fails to recover would mark a clear departure from prior cycles.
Macro and policy catalysts will matter as well. The midterm election year often brings noisy headlines around fiscal policy, regulation and rural infrastructure, all of which can influence sentiment toward a retailer tied closely to agricultural and exurban demand. Any shift in rate expectations that affects consumer credit costs or housing-related spending could either reinforce or undercut the typical TSCO seasonal trend.
Inside the window, behavior around earnings and guidance updates will be key tells. Historically, the strongest years in this pattern, such as 2002 and 2018, saw Tractor Supply not only finish the window with double-digit gains but also post sizable maximum favorable moves along the way, suggesting that positive catalysts were met with sustained buying rather than quick fades. If upcoming reports and management commentary spark rallies that hold, it would echo that history; if they are sold aggressively, it would argue that the current macro backdrop is overpowering the usual seasonal tailwind.
Finally, traders should keep an eye on volatility itself. Past windows have combined strong average gains with occasional deep drawdowns, especially in earlier cycles, so a sharp shakeout early in the period would not automatically invalidate the pattern. What would contradict the historical TSCO seasonal trend is a midterm-year window that spends most of its time grinding lower without meaningful recovery, something that has not occurred in the last seven cycles.
Sources
About this seasonal analysis
Seasonal pattern data is sourced from TradeWave.ai, which analyzes historical price behavior across annual calendar windows going back up to 30 years. Read the full data methodology or the book The 100-Year Pattern by Afshin Moshrefi (2026 edition). Past performance of seasonal patterns does not guarantee future results. This article is for informational purposes only and does not constitute investment advice.