Cisco (CSCO) Has Dropped in 6 of 7 Midterm May Windows, With Shorts Averaging 5.56%
Cisco is trading just above its 52-week high ahead of earnings, with a historically bearish 14-day midterm-election-year window set to open this week.

What is the seasonal pattern for Cisco (CSCO)?
Cisco has fallen in 6 of 7 midterm-election-year windows starting around May 16, with an average 5.56% gain in winning years for the short side.
- 6-for-7 record in this window for short trades, with winning years averaging a 5.56% move in the trade direction.
- The upcoming 14-day window begins May 16 and has historically been a weak stretch for Cisco in midterm election years.
- Percent Profitable stands at 86%, with 6 winners and 1 loser for the short-side pattern across the last seven midterm cycles.
- Avg Profit in winning years is 5.56%, while Avg Profit - All, which includes the lone losing year, is still a solid 5%.
- Intraperiod swings have been meaningful, with some years showing deep adverse moves before resolving in favor of the short side.
- The pattern clusters in the mid part of the midterm election year, a phase that often brings choppier trading for large-cap tech hardware names.
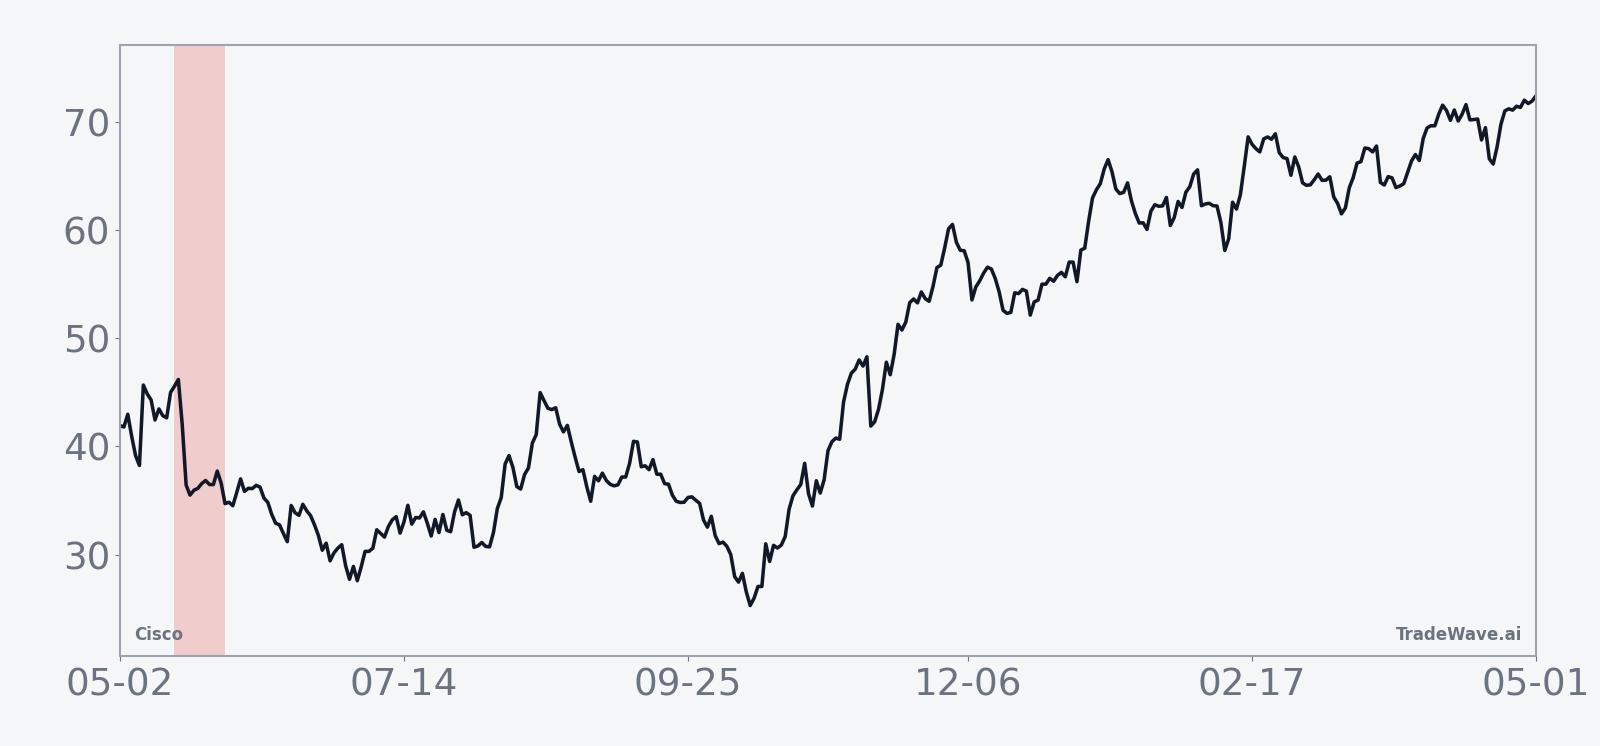
According to historical data from TradeWave.ai, this mid-May stretch has behaved very differently from an average month for Cisco, and the next iteration is just days away.
How has Cisco (CSCO) traded in this midterm-year May window?
Cisco has dropped in 6 of the last 7 midterm-election-year windows that start around May 16, making this a historically bearish two-week stretch for the stock. Shares finished Monday at 98.72, up 2.2% on the day and about 4.2% above their 52-week high of 94.72, leaving little margin for error if the pattern repeats.
Grouping the data by the presidential election cycle matters here because this pattern only looks at the last seven midterm election years, a phase that often brings policy uncertainty, tighter financial conditions and more tactical sector rotation. Cisco sits at the intersection of networking hardware and AI infrastructure, so its midterm-year behavior can reflect how institutional investors rebalance exposure to cyclical tech spending as Washington debates budgets and regulation.
This seasonal window begins on May 16 and spans 14 trading days. Historically, during this period, Cisco has tended to drift lower, which is favorable for the short-side pattern and unusual for a large-cap tech name that often benefits from broader risk-on flows.
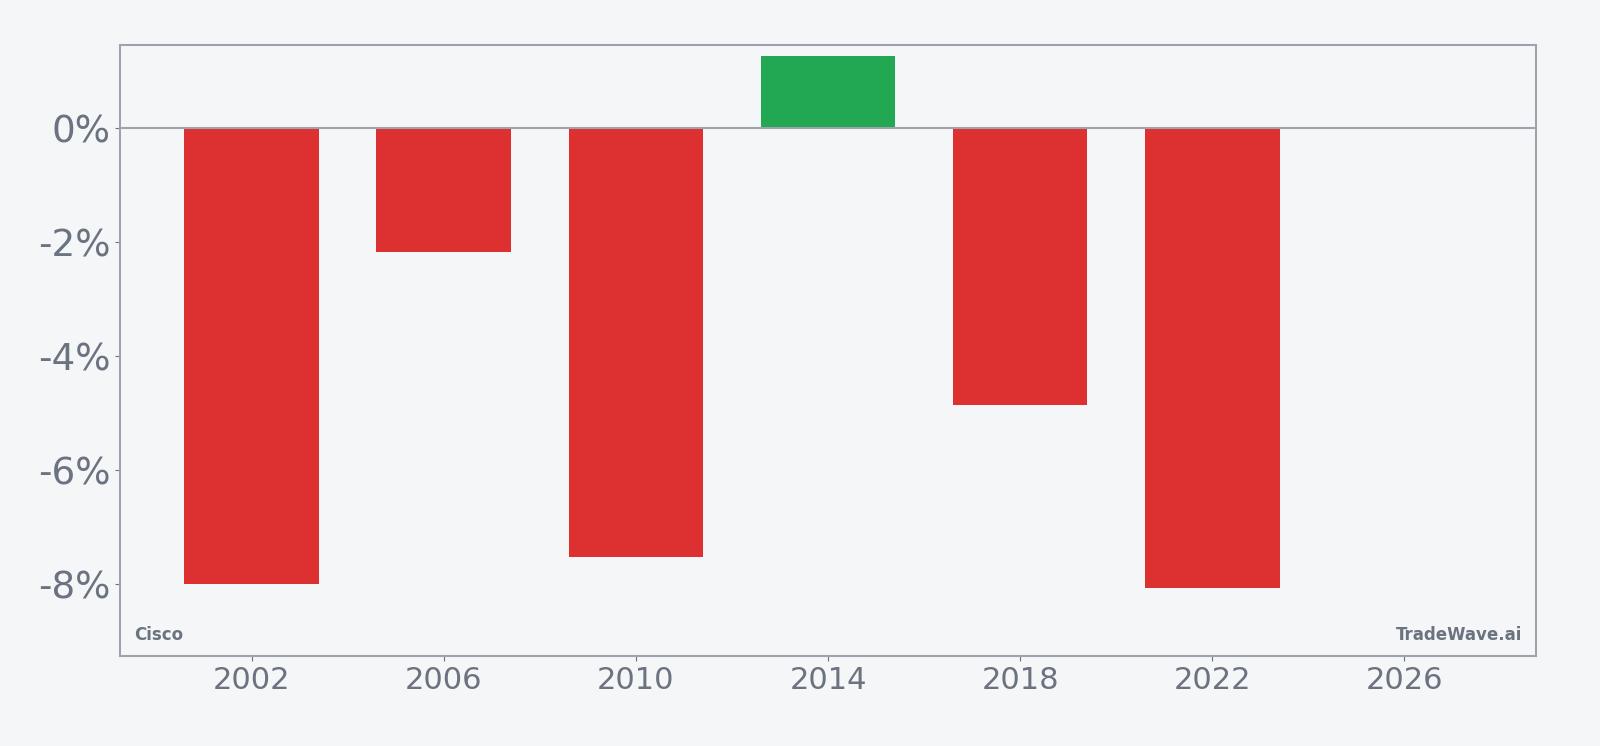
The win-loss profile is striking for a short setup. Percent Profitable is 86%, with 6 winning short years and just 1 losing year, and the average gain in winning years is 5.56% in the trade direction. When every year is included, the all-years average still comes in at 5%, which means the lone losing year did not fully offset the downside bias in the rest of the sample.
The per-year table shows how that has played out in practice. In 2022, for example, Cisco’s short-side net return in this window was 8.06%, with a best intraperiod move of 3.51% in favor of the short and a worst drawdown of 16.29% against it, underscoring how volatile the window can be even when it ultimately resolves lower. By contrast, 2014 was the only losing year for the short pattern, with a 1.27% net move against the trade and a relatively modest worst drawdown of 1.44% from entry.
Looking across all seven midterm years, the maximum favorable excursion, or best point-to-peak move within the window, has often been several percentage points even in years where the final net move was smaller. The maximum adverse excursion, or worst intraperiod drawdown, has at times been larger than the final result, which means traders who were early or over-levered could have been stopped out before the pattern played out.
A second view stacks net results with the best and worst intraperiod swings to show how far Cisco has tended to travel inside the window.
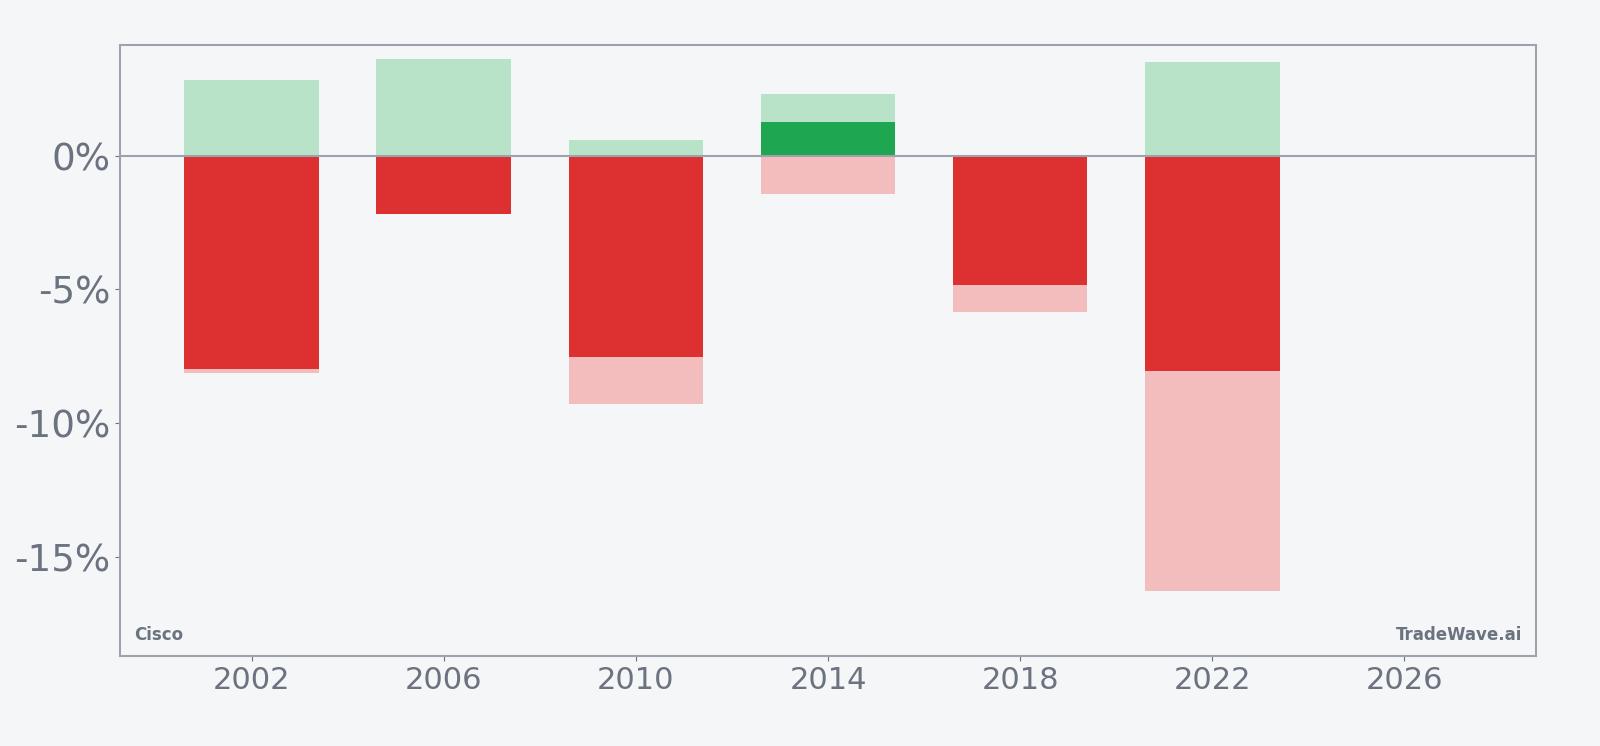
The stacked net, best-case and worst-case bars show a clear pattern: in most years, Cisco has offered meaningful downside follow-through for shorts, but the path has rarely been smooth. Several instances feature large adverse spikes before the trade direction reasserted itself, which fits with the idea of a choppy, policy-sensitive midterm environment rather than a quiet grind.
History does not guarantee future results; adverse excursions can be large even in winning windows, so traders using this pattern need to respect the potential for sharp countertrend moves.
Why does Cisco (CSCO) follow this seasonal pattern?
One likely driver is the clustering of Cisco’s fiscal-year earnings updates and guidance resets around this part of the calendar, which can trigger portfolio repositioning in networking and AI infrastructure names. Analysts have also pointed to midterm-year budget debates and shifting enterprise IT spending plans, which can make large-cap hardware stocks more sensitive to short-term macro headlines. The pattern may reflect institutional investors trimming or hedging exposure into these events, creating a repeatable pocket of downside pressure in mid-May.
What is driving Cisco (CSCO) today?
Cisco closed at 98.72 on Monday, up 2.15 points or 2.2%, extending a one-month gain of 9.49% and leaving the stock about 4.2% above its 52-week high of 94.72 on heavy volume of roughly 30.3 million shares versus a 20-day average near 17.0 million. The move comes one day before Cisco reports fiscal third-quarter results on May 13, with some professional traders looking for a potential move toward 110 to 120 over the next quarter if AI infrastructure demand stays strong.[2]
In February, Cisco’s last earnings report delivered an earnings-per-share beat and slightly better-than-expected revenue, but the stock sold off after guidance failed to impress, a reminder that expectations matter as much as the headline numbers.[1] In November 2025, Cisco raised its annual forecast on the back of strong AI-fueled equipment demand, and shares climbed as investors leaned into the networking and AI products story.[3][6] That AI infrastructure boom remains a key macro theme for the company, with networking revenue growth tied closely to data center build-outs by large cloud and enterprise customers.[6]
Options traders are leaning into the event as well, with call buyers pushing implied volatility to 47, the highest in over a year, a sign that the market is bracing for a sizable post-earnings move in either direction.[2] Add it up and Cisco is heading into this historically weak midterm-year window from a position of strength, with elevated expectations, heavy positioning and a stock price that has already sprinted ahead of its recent range.
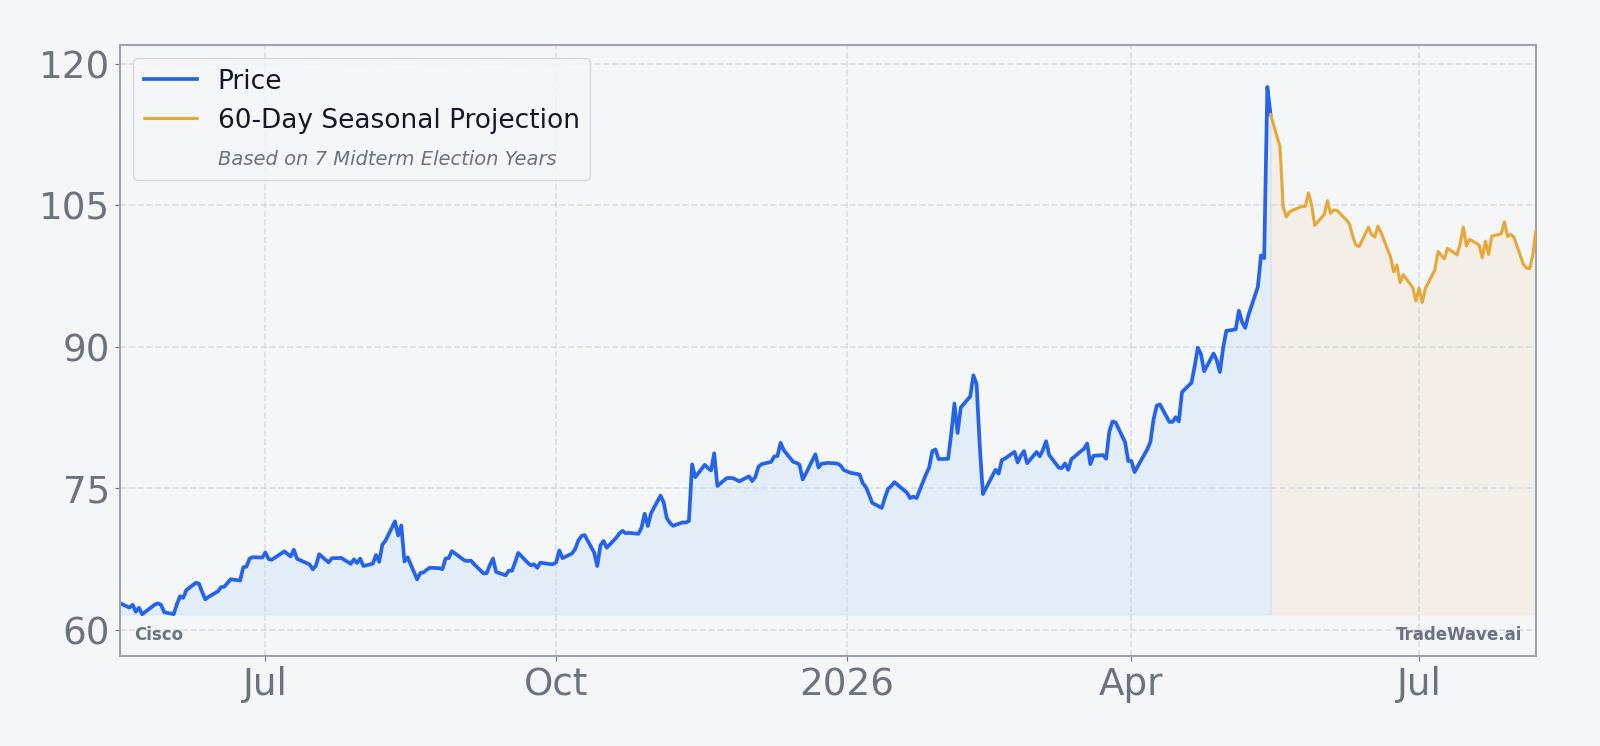
The chart below shows Cisco’s 12-month rally and a 60-day seasonal projection overlay as the mid-May window approaches.
What should traders watch in this Cisco (CSCO) window?
First, watch how Cisco trades in the days immediately after earnings relative to the 52-week high area around 94.72 and the current breakout zone near 100. A quick reversal back into that prior range during the May 16 to late-May window would be consistent with the historical midterm-year pattern, while a clean hold above 100 would signal that this cycle may be different.
Second, monitor whether the options market stays as charged as it is today. If call buying and implied volatility around 47 persist or even build after earnings, that would suggest traders are positioning for continued big swings rather than a quick fade in volatility, which could amplify any seasonal downside if the stock starts to roll over.[2]
Third, keep an eye on how AI infrastructure headlines and networking order commentary land with investors. Stronger-than-expected guidance could blunt the usual midterm-year weakness, while any hint of slowing data center demand or cautious enterprise spending could line up neatly with the historical short-side bias in this window.[2][6]
Finally, because this pattern is defined on the short side, the key tell will be whether intraperiod rallies are shallow and fade quickly, as they often have in prior midterm years, or whether buyers step in aggressively on any dip. Behavior inside this 14-day stretch will show whether Cisco is still following its midterm-election-year seasonal script or writing a new one.
Sources
- [1] CNBC, "Cisco's stock drops 7% on mediocre forecast even as earnings and revenue top estimates" (Feb 11, 2026).
- [2] CNBC, "Cisco could see a nearly 25% post-earnings boost over the next quarter, pro trader says" (May 11, 2026).
- [3] CNBC, "We're increasing our Cisco Systems price target after an AI-fueled beat and raise" (Nov 13, 2025).
- [4] CNBC, "Cisco shares slide after earnings fail to wow the Street. Here's our plan for the stock" (Feb 12, 2026).
- [6] Reuters, "Cisco shares climb on strong AI-fueled equipment demand" (Nov 13, 2025).
About this seasonal analysis
Seasonal pattern data is sourced from TradeWave.ai, which analyzes historical price behavior across annual calendar windows going back up to 30 years. Read the full data methodology or the book The 100-Year Pattern by Afshin Moshrefi (2026 edition). Past performance of seasonal patterns does not guarantee future results. This article is for informational purposes only and does not constitute investment advice.