Advanced Micro Devices (AMD) Near Highs as 8-of-10 Midterm June Windows Have Ended in Declines
Advanced Micro Devices is heading toward a historically weak 17-day June window even as the stock trades just below record highs after an AI-driven earnings surge.

What is the seasonal pattern for Advanced Micro Devices (AMD)?
Advanced Micro Devices has fallen in 8 of 10 midterm-election-year June windows starting June 10, with an average 6.65% gain in winning years for the short setup.
- 8 for 10 in this window for the short side, with winning years averaging a 6.65% move in the trade direction.
- The 17-day window begins Jun 10 and historically aligns with midterm election years in the presidential cycle.
- Percent Profitable is 80%, with 8 winners and 2 losers for the short pattern across the last 10 midterm-election-year samples.
- Including all years, the average outcome is a 5% move in favor of the short, while average losing years have been limited to about -0.6% against the trade.
- Cumulative return for the pattern is 64%, with a Sharpe ratio of 1.14 and a TradeWave Ratio of 1.83, pointing to meaningful directional follow-through.
- Intraperiod swings have been sizable in some years, with both strong favorable drops and sharp adverse rallies showing this is a high-volatility AMD seasonal trend.
According to historical data from TradeWave.ai, this upcoming stretch has behaved very differently from an average month on the AMD calendar, especially in midterm election years.
How has Advanced Micro Devices (AMD) traded in this June midterm-year window?
Advanced Micro Devices has fallen in 8 of the last 10 midterm-election-year windows that start on Jun 10 and run for 17 trading days, making this a historically bearish slice of the calendar for the stock. Shares last closed at 449.38, leaving AMD about 1.5% below its 52-week high of 456.25 after a powerful AI-driven run. Options traders are also bracing for volatility, with contracts around the latest earnings event pricing a roughly 9% move in the stock, underscoring how aggressively the market is positioning around catalysts in this regime.[1]
The pattern is built on the last 10 midterm election years, a phase of the presidential cycle that often brings policy uncertainty, tighter financial conditions and choppier risk appetite. Grouping AMD’s behavior by this election-year bucket rather than by simple calendar years matters because the company now sits at the center of debates over AI infrastructure, export controls and industrial policy, all of which tend to flare during mid-cycle Washington negotiations.
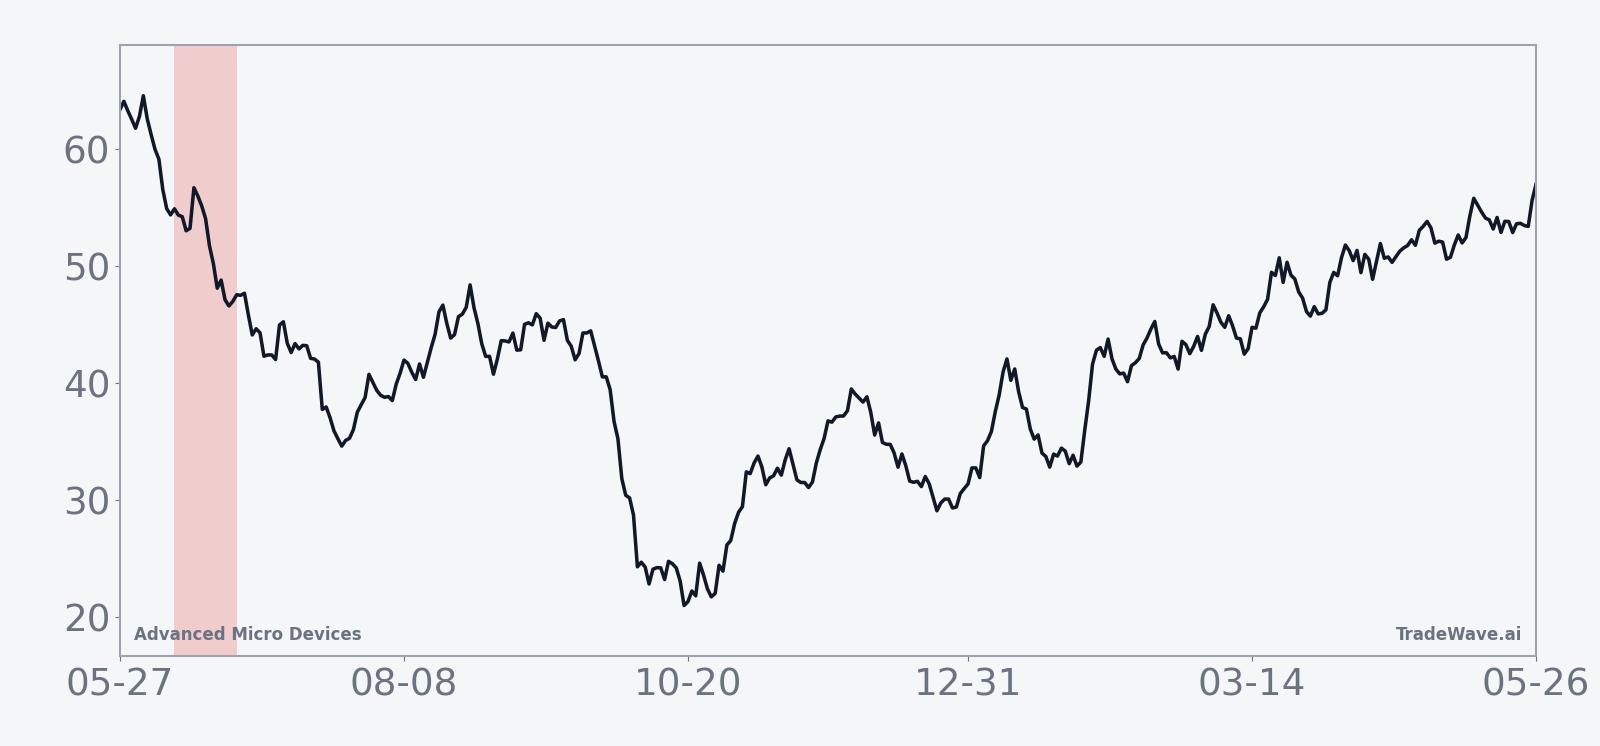
The historical seasonal average for this Advanced Micro Devices trading window slopes lower, consistent with the short trade direction. The typical path shows weakness building through the middle of the 17-day stretch rather than a one-day air pocket, which means prior cycles have tended to drift down rather than crash outright. That profile fits a pattern where rallies have often faded as midterm-year policy headlines and positioning shifts hit high-beta tech.
Year-by-year net returns and intraperiod swings show how often AMD has broken lower and how deep the worst drawdowns have run.
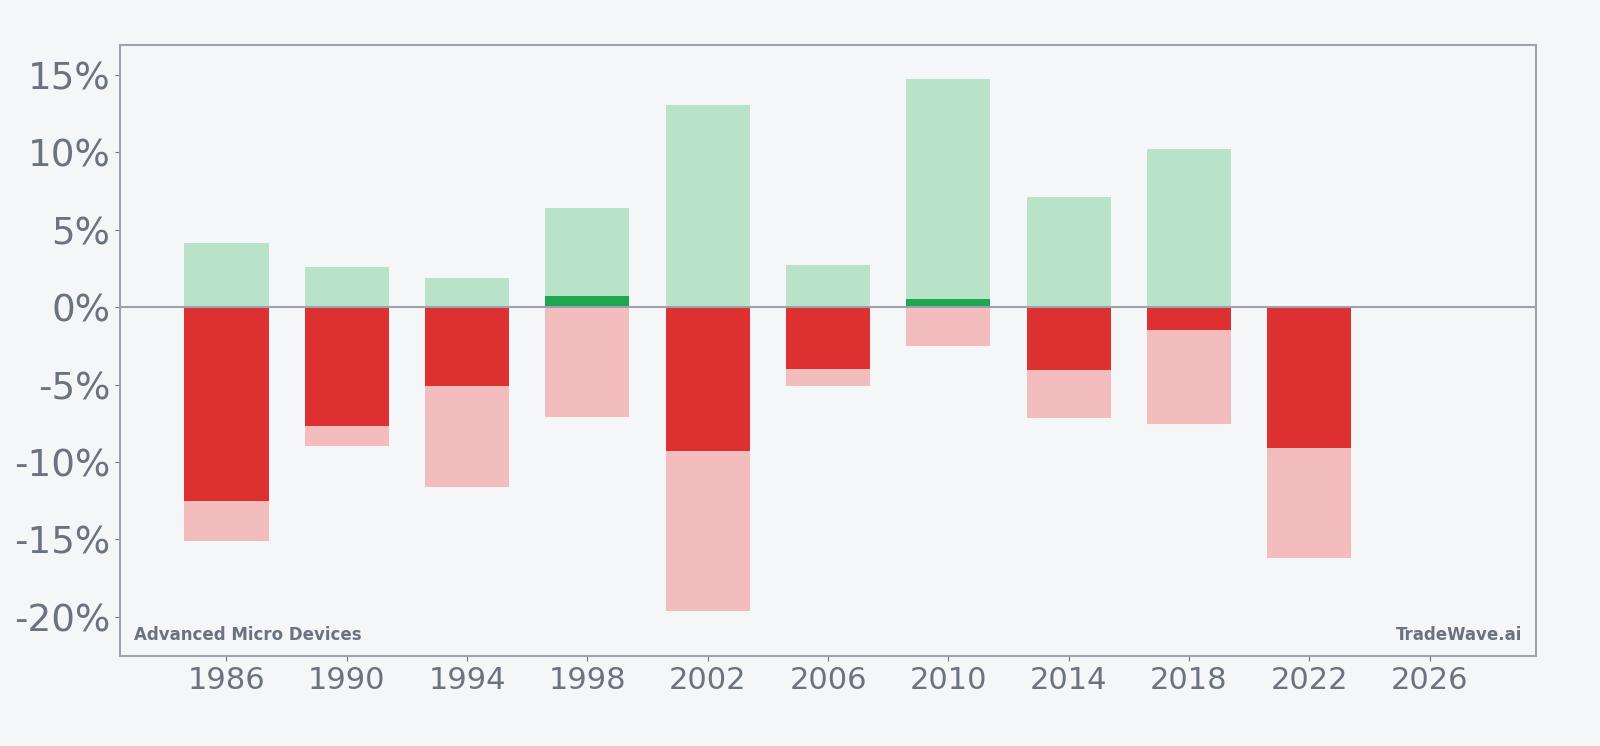
Across individual years, the strongest short-friendly outcomes came in 1986 and 2022, when AMD dropped 12.5% and 9.13% respectively during the window, with adverse excursions inside those trades reaching as deep as -16.23% from entry in 2022. On the other side, the two losing years for the short pattern saw modest net gains for the stock of 0.5% and 0.71%, but even those “up” windows featured sizable intraperiod downside moves, with maximum favorable excursions for shorts reaching double digits before AMD ultimately bounced. That mix of large maximum favorable move and meaningful maximum adverse move underlines a high-variance setup where the stock has often swung hard in both directions before the window closes.
Put together, the stats paint a clear picture: this midterm-year June window has historically favored downside follow-through in AMD, with 80% of samples working for shorts and a 64% cumulative return for the pattern, but the path has rarely been smooth.
Why does Advanced Micro Devices (AMD) follow this seasonal pattern?
One likely driver is the way AMD’s earnings calendar and product updates cluster around midyear, often leaving a quieter, digestion phase in the weeks that follow. Analysts have also pointed to midterm-year policy debates over tech regulation, export controls and fiscal priorities, which can weigh on high-multiple semiconductor names after strong runs. This June seasonal pattern may reflect institutional portfolio repositioning as investors rebalance AI and chip exposure ahead of the second half of the year.
History does not guarantee future results; adverse excursions can be large even in winning windows, so traders should treat this AMD seasonal trend as context rather than a forecast.
What is driving Advanced Micro Devices (AMD) today?
Advanced Micro Devices has been on a tear, with the stock closing at 449.38 after a 10.0% single-session jump and sitting about 1.5% below its 52-week high of 456.25. The latest leg higher followed Q1 2026 results in which profit nearly doubled on surging AI and data center demand, reinforcing AMD’s role as a core beneficiary of the build-out in accelerated computing.[2] That strength comes on top of earlier guidance pointing to upside in Q3 sales and a long runway for CPU and GPU share gains in cloud and enterprise workloads.[2]
Options markets are leaning into that volatility. Around the Q1 2026 report, AMD options were pricing a roughly 9% post-earnings move, a sign that traders expect big swings as the AI narrative evolves and as the stock trades at elevated levels.[1] For a name that has already delivered an 85.76% one-month return and is trading far above its 50-day moving average of 254.51 on heavy volume, that kind of implied move underscores how sensitive positioning has become to any shift in the growth story.
The chart below situates the latest move in its recent multi-month context and overlays a 60-day seasonal projection.
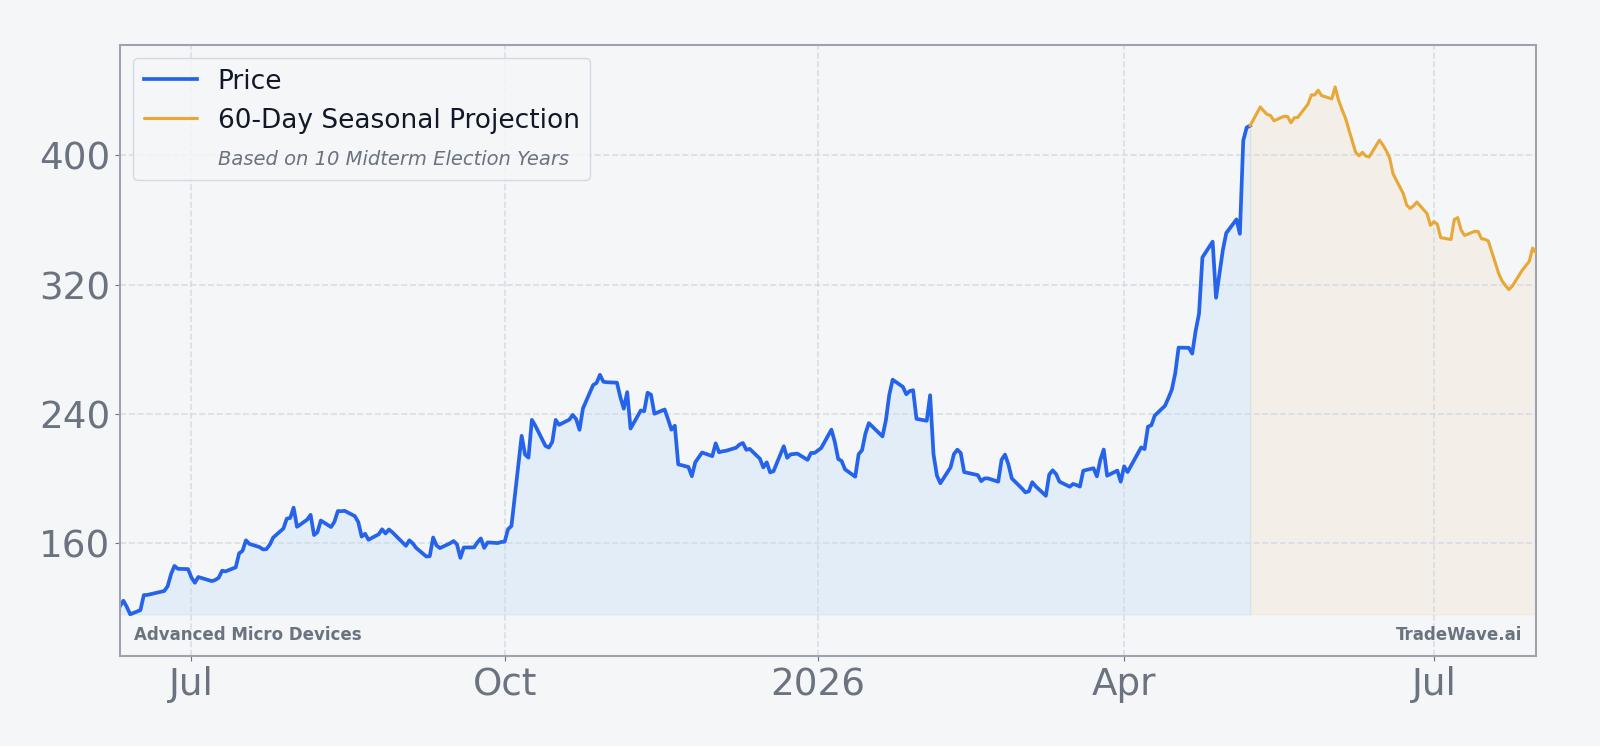
From a macro and sector standpoint, AMD sits at the crossroads of two powerful forces: the AI infrastructure boom and intensifying semiconductor competition. AI and data center demand have been the primary engines of revenue growth, with expectations that resumed China shipments could add another layer of upside in coming quarters.[2] At the same time, AMD’s Instinct accelerator line is squaring off against Nvidia’s GPUs, while the company pushes deeper into server CPUs against Intel, leaving little room for execution missteps as investors price in aggressive growth assumptions.[1]
That backdrop makes the upcoming seasonal window more than a curiosity. AMD is a key driver of major tech indices, and when the stock has stumbled in prior midterm-year June windows, the pullback has often coincided with broader wobbles in high-beta growth. If the historical pattern reasserts itself while the stock is trading near all-time highs and options markets are primed for big moves, the resulting volatility could ripple well beyond a single ticker.
What should traders watch as this AMD seasonal window approaches?
First, the calendar: the 17-day window tied to the last 10 midterm election years begins on Jun 10, so the next few weeks are about watching how AMD behaves as it approaches that date. A failure to hold the recent breakout zone near the mid-400s during the window would be more consistent with the historical pattern, while a clean push to and through the 52-week high with shallow pullbacks would mark a clear departure from past midterm-year behavior.
Second, options and volume: traders should monitor whether the elevated implied volatility around Q1 earnings persists or fades as the window opens.[1] Continued heavy call buying and upside skew would suggest investors are willing to lean against the bearish seasonal tendency, while a shift toward put demand or hedging flows would rhyme more closely with the 8-for-10 short-friendly track record.
Third, the policy and macro tape: any fresh headlines on AI export rules, data center capex budgets or broader fiscal debates in Washington could act as catalysts inside this historically weak stretch for AMD. If those catalysts land during the window and the stock starts to show the kind of intraperiod swings seen in prior years, it would be a sign that the historical AMD seasonal trend is once again exerting influence.
Sources
- [1] Seeking Alpha: "AMD options traders price ~9% post-earnings move" (May 5, 2026).
- [2] Yahoo Finance: "AMD Jumps on AI Surge, Profit Nearly Doubles" (May 7, 2026).
- Barchart.com: "Can AMD Stock Hit $210 In 2025?" (Jul 31, 2025).
- Yahoo Finance: "AMD Reports August 5—Analyst Sees Q3 Upside and CPU Market Gains" (Jul 31, 2025).
- The Motley Fool: "AMD Stock Slips Despite 30% Earnings Growth and Stronger-Than-Expected Guidance" (Nov 5, 2025).
- Seeking Alpha: "AMD shares end in red after six straight days of gains" (Jul 31, 2025).
About this seasonal analysis
Seasonal pattern data is sourced from TradeWave.ai, which analyzes historical price behavior across annual calendar windows going back up to 30 years. Read the full data methodology or the book The 100-Year Pattern by Afshin Moshrefi (2026 edition). Past performance of seasonal patterns does not guarantee future results. This article is for informational purposes only and does not constitute investment advice.