Illinois Tool Works (ITW) Has Dropped in All 10 Midterm Summers, Shorts Averaged 7.74%
Illinois Tool Works is heading into a midterm-election-year seasonal window that has delivered declines in every prior cycle, even as the stock trades well below its 52-week high.

What is the seasonal pattern for Illinois Tool Works (ITW)?
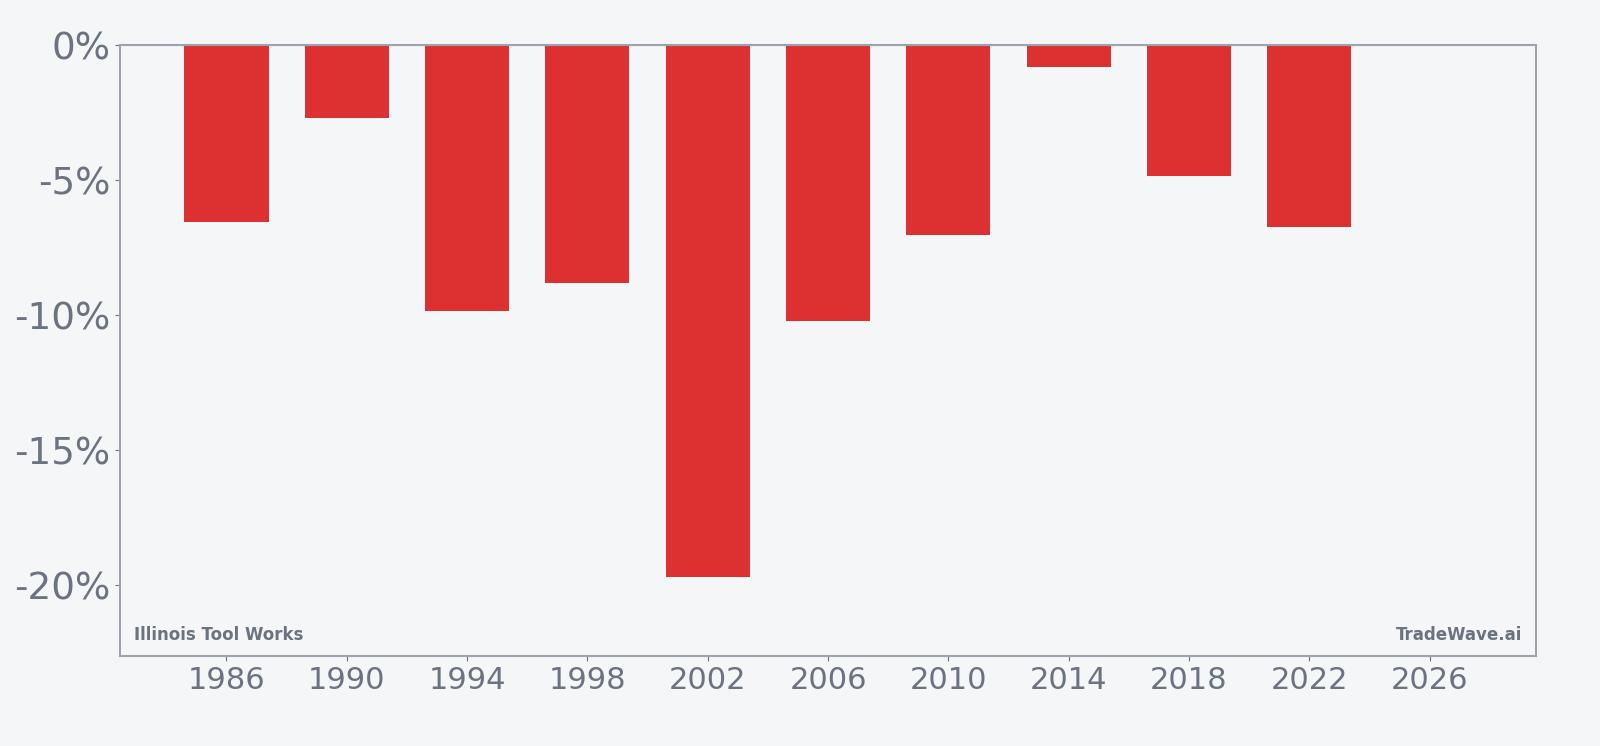
Illinois Tool Works has fallen in 10 of 10 midterm-election-year windows starting around May 27, with an average 7.74% gain for short positions in winning years.
- 10 for 10 in this window for shorts, with average winning-year profits of 7.74% over 58 trading days.
- Seasonal window runs from May 27 for 58 days, grouped across the last 10 midterm election years.
- Percent Profitable is 100%, with 10 winners and 0 losers for the short-side pattern.
- Trade Direction is short, supported by a TradeWave Ratio of 1.98 and a Sharpe ratio of 1.38.
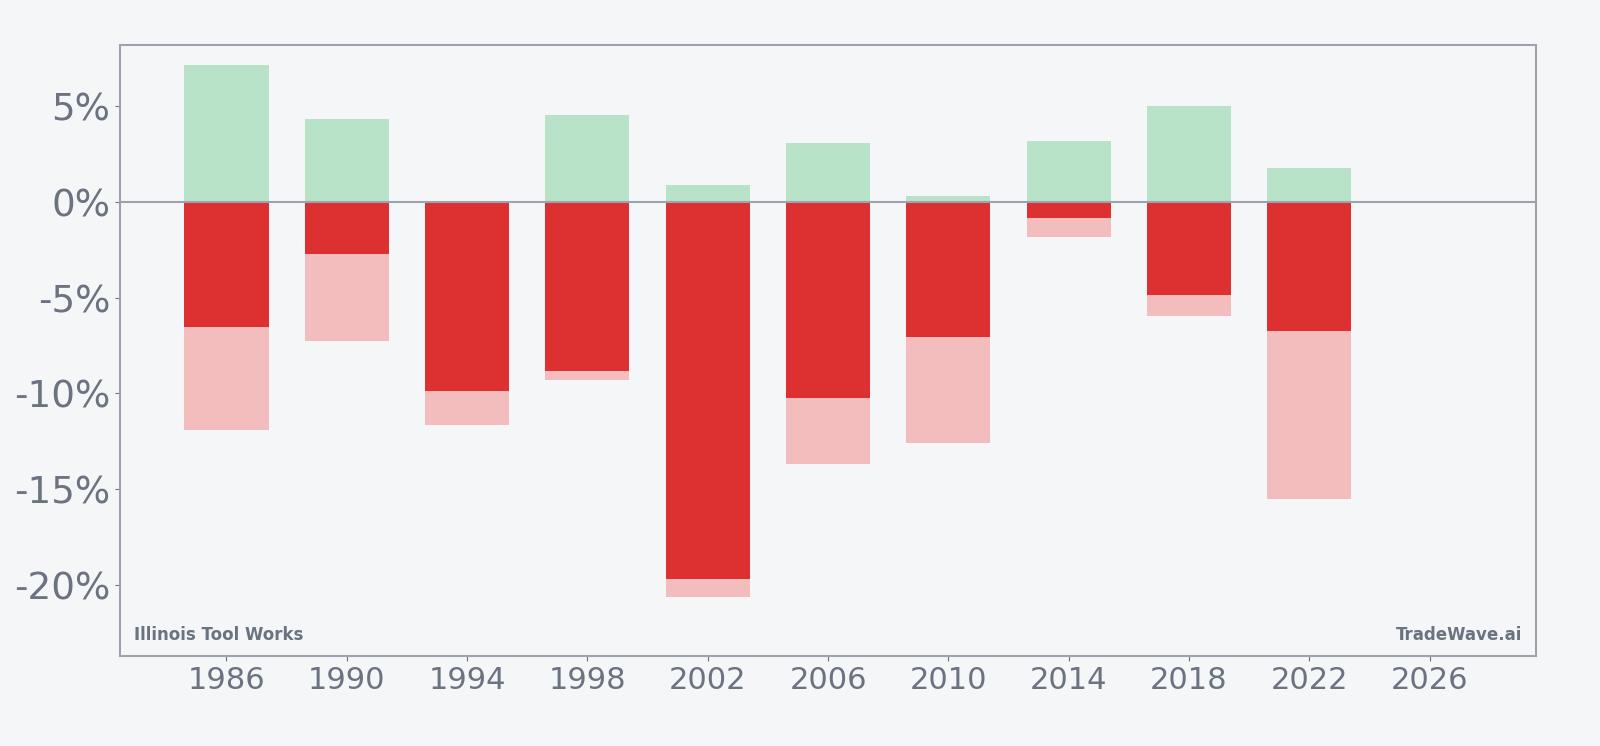
- Individual years have seen adverse moves as deep as about 20.64% before ultimately finishing lower.
- Cumulative return across all 10 midterm-year windows is 108% for the short strategy in this Illinois Tool Works trading window.
According to historical data from TradeWave.ai, this midterm-election-year stretch has behaved very differently from an average summer for Illinois Tool Works, and the next iteration is about to open again.
How has Illinois Tool Works (ITW) traded in this midterm-year summer window?
Illinois Tool Works has declined in all 10 midterm-election-year windows that begin around May 27, with short positions averaging 7.74% profits over the 58-day span. Shares last closed at 250.05, up 0.96% on the day and sitting about 17.5% below the 52-week high of 303.16, leaving room on the chart if this historical seasonality reasserts itself.
Because this Illinois Tool Works seasonal trend is grouped by the presidential election cycle, it reflects how industrials have behaved specifically in the midterm election year, when policy uncertainty and spending debates often peak. The current calendar is in that same midterm year phase, so the upcoming May 27 start date lines up directly with the historical pattern rather than being averaged across unrelated years.
A second view shows how far Illinois Tool Works has typically moved in both favorable and adverse directions inside each window.
The 10-year record is striking: every midterm-year iteration of this Illinois Tool Works trading window has ended with the stock lower, consistent with the short-side Trade Direction. Average profit of 7.74% for those short trades sits alongside a 108% cumulative return across all windows, and the Sharpe ratio of 1.38 points to a historically strong risk-adjusted profile for the pattern.
At the same time, the MFE and MAE history shows that the ride has rarely been smooth. In 2002, for example, the stock ultimately fell about 19.7% from entry to exit, but the worst intraperiod drawdown against the short position reached roughly 20.64% before the decline stuck. Other years, such as 1986 and 1994, also saw adverse excursions in the low double digits even though the final outcome still favored shorts.
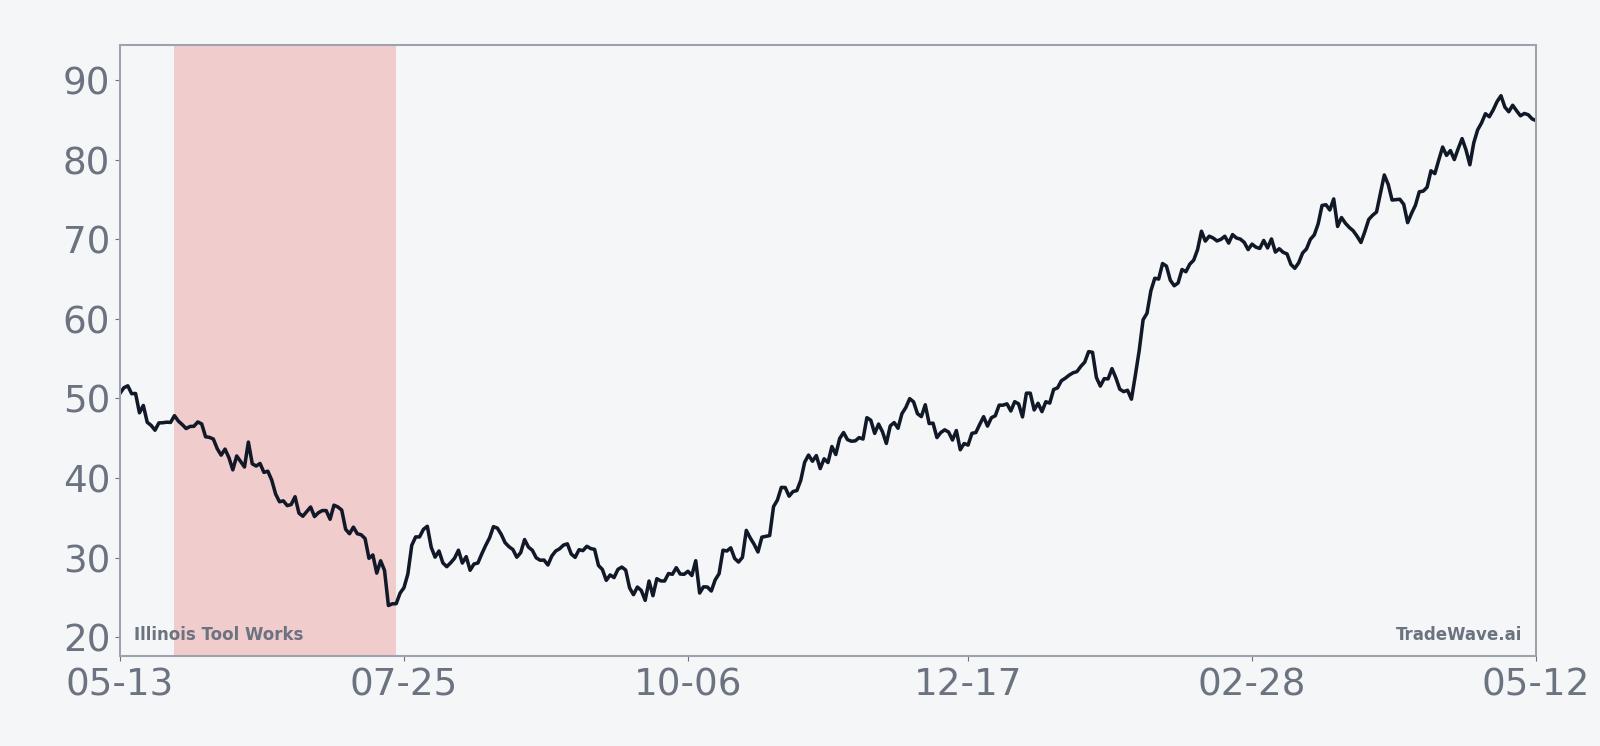
The typical seasonal path in the trend chart tilts lower fairly steadily rather than collapsing all at once. That suggests a grind-down pattern where Illinois Tool Works has tended to weaken over several weeks, with intermittent rallies that show up as positive maximum favorable excursions for longs but losing years for anyone following the short seasonal setup.
Add it up: 10 for 10 winning short windows, mid-single to low-double-digit average declines, and a history of sizable intraperiod swings that have not prevented the pattern from finishing in the same direction each time.
Why does Illinois Tool Works (ITW) follow this seasonal pattern?
One likely driver is the way industrials respond to midyear macro and policy headlines in the midterm election year, when Washington spending fights and regulatory noise can weigh on capital-goods demand. Analysts often point to institutional portfolio repositioning around midyear, as managers adjust exposure to economically sensitive names like Illinois Tool Works ahead of the year’s second-half policy and growth narrative. This Illinois Tool Works seasonal pattern may also reflect the company’s earnings calendar, with guidance updates and order commentary in this stretch historically skewing cautious enough to pressure the stock.
History does not guarantee future results; adverse excursions can be large even in windows that have ultimately favored the short-side pattern.
What is driving Illinois Tool Works (ITW) today?
Illinois Tool Works closed at 250.05 on May 18, up 2.37 points or 0.96% on the day, with roughly 1.08 million shares changing hands against a 20-day average volume of about 1.12 million. The stock sits about 17.5% below its 52-week high of 303.16 and roughly 8.0% above its 52-week low near 230.77, while trading under its 50-day moving average of 262.96, a setup that leaves it in a pullback phase rather than at extremes.
The chart below situates the latest move in its recent multi-month context and overlays the upcoming 60-day seasonal projection.
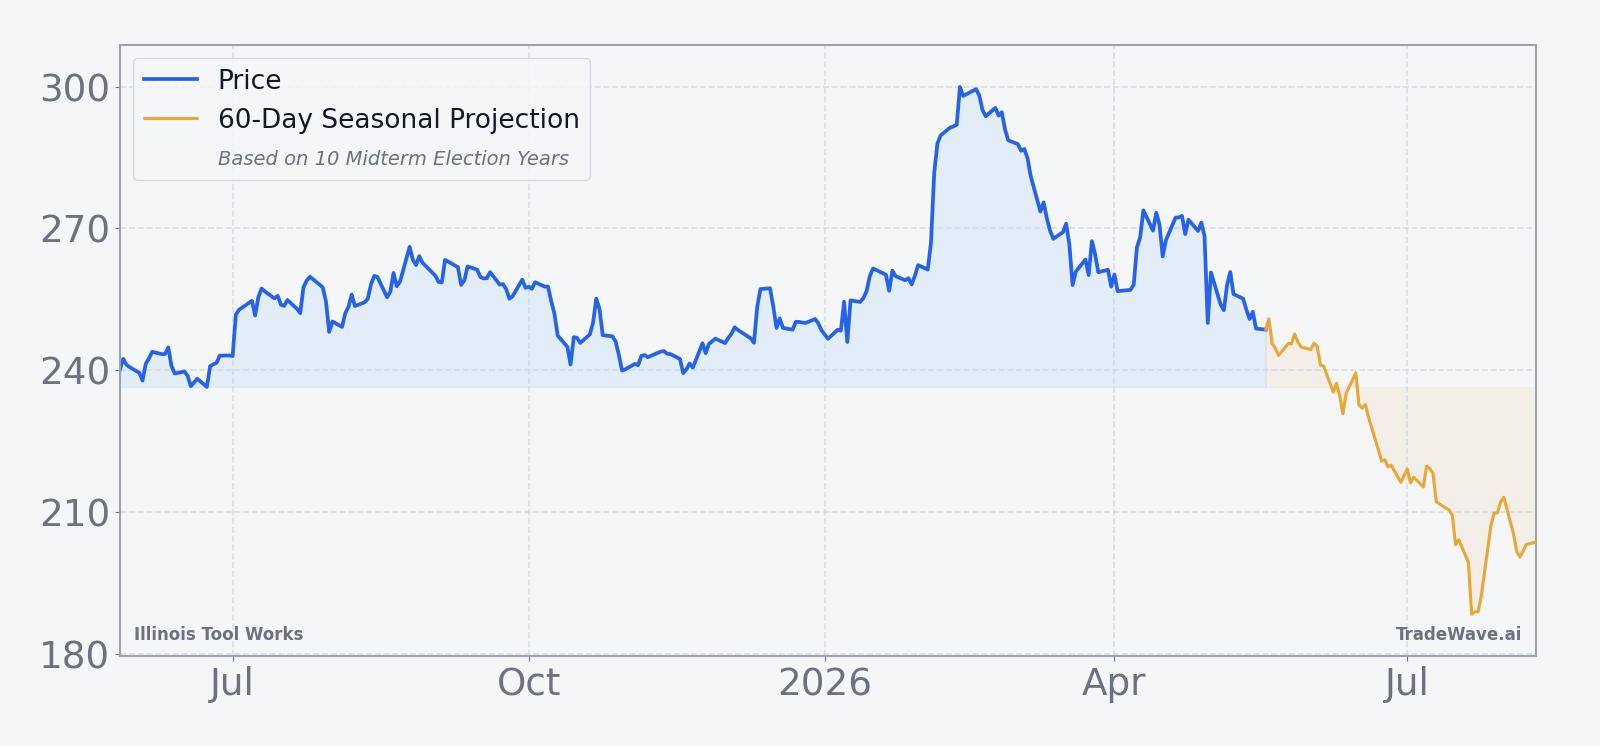
With no near-term earnings date or major company-specific catalyst on the calendar, trading in Illinois Tool Works has been driven mainly by broader industrial-sector sentiment and interest-rate expectations. The stock’s one-month return of about -8.52% reflects that macro pressure, but the upcoming seasonal window suggests that, in prior midterm years, weakness in this part of the calendar has often persisted rather than snapping back quickly.
Sources
About this seasonal analysis
Seasonal pattern data is sourced from TradeWave.ai, which analyzes historical price behavior across annual calendar windows going back up to 30 years. Read the full data methodology or the book The 100-Year Pattern by Afshin Moshrefi (2026 edition). Past performance of seasonal patterns does not guarantee future results. This article is for informational purposes only and does not constitute investment advice.