Ross Stores (ROST) Has Risen in 8 of 9 Midterm Windows, Averaging 23.63% Gains
Ross Stores is heading toward a historically strong 358-day midterm-election-year seasonal window, even as the stock trades below its recent highs and investors weigh how long the off-price boom can last.

What is the seasonal pattern for Ross Stores (ROST)?
Ross Stores has risen in 8 of 9 midterm-election-year windows starting around June 13, with an average gain of 23.63% in winning years.
- 8-for-9 record in this window, with winning years averaging 23.63% gains and only one small losing year.
- The upcoming seasonal window begins Jun 13, 2026 and runs for 358 trading days across the last 9 midterm election years.
- Percent Profitable is 89%, with 8 winners and 1 loser across the historical sample.
- Including all years, the average outcome is a 21% gain, reflecting how mild the lone down year has been.
- Maximum favorable moves have reached as high as 64.64%, while adverse excursions have stretched to -58.32% in the most volatile year.
- Trade Direction is long, with a TradeWave Ratio of 1.6 and a Sharpe ratio of 1.02, pointing to a historically strong but sometimes bumpy ride.
According to historical data from TradeWave.ai, this midterm-election-year stretch has behaved very differently from an average calendar year for Ross Stores. The next section looks at how that pattern has played out and what it could mean for the coming cycle.
How has Ross Stores (ROST) traded in past midterm-year windows?
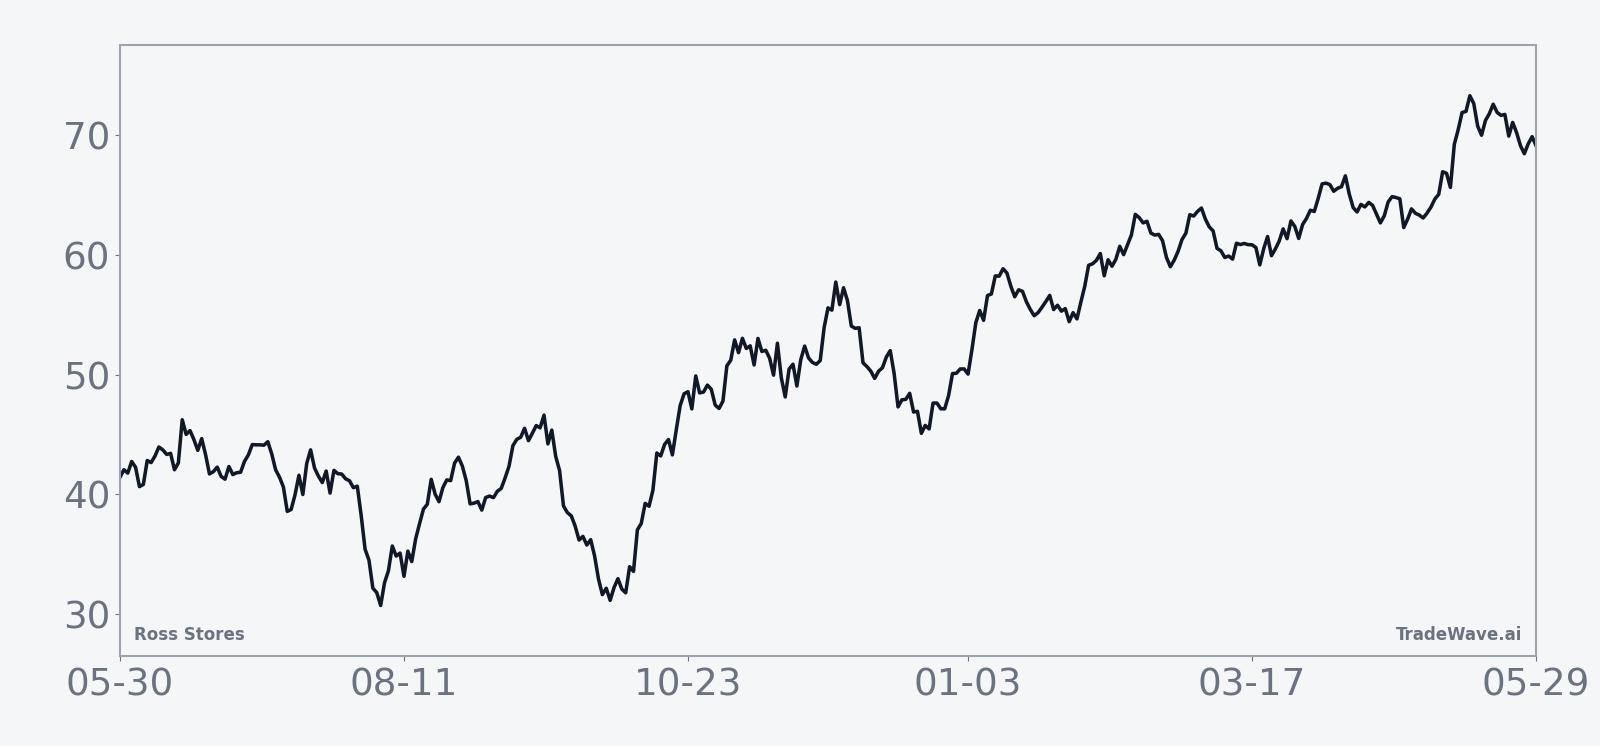
Ross Stores has risen in 8 of the last 9 midterm-election-year windows that start around Jun 13 and run for 358 trading days, a strikingly strong long-side pattern. Today the stock closed at $212.33, leaving it about 8.1% below its 52-week high of $231.16 and well above its 52-week low of roughly $123.26. That combination of a strong historical seasonal trend and a pullback from the highs gives traders a clean backdrop to judge whether this cycle will rhyme with the past.
Grouping the data by the presidential election cycle matters here because consumer and policy backdrops tend to repeat from one midterm year to the next. Off-price retailers like Ross often feel the impact of fiscal debates, tariff headlines and shifting household budgets more acutely in these mid-cycle years, so isolating midterm-election-year behavior can surface patterns that disappear in a simple calendar-average view.
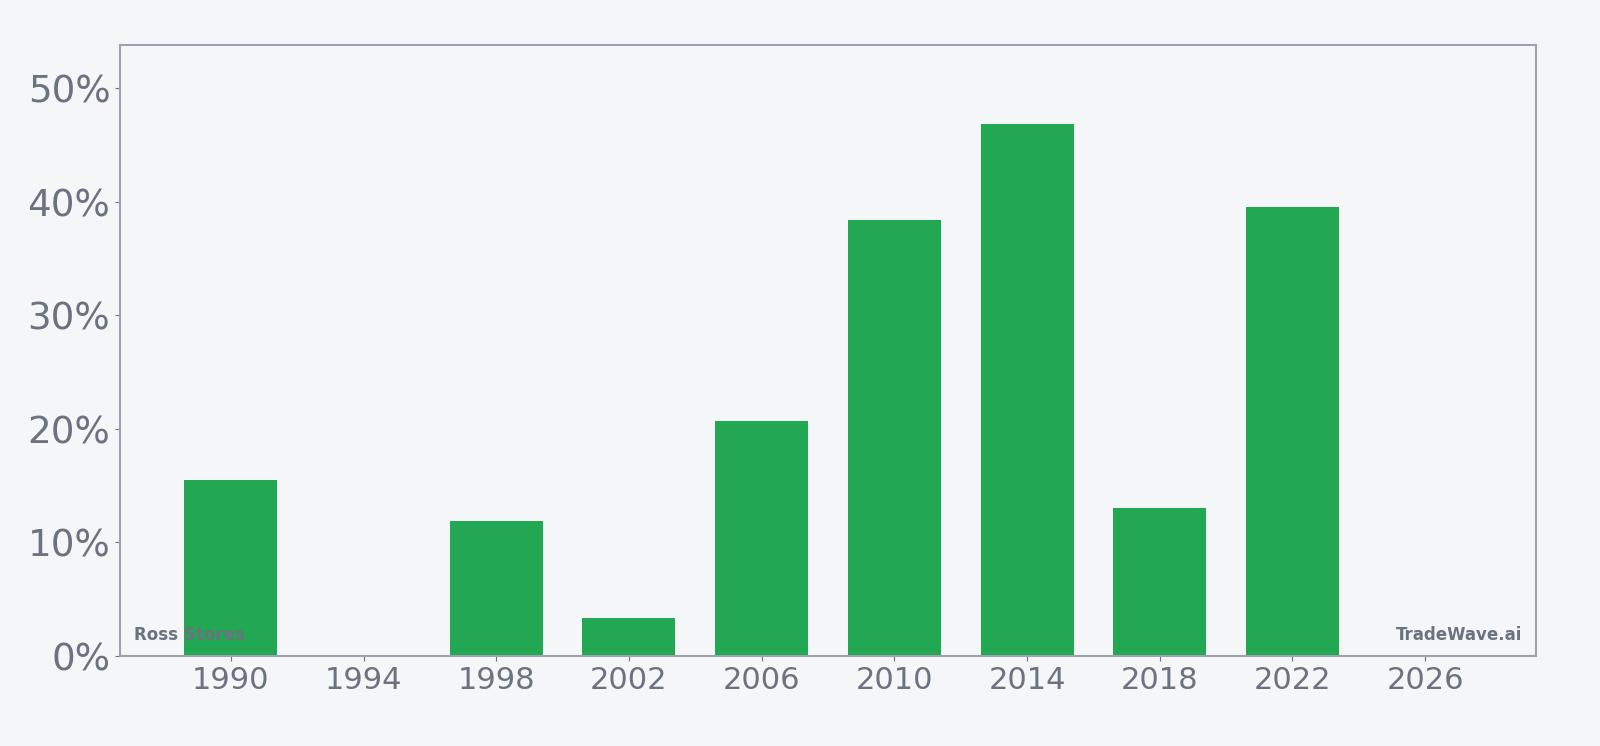
Historically, this 358-day window has been a strong long setup for Ross Stores. Percent Profitable sits at 89%, with 8 winners and just 1 loser, and the average gain in winning years is 23.63%. When you include the lone down year, the all-years average outcome is still a hefty 21%, which tells you that the losing stretch was shallow compared with the rallies.
The per-year breakdown shows how consistent that strength has been. Years like 2010, 2014 and 2022 posted net returns of 38.37%, 46.8% and 39.52% respectively, while the only losing year, 1994, slipped just 0.05%. Add it up: 415% cumulative return across the nine midterm-year windows, or an annualized return of 19.99% for traders who followed this specific Ross Stores trading window.
The historical seasonal trend line suggests that gains tend to build steadily rather than in a single burst. In several cycles, Ross has seen an early-year consolidation followed by stronger upside later in the window, which fits the idea that midterm-year uncertainty often gives way to a more constructive backdrop as policy questions get resolved.
The next view layers in both the best and worst intraperiod swings to show how far the stock has tended to travel inside the window.
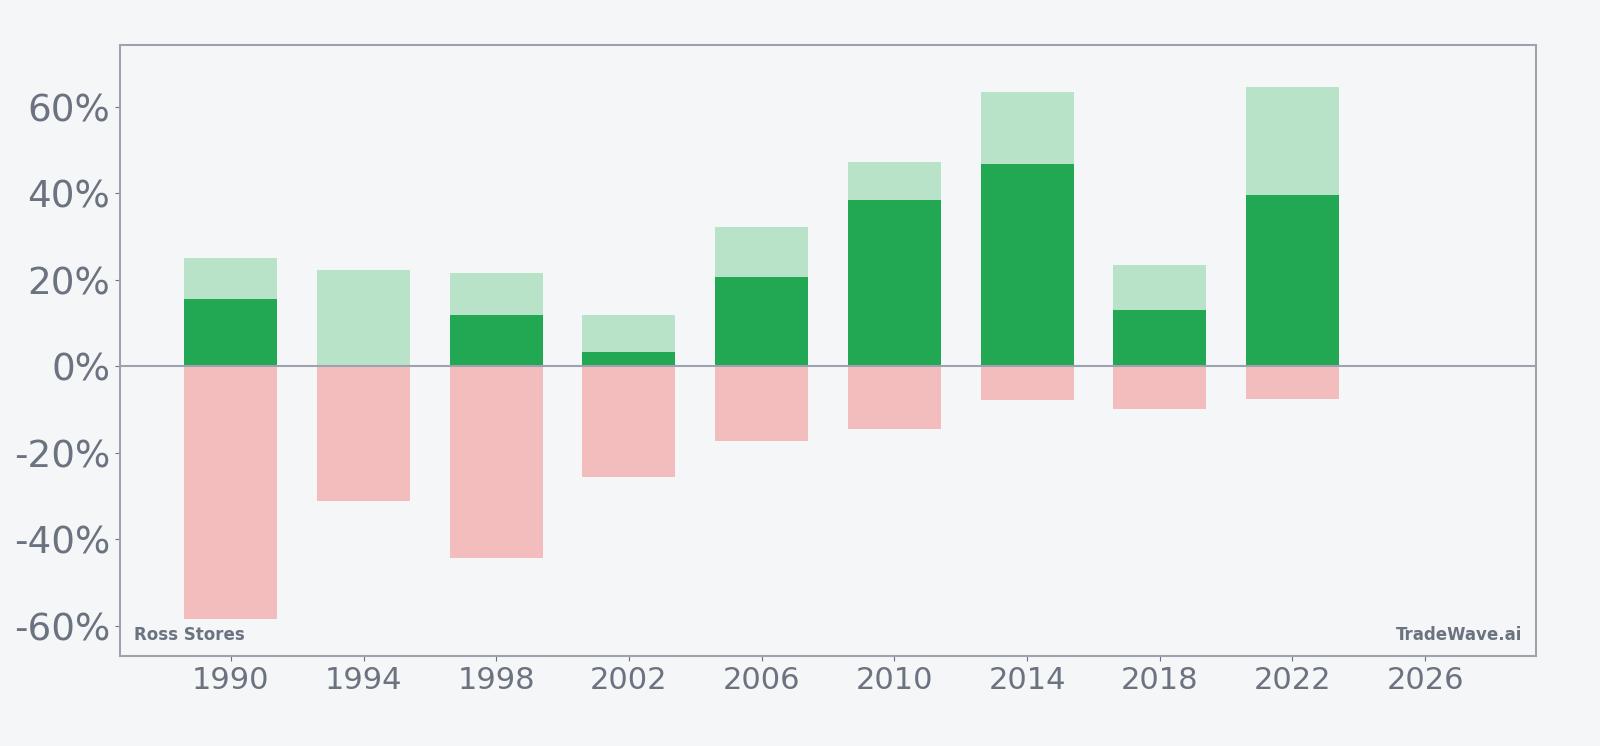
The maximum favorable excursion has reached between roughly 21% and 64.64% in the strongest years, while maximum adverse moves have ranged from about -7.47% to -58.32%. That mix points to a high-variance window where upside has usually dominated by the finish, but where drawdowns can be deep along the way. The TradeWave Ratio of 1.6 captures that tendency for price to travel meaningfully in the trade direction during the window, even if the path is not smooth.
History does not guarantee future results; adverse excursions can be large even in winning windows, so traders need to respect the downside as much as the upside.
Why does Ross Stores (ROST) follow this seasonal pattern?
One likely driver is the way consumer spending cycles and the retail earnings calendar line up in midterm election years. Analysts have pointed to a combination of back-to-school, holiday and tax-refund spending that tends to favor off-price chains when policy uncertainty and inflation keep shoppers focused on value. This pattern may also reflect institutional portfolio rotation into defensive consumer names as midterm-year political debates heat up, then out again as the pre-election year historically turns more broadly risk-on.
What is driving Ross Stores (ROST) today?
Ross Stores slipped 0.4% to $212.33 on Monday, extending a roughly 6.61% pullback over the past month and leaving the stock about 8.1% below its 52-week high of $231.16 on still-elevated volume relative to its 20-day average of about 2.14 million shares. The stock remains well above its 50-day moving average near $218.86, a sign that the recent consolidation comes after a strong multi-quarter run rather than a breakdown.
In March 2026, Ross reported fourth-quarter revenue of $6.64 billion, up 12.2% year over year and ahead of Wall Street estimates, with earnings per share of $2.00 also topping expectations.[3] Management guided for annual same-store sales growth of 3% to 4% and authorized a new $2.55 billion share buyback program, reinforcing the idea that off-price retail remains a structural winner as budget-conscious shoppers hunt for discounts in an inflationary environment.[5]
Earlier, in November 2025, the company had already lifted its annual profit forecast after a quarter of 7% comparable sales growth, citing strong demand for discounted goods as tariffs and inflation kept pressure on household budgets.[1] That backdrop has also benefited peers in the off-price retail sector, with rivals like TJX raising guidance as traffic shifted toward value-focused chains.[1] The macro message is straightforward: as long as consumers feel squeezed, off-price retailers tend to capture incremental share.
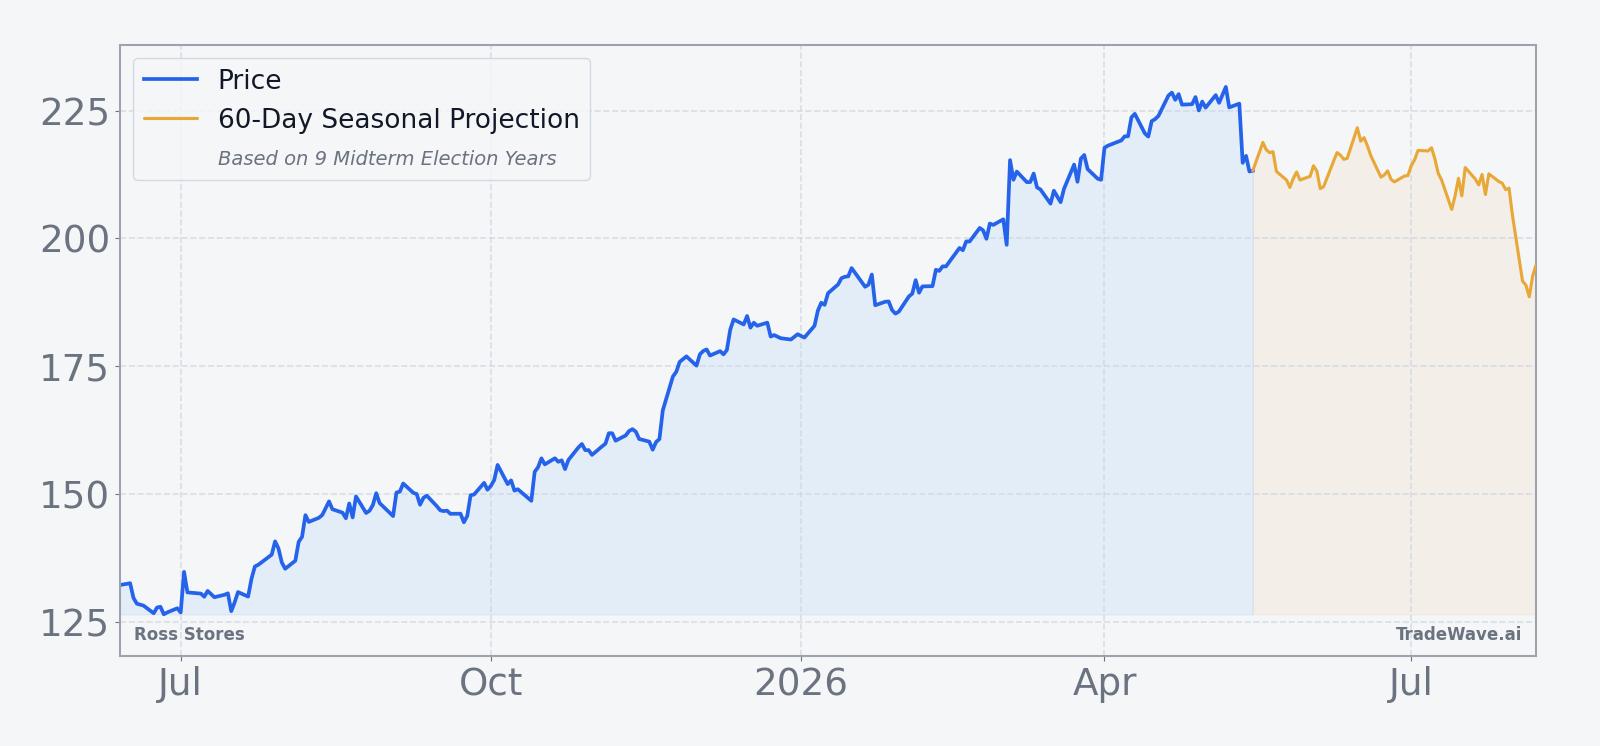
The chart below situates the latest pullback against the past year of trading and a 60-day seasonal projection.
What should traders watch as this Ross Stores seasonal window approaches?
First, the calendar. The next 358-day midterm-election-year window for Ross Stores begins on Jun 13, 2026, so the stock is less than a month away from a regime that has historically favored long exposure. Traders will be watching whether the current consolidation holds above key support zones or whether a deeper shakeout materializes before the window opens.
Second, earnings and guidance. With no near-term earnings date on the calendar, the next major update on traffic and margins will be critical for confirming whether the off-price tailwind that drove the March beat and higher sales outlook is still intact.[3][5] Any sign that same-store sales are slipping from the 3% to 4% guided range, or that promotional intensity is eroding margins, would challenge the bullish historical seasonality.
Third, macro and policy headlines. The historical pattern is built on midterm-election-year behavior, so traders should track how tariff debates, fiscal negotiations and inflation data shape consumer sentiment. If budget pressure stays elevated, the sector’s seasonal outlook could again skew positive as shoppers trade down into off-price formats.
Finally, price behavior inside the window will be the real test. In prior cycles, strong years often featured sizable intraperiod drawdowns before finishing higher, with maximum adverse moves as deep as -58.32% in the most volatile case. If Ross starts the window with a sharp dip that quickly finds buyers and then grinds higher, that would rhyme with the historical pattern. A clean break below recent lows that fails to recover, by contrast, would be an early sign that this midterm-year playbook may be changing.
Sources
- [1] Reuters, "Ross Stores lifts annual profit forecast on strong demand for discount goods," Nov 20, 2025.
- [2] Reuters, "Ross Stores tops quarterly profit estimates as shoppers seek discount apparel," Aug 21, 2025.
- [3] Wall Street Journal, "Ross Stores Fourth-Quarter Sales Rise as Traffic Picks Up," Mar 3, 2026.
- [4] CNBC, "Stocks making the biggest moves premarket: Moderna, Ross Stores, Box, Gitlab and more," Mar 4, 2026.
- [5] Reuters, "Ross Stores forecasts annual sales above estimates," Mar 3, 2026.
About this seasonal analysis
Seasonal pattern data is sourced from TradeWave.ai, which analyzes historical price behavior across annual calendar windows going back up to 30 years. Read the full data methodology or the book The 100-Year Pattern by Afshin Moshrefi (2026 edition). Past performance of seasonal patterns does not guarantee future results. This article is for informational purposes only and does not constitute investment advice.