Illinois Tool Works (ITW) Has Dropped in 9 of 10 Midterm Windows, With Shorts Averaging 5.04%
Illinois Tool Works is hovering near $252 as it heads toward a 52-day midterm-election seasonal window that has historically favored downside for short sellers.

What is the seasonal pattern for Illinois Tool Works (ITW)?
Illinois Tool Works has fallen in 9 of 10 midterm-election-year windows starting around May 19, with an average 5.04% gain for winning short trades.
- 9 for 10 in this window, with short trades averaging 5.04% gains in winning years across the last 10 midterm election cycles.
- The 52-day Illinois Tool Works trading window begins May 19 and has historically favored the short side in midterm election years.
- Percent Profitable is 90%, with 9 winners and 1 loser for the short pattern in this specific May-to-summer stretch.
- Avg Profit - All, which includes the lone losing year, still comes in at 4%, pointing to a consistent downside seasonal bias.
- The TradeWave Ratio (TWR) of 1.91 suggests price has typically traveled meaningfully in the short direction during the window, while the Sharpe ratio of 1.26 reflects solid risk-adjusted results.
- Intraperiod swings have been sizable, with several years showing double-digit adverse moves before the short pattern ultimately paid off, underscoring the need to respect drawdown risk.
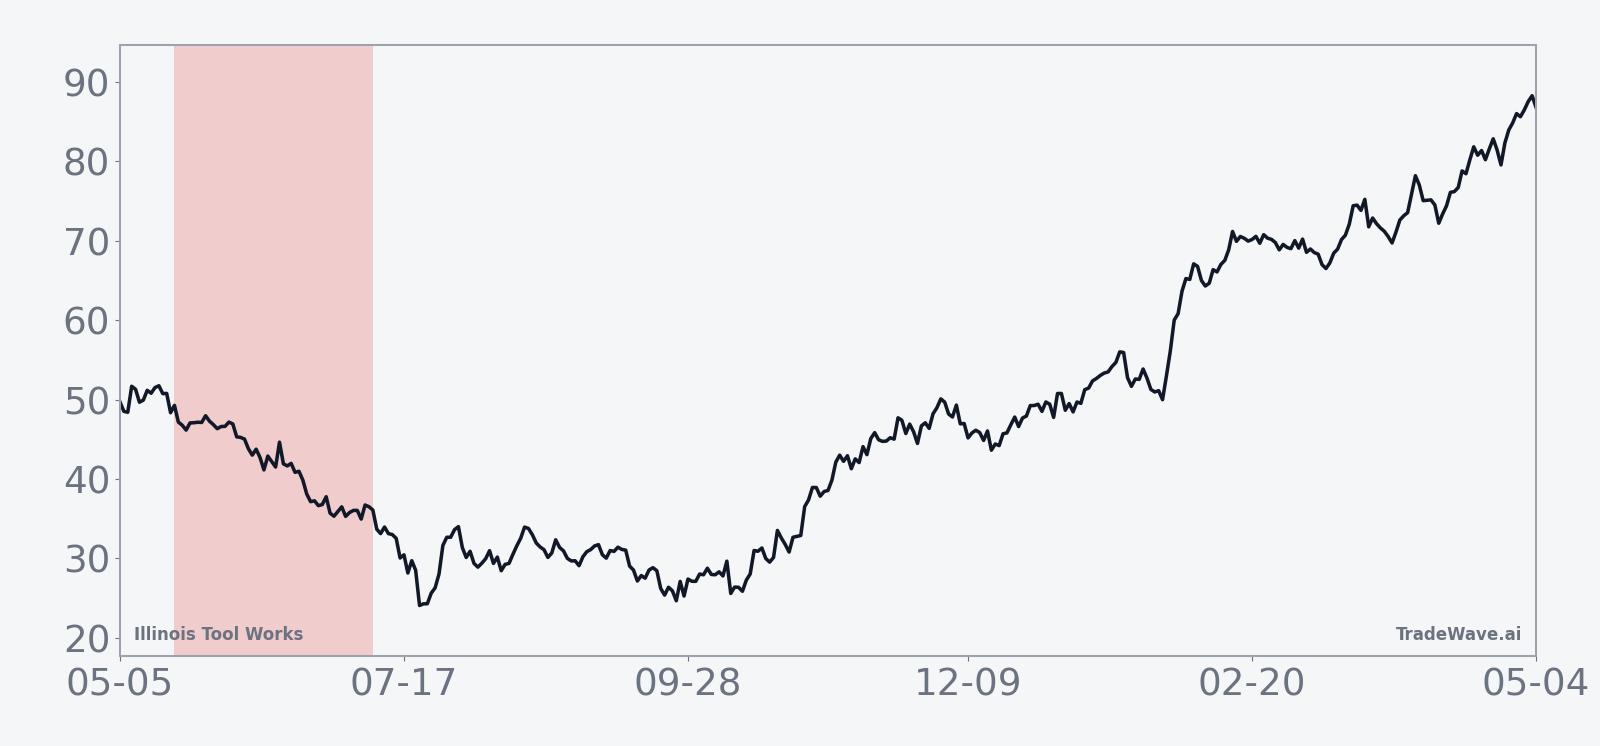
According to historical data from TradeWave.ai, this midterm-election slice of the calendar has behaved very differently from an average spring for Illinois Tool Works, and the next iteration is about to open.
How has Illinois Tool Works (ITW) traded in this midterm-year May–summer window?
Illinois Tool Works has delivered profitable short trades in 9 of the last 10 midterm-election-year windows starting around May 19, with an average 5.04% gain in winning years and a 4% average across all years. Shares last closed at $251.76, down 1.2% on the day and sitting about 16.9% below their 52-week high of $303.16.[1]
Because this pattern is grouped by the presidential election cycle, it reflects how ITW tends to behave in the midterm year, not just any random May. Midterm years often bring policy uncertainty, shifting fiscal priorities and sector rotation across industrials, which can change how investors treat economically sensitive names like Illinois Tool Works even when the broader market trend is intact.
The next chart stacks yearly net results with their best and worst intraperiod swings to show how far ITW has tended to move during this window.
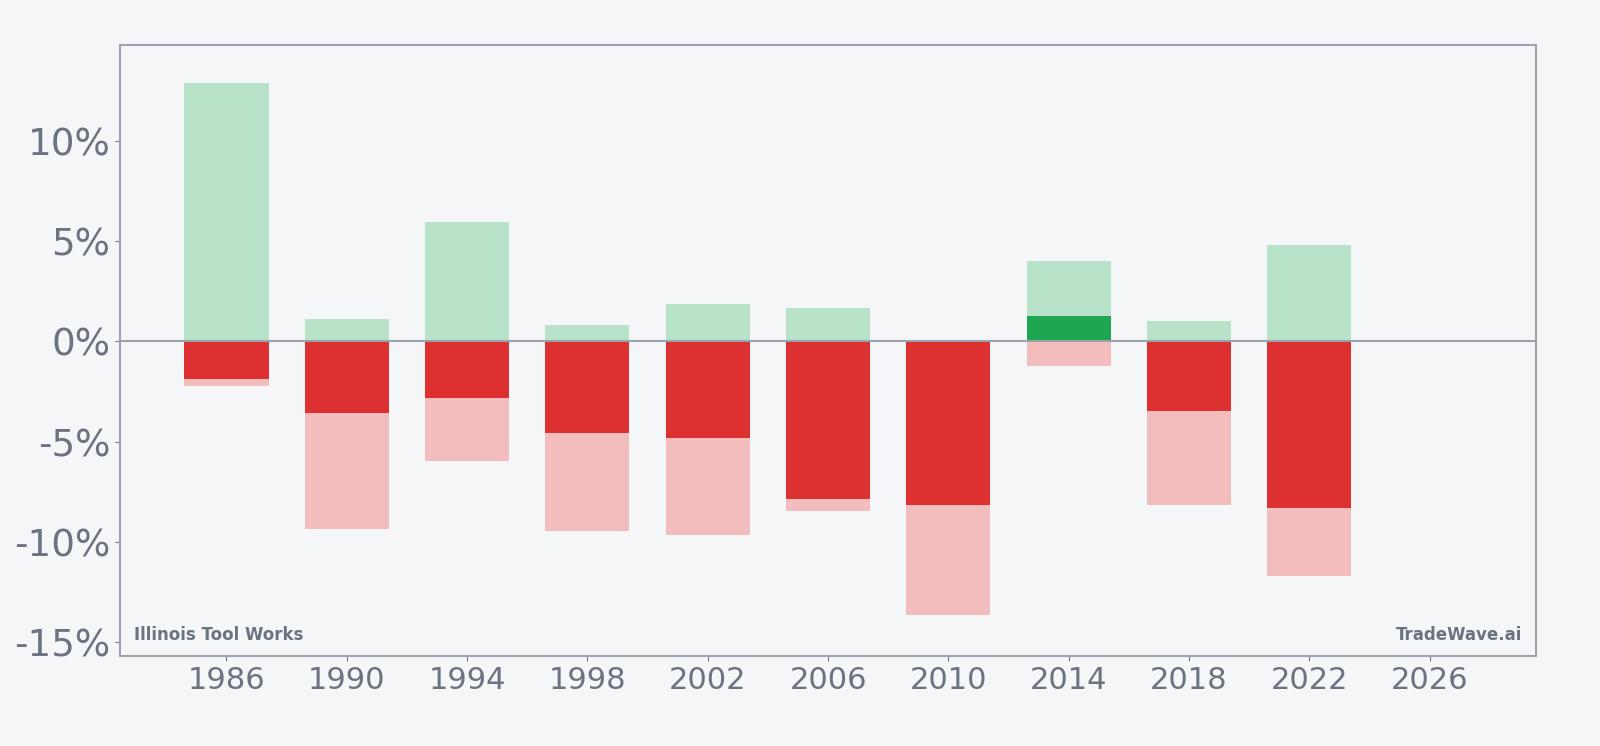
Across the last 10 midterm election years, the pattern has been clear: short exposure has worked far more often than it has failed. Percent Profitable sits at 90%, with 9 winning short years against just 1 losing year, and the all-years average outcome of 4% in favor of the short side shows that the lone miss did not erase the broader edge.
The strongest short-friendly years in this Illinois Tool Works seasonal trend came in 2010 and 2022, when the stock fell 8.13% and 8.28% respectively over the window, even as intraperiod swings were large in both directions. In 2010, the worst drawdown from the short entry reached 13.65% before the trade finished solidly in the money, while in 2022 the best move in favor of the short reached 4.79% and the worst move against it hit 11.69%, illustrating how choppy midterm-year price action can be.
The one losing year for the short pattern was 2014, when ITW rose 1.27% over the window despite a 4.0% maximum favorable move for shorts early in the period. That year shows how a short setup can start well, with price moving in the trade direction, then reverse and finish slightly higher by the end of the 52 days.
Looking across all 10 years, the maximum favorable move within the window has ranged from modest to double-digit, while maximum adverse excursions have often been larger, especially in 1990, 1998, 2002, 2006, 2010 and 2022 where intraperiod drawdowns for shorts ran between roughly 8% and nearly 14%. That mix of sizable best-case and worst-case swings fits a high-variance industrial stock pattern analysis in a politically noisy midterm year.
The cumulative return profile for this Illinois Tool Works seasonal pattern, which sums the average path across all midterm years, slopes steadily in favor of the short side rather than relying on one or two outlier crashes. Add it up: a 53% cumulative gain for the short pattern across the 10-sample history, paired with an annualized return of 4.37%, shows that this is not just a one-off anomaly but a recurring midterm-year tendency.
History does not guarantee future results, and the intraperiod downside for shorts has at times been large even in winning years, so traders using this Illinois Tool Works seasonal trend need to respect the potential for sharp squeezes against the trade.
Why does Illinois Tool Works (ITW) follow this seasonal pattern?
This midterm-year May–summer pattern for Illinois Tool Works may reflect a mix of earnings timing, industrial sector rotation and policy uncertainty that tends to peak in the middle of the presidential cycle. One likely driver is that institutional investors often rebalance exposure to economically sensitive industrials around midyear as they digest first-half earnings and adjust to shifting fiscal and regulatory signals. In midterm election years, that repositioning can skew more defensive, leaving stocks like ITW vulnerable to profit-taking and short pressure during this specific 52-day window.
What is driving Illinois Tool Works (ITW) today?
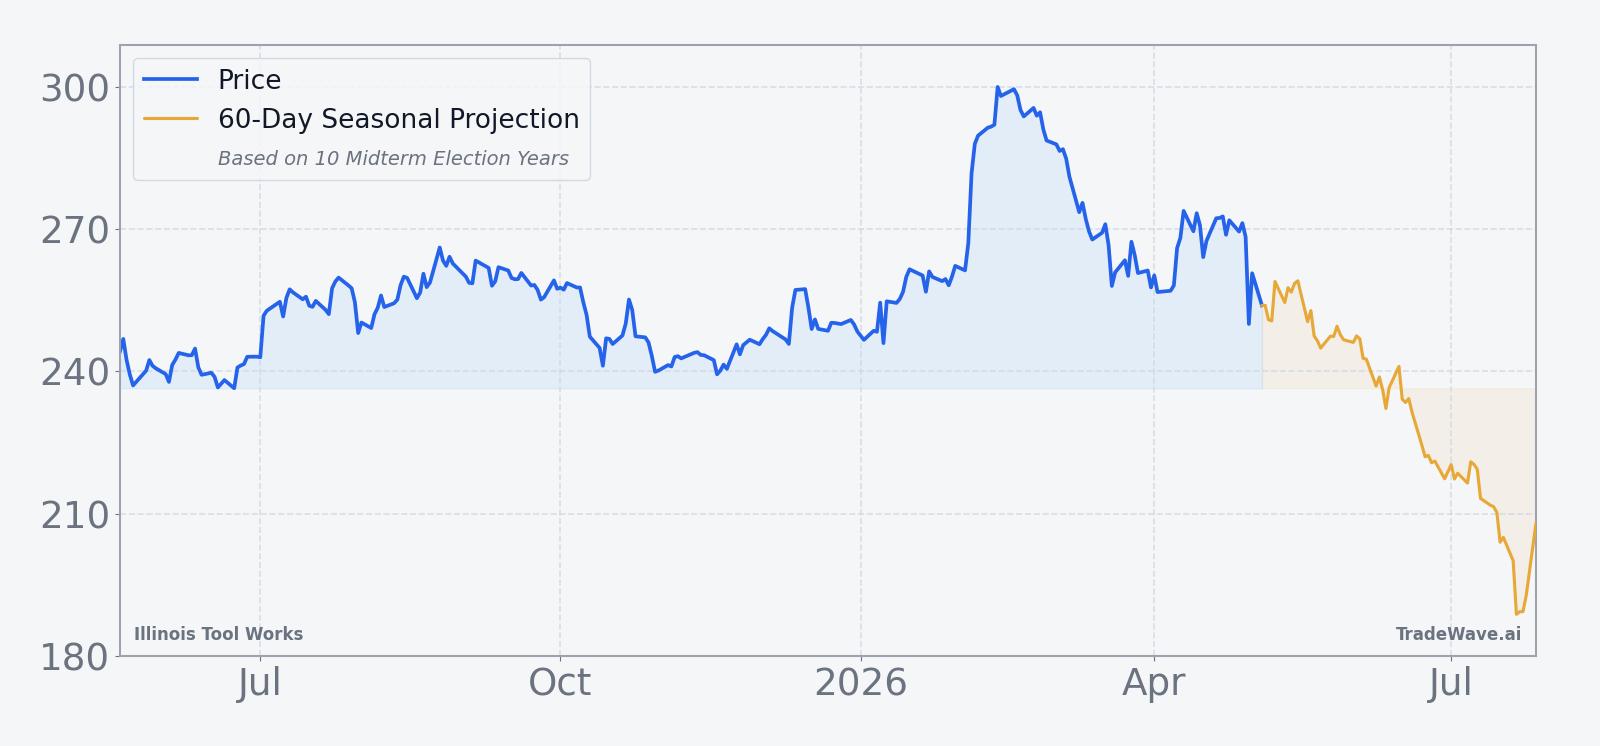
Illinois Tool Works last changed hands at $251.76, down 1.2% on the session, with the stock roughly 16.9% below its 52-week high of $303.16 and still comfortably above its 52-week low near $228.[1] Volume of about 787,000 shares on the latest close ran below the 20-day average of roughly 1.07 million, suggesting the pullback came in relatively calm trading rather than a rush for the exits.[1]
The chart below situates the latest move in its recent multi-month context alongside a 60-day seasonal projection.
What should traders watch as this Illinois Tool Works seasonal window opens?
With the 52-day Illinois Tool Works seasonal window set to begin on May 19, the first thing to watch is how the stock behaves if it rallies back toward its 50-day moving average around $270, a level that has recently acted as a reference point for trend followers.[1] A failure to reclaim that band as the window opens would be consistent with the historical short-friendly pattern, while a decisive break above it would look more like the rare 2014-style miss for the seasonal short.
Second, monitor how ITW trades around any macro or policy headlines that hit during the heart of the midterm year. Historically, the worst drawdowns for shorts in this window have clustered around sharp relief rallies when investors briefly lean back into cyclicals before rotating away again, so sudden upside spikes can be part of the pattern rather than a clean invalidation.
Finally, watch intraday volatility and range expansion once the window is underway. In several past midterm years, the maximum adverse move against shorts reached double digits even though the trades ultimately finished profitable, which means that a historically “good” seasonal window for the short side has still involved uncomfortable squeezes along the way. If this year’s tape shows the same mix of choppy rallies and heavier late-window selling, it would fit the established Illinois Tool Works seasonal trend; a smooth grind higher through the full 52 days would mark a clear break from the last 10 cycles.
Sources
- [1] Illinois Tool Works (ITW) daily quote and 52-week range, EODHD, as of May 12, 2026. eodhd.com
About this seasonal analysis
Seasonal pattern data is sourced from TradeWave.ai, which analyzes historical price behavior across annual calendar windows going back up to 30 years. Read the full data methodology or the book The 100-Year Pattern by Afshin Moshrefi (2026 edition). Past performance of seasonal patterns does not guarantee future results. This article is for informational purposes only and does not constitute investment advice.