Deere & Company (DE) Faces $1.2B Tariff Hit Just as a Weak 36-Day Spring Window Opens
Deere & Company is heading into a historically weak 36-day midterm-year window just as the stock trades near record highs after a powerful year-to-date run.
What is the seasonal pattern for Deere & Company (DE)?
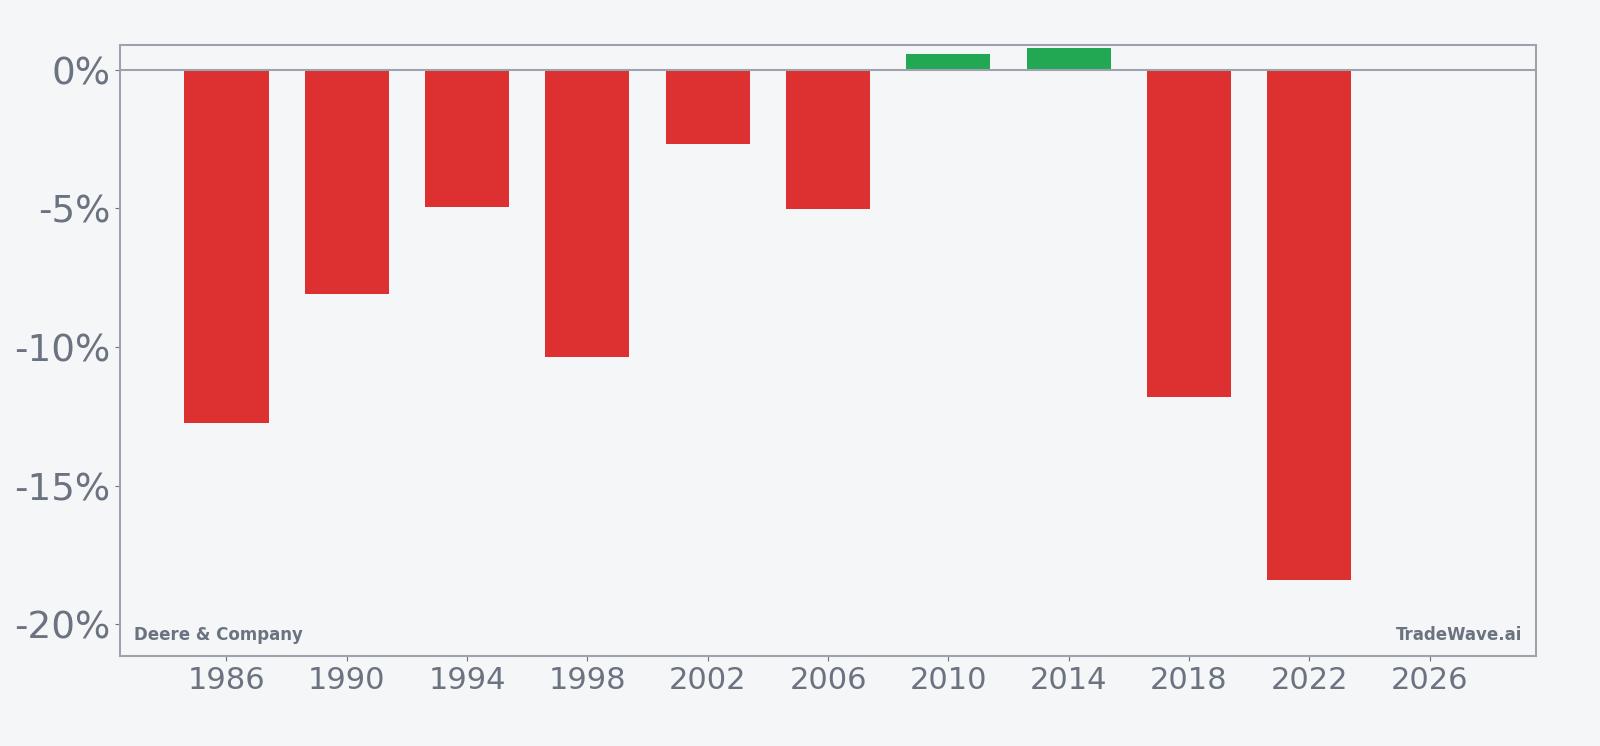
Deere & Company has fallen in 8 of 10 midterm-year spring windows during this 36-day pattern, with an average gain of 9.25% in winning years for the short side.
- 8 for 10 in this window, with the short side averaging 9.25% gains in winning years.
- The 36-day midterm-year window begins on May 19 and has historically favored downside moves in Deere & Company.
- Percent Profitable is 80%, with 8 winners and 2 losers for the short-direction setup.
- Across all years, including losers, Avg Profit - All is 7%, pointing to a consistent bearish seasonal bias.
- Maximum adverse moves have reached nearly 19% in some years, showing that intraperiod drawdowns can be sharp even when the pattern works.
- A TradeWave Ratio of 2.24 and a Sharpe ratio of 1.11 signal a historically efficient short window compared with typical noise.
According to historical data from TradeWave.ai, this upcoming stretch has behaved very differently from an average month on the calendar for Deere & Company, and the next iteration is only days away.
How has Deere & Company (DE) traded in this midterm-year spring window?
Deere & Company has fallen in 8 of the last 10 midterm election years during this 36-day window, with the short side posting an average profit of 9.25%. The next iteration starts on May 19, with the stock last changing hands at about $581 and sitting roughly 13.3% below its 52-week high of $670.26.[3] That combination of a stretched price and a historically short-friendly window is the kind of setup traders watch closely when a strong trend meets a recurring seasonal air pocket.
Because this pattern is grouped by the presidential election cycle, it reflects how Deere has behaved in the last 10 midterm election years rather than in 10 consecutive calendar years. Midterm years often bring policy uncertainty around tariffs, spending and regulation, which can hit capital-goods names like Deere differently from the broader market and create repeatable pockets of weakness.
Across those 10 midterm-year samples, the short direction has been profitable 80% of the time, with 8 winners and 2 losers. In winning years, the average gain for shorts has been 9.25%, while including all years brings the average to 7%, which means the losing years have not fully offset the downside stretches. The median outcome of 6.54% and a cumulative return of 98% for the pattern underline how often this specific Deere & Company trading window has leaned bearish.
The per-year table shows some standout episodes. In 2022, shorts captured an 18.41% net move as Deere slid from an entry around $345.25 to an exit near $281.71, with the worst intraperiod drawdown from entry, or maximum adverse excursion, at 18.93%. At the other end of the spectrum, 2014 was a mild losing year for shorts, with a 0.79% net gain for longs and a relatively shallow 1.56% worst drawdown against the short position.
Intraperiod swings have been meaningful. Maximum favorable excursions, the best point-to-peak moves in the trade direction, have often run in the low- to mid-single digits, but the worst drawdowns have been larger. Years like 1998 and 2018 saw net returns of -10.35% and -11.8% respectively for longs, with worst adverse excursions for shorts of 14.33% and 12.43%, showing that when Deere breaks in this window, it can move quickly and extend beyond the final close.
The historical seasonal average suggests that weakness often builds gradually rather than in a single shock. The typical pattern shows Deere drifting lower through the middle of the window, with the bulk of the short-side gains accruing after the first week and before the final few days, when bounces have been more common.
A stacked view of net returns alongside peak favorable and worst adverse moves helps frame both opportunity and risk.
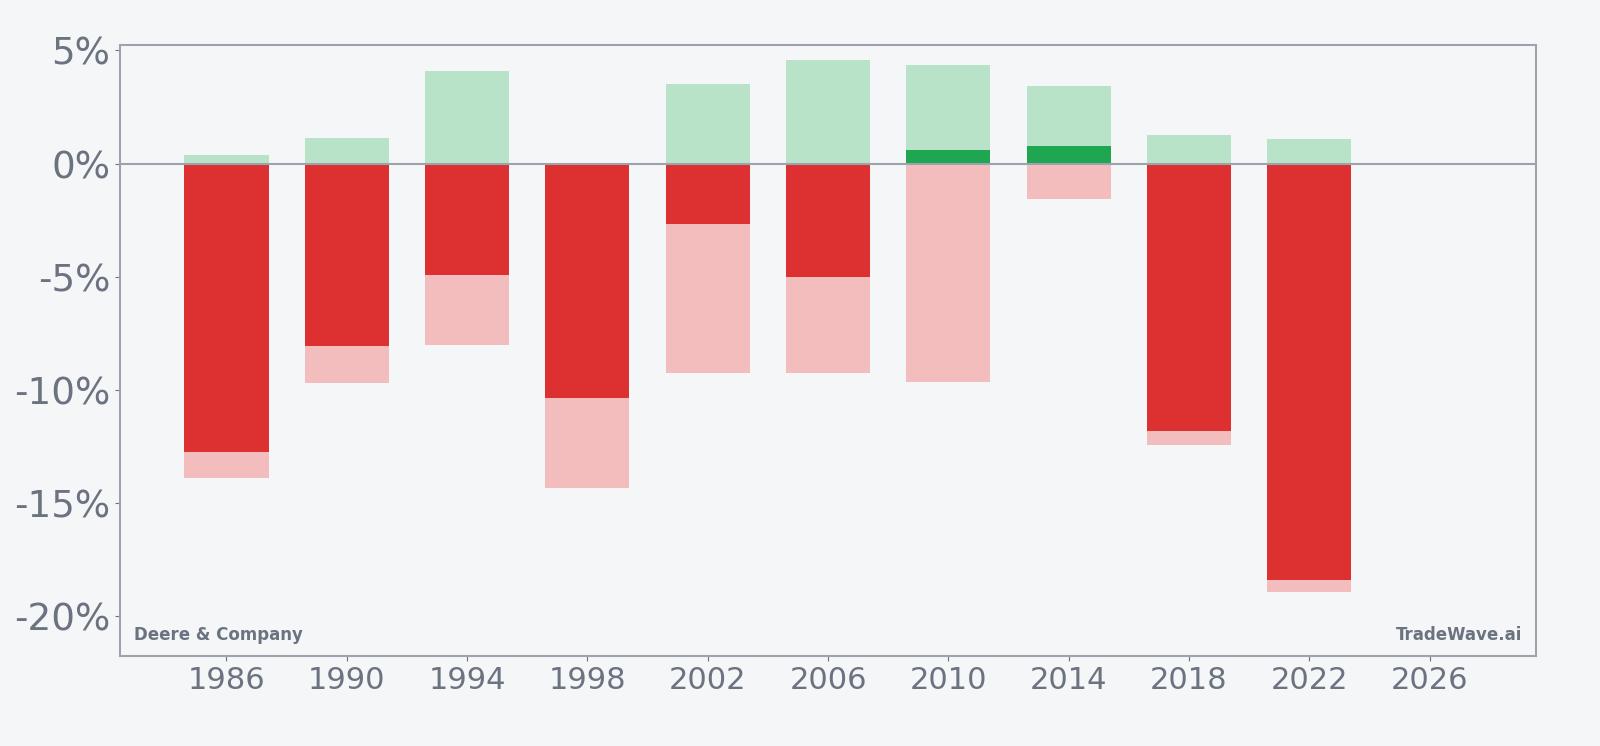
Viewed together, the net, maximum favorable and maximum adverse moves show a window that has historically rewarded short exposure but with sizable swings along the way. Add it up: 8 of 10 years have delivered profits for the short side, and the cumulative record across those midterm cycles is hard to ignore.
Why does Deere & Company (DE) follow this seasonal pattern?
This midterm-year pattern may reflect a mix of policy and farm-economy timing. One likely driver is that midyear in midterm election cycles often coincides with tariff headlines, budget debates and shifting expectations for agricultural subsidies, all of which can weigh on big-ticket equipment orders. Analysts have also pointed to institutional portfolio rebalancing around Deere’s fiscal calendar and the crop cycle, which can cluster profit-taking or de-risking in the late-spring period captured by this window.
History does not guarantee future results; adverse excursions (MAE) can be large even in winning windows.
What is driving Deere & Company (DE) today?
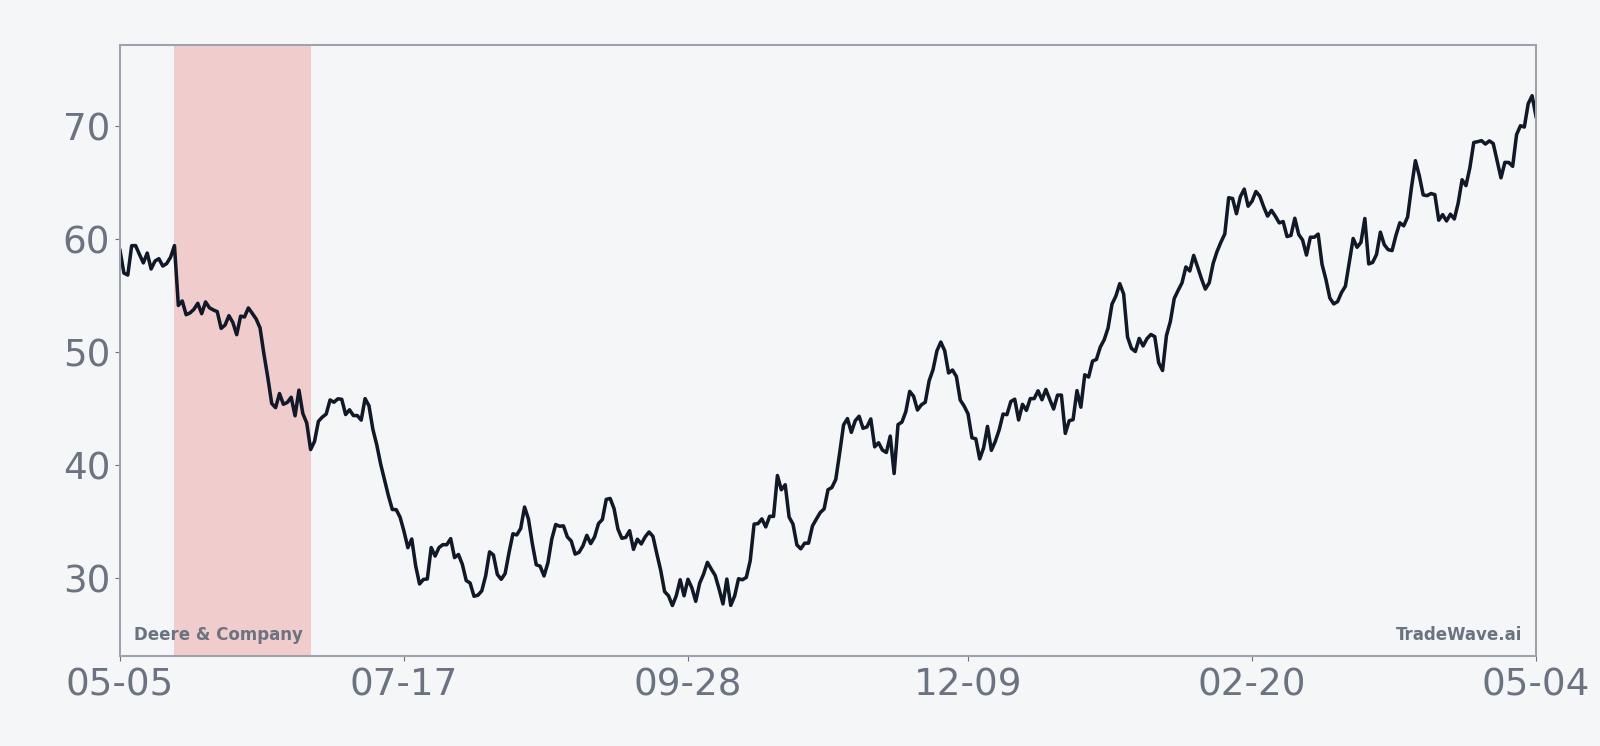
Deere shares closed at $581.41 on May 13, down 1.3% on the day, and are up about 38% year to date as the stock trades well above its 50-day moving average near $580.73 and sits roughly 36.0% above its 52-week low of $427.52.[3] That strength has come despite a tougher fundamental backdrop, including a $1.2 billion tariff hit expected for fiscal 2026 and signs of softer farm-equipment demand in prior quarters.[4][6] In February, Deere reported fiscal first-quarter net income of $656 million on $9.61 billion in revenue, a reminder that profitability remains solid even as tariffs and weaker farmer spending pressure margins.[1][6]
On the sell-side, views are split. Jefferies downgraded Deere to Hold in late February with a $550 price target, flagging valuation concerns after the stock’s rebound, while Morgan Stanley has maintained an Overweight stance with a higher target of $730 based on long-term precision-agriculture tailwinds.[1][3] The blended consensus target around $640 from those two firms sits modestly above the current price, suggesting analysts see upside but with less room for error after the recent run.[1][3]
Ownership flows have also been active this spring. On Apr 30, 2026, MarketBeat reported that Concurrent Investment Advisors LLC bought 6,507 shares of Deere & Company, adding to institutional interest in the name.[7] A week earlier, Klingman & Associates LLC disclosed that it had decreased its position, underscoring that not all professional investors are leaning the same way at these levels.[8] In the background, agriculture-equipment peers continue to wrestle with weak farmer spending and low commodity prices, even as Deere benefits from its market leadership and technology investments in precision agriculture.[3]
The chart below situates the latest move in its recent multi-month context and overlays the upcoming seasonal projection.
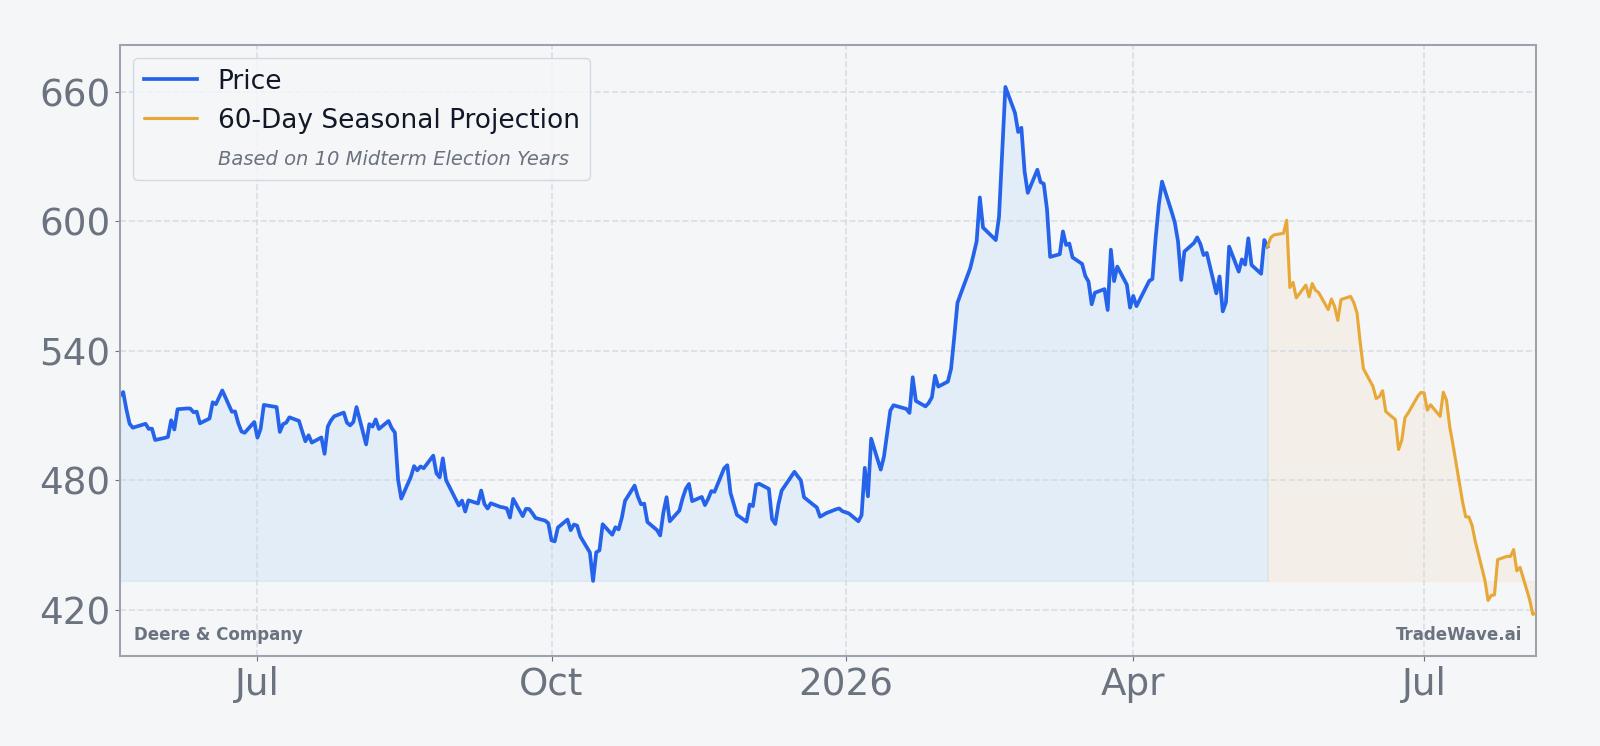
What should traders watch as this Deere & Company (DE) window opens?
With the 36-day window starting May 19, the first thing to watch is whether Deere’s price action respects or defies the historical pattern. A failure to hold the recent highs and a drift back toward the 50-day moving average would be consistent with prior midterm-year behavior, while a clean breakout toward the $640 analyst consensus zone would mark a clear departure from the usual script.[1][3]
Macro and policy headlines will matter as well. Any fresh developments on U.S. tariffs, farm subsidies or broader fiscal policy could quickly change sentiment for capital-intensive agriculture equipment, especially given Deere’s prior warnings that tariffs could cost more than $1.2 billion and have already squeezed margins in past quarters.[4][6] Traders should also keep an eye on sector data points around farmer spending and crop prices, since renewed weakness there has historically coincided with softer order books for Deere and its peers.[3]
Finally, institutional positioning bears watching. Additional filings that show whether recent buyers like Concurrent Investment Advisors are adding or trimming, and whether other large holders follow Klingman & Associates in taking profits, will help confirm whether the strong year-to-date rally is attracting fresh capital or simply rotating between hands at elevated levels.[7][8] If selling pressure builds into the window and price starts to roll over from near-record territory, that would line up with the historical seasonality; if instead demand absorbs every dip, it would signal that this midterm-year pattern is facing a tougher test than usual.
Sources
- Finviz – Deere (DE)'s Precision Agriculture is Quite a Story, Says Jim Cramer (Feb 25, 2026)
- Finviz – DE Gains 33% in a Year: What's the Right Strategy for Investors Now? (Mar 5, 2026)
- Reuters – Deere warns of bigger tariff hit after quarterly profit declines (Aug 14, 2025)
- MarketWatch – Deere’s outlook disappoints, as it means the agriculture sector hasn’t bottomed yet (Nov 26, 2025)
- Reuters – Deere's quarterly profit falls as US tariffs bite farm equipment margins (Aug 14, 2025)
- MarketBeat – Concurrent Investment Advisors LLC Buys 6,507 Shares of Deere & Company (Apr 30, 2026)
- MarketBeat – Klingman & Associates LLC Decreases Position in Deere & Company (Apr 23, 2026)
About this seasonal analysis
Seasonal pattern data is sourced from TradeWave.ai, which analyzes historical price behavior across annual calendar windows going back up to 30 years. Read the full data methodology or the book The 100-Year Pattern by Afshin Moshrefi (2026 edition). Past performance of seasonal patterns does not guarantee future results. This article is for informational purposes only and does not constitute investment advice.