10-for-10 Midterm May Run: General Mills (GIS) Enters 16-Day Window With 3.54% Avg Gains
General Mills is approaching a 16-day midterm-year May seasonal window that has never been negative in the past decade of cycles, just as the stock trades near its 52-week low after a profit slump.
What is the seasonal pattern for General Mills (GIS)?
General Mills has risen in 10 of 10 midterm-year May windows during this 16-day stretch, with an average gain of 3.54% in winning years.
- 10 for 10 in this window, averaging 3.54% gains in winning years across the last 10 midterm election cycles.
- The upcoming 16-day General Mills trading window starts May 20 and has a 100% Percent Profitable record with 10 winners and 0 losers.
- Average winner gains of 3.54% stack up to a 41% cumulative return across all ten historical windows.
- The TradeWave Ratio (TWR) of 2.52 signals that price has typically traveled meaningfully in the long direction within the window, not just at the close.
- A Sharpe ratio of 1.72 for this pattern points to unusually strong risk‑adjusted returns compared with typical short windows.
- Intraperiod swings have included adverse moves as deep as about 2.24% in some years, so even a “10 for 10” pattern has not been a straight line.
According to historical data from TradeWave.ai, this midterm-year May stretch has behaved very differently from an average month for General Mills. The next section walks through how that election-cycle pattern has played out in prior decades and what it means for the approaching window.
How has General Mills (GIS) traded in this midterm-year May window?
General Mills has posted gains in every single one of the last 10 midterm election years during this 16-day window starting May 20, averaging a 3.54% rise. Shares finished Thursday at 33.25, down 1.1% on the day and sitting about 35.1% below their 52-week high of 51.25 while hovering just above the 52-week low of 33.58.[4]
Because this pattern is grouped by the presidential election cycle, it only looks at midterm election years, which tend to feature tighter fiscal policy debates and more volatile consumer sentiment. For a defensive consumer staple like General Mills, that backdrop has historically lined up with a modest but consistent bid in this late-May slice as investors rotate toward perceived earnings stability.
The trade direction for this window is explicitly long, and the track record is unusually clean: 10 winners, 0 losers, and a 41% cumulative gain across all ten midterm-year iterations. Average gains of 3.54% per window sit alongside a median profit of 3.32%, which tells you the typical outcome has been close to the average rather than skewed by one giant outlier year.
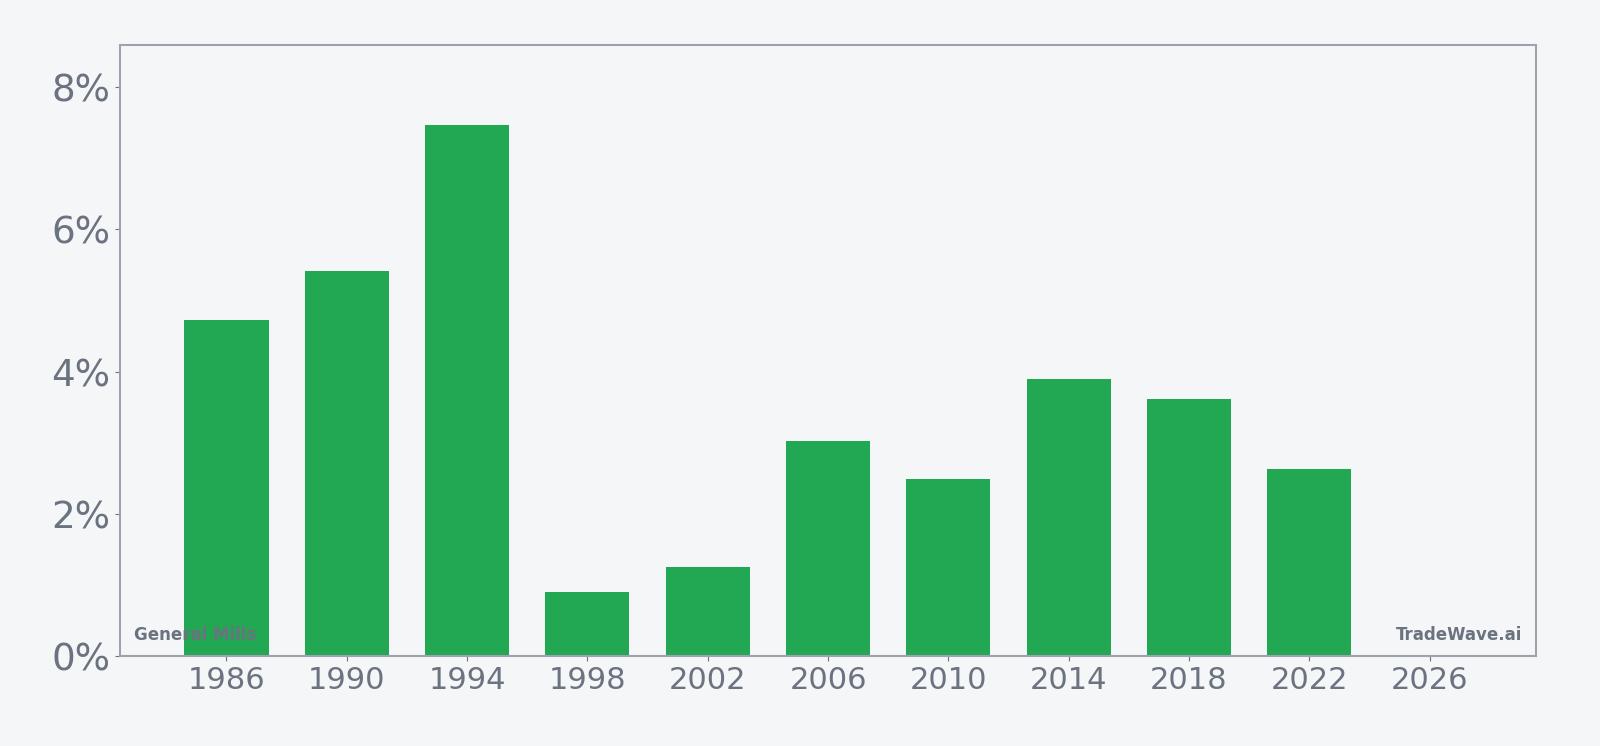
Looking at individual years, the strongest performance came in 1994, when General Mills rallied 7.47% during the window, with a best intraperiod move of 9.64% from the entry price before giving back a bit into the close. The softest outcome was 1998, which still finished up 0.91% but saw a maximum adverse move of about 1.72% at one point, a reminder that even “all green” windows can feel uncomfortable in real time.
The historical seasonal average trend for this window slopes steadily higher rather than spiking on a single day, suggesting gains have tended to accrue gradually across the 16 sessions. In several years, the maximum favorable move arrived in the back half of the window, which fits a pattern of investors adding to consumer staples exposure as midyear macro and policy headlines heat up.
A combined view of net returns and intraperiod swings shows how upside and drawdowns have coexisted in this pattern.
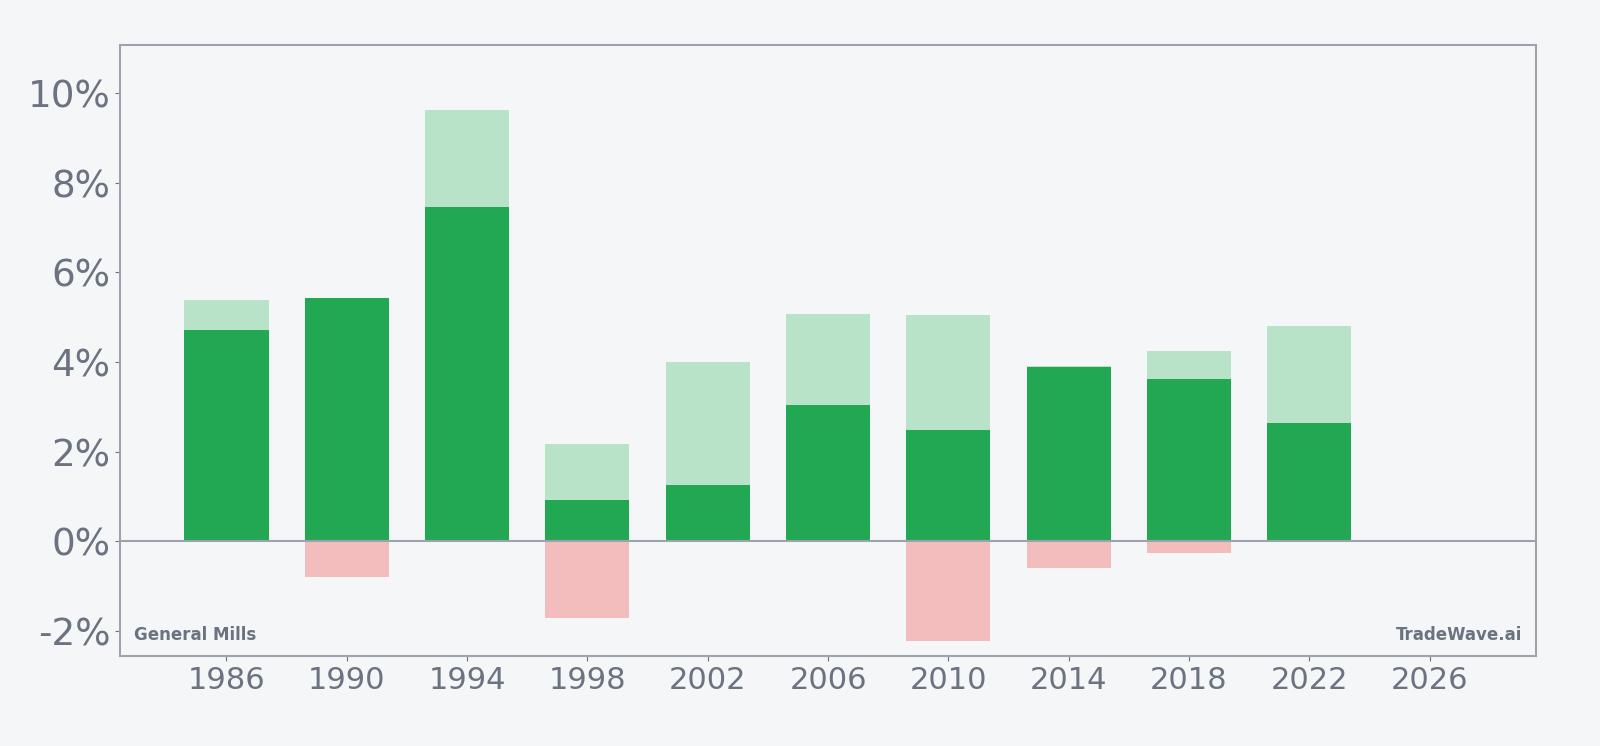
The stacked net, maximum favorable move and maximum adverse move bars show that while upside excursions have often reached 4% to 5% within the window, downside swings of around 1% to 2% have also been common before the trade finished higher. That mix of steady net gains, a TradeWave Ratio of 2.52 and a Sharpe ratio of 1.72 makes this one of the cleaner short seasonal windows in the consumer staples space, but not a risk-free one.
History does not guarantee future results; adverse excursions can still be meaningful even in windows that have been profitable in every prior year.
Why does General Mills (GIS) follow this seasonal pattern?
One likely driver is the way midterm election years concentrate policy uncertainty and rate debates into the late spring and early summer, which has often pushed investors toward defensive, dividend-paying names like packaged food stocks. This 16-day May window also tends to fall between major earnings updates for General Mills, so the stock pattern analysis may be capturing a period when macro headlines dominate and staples benefit from relative safety flows. The historical seasonality could also reflect portfolio rebalancing as institutions adjust exposure ahead of the summer, trimming cyclicals and adding to consumer staples positions.
What is driving General Mills (GIS) today?
General Mills closed at 33.25 on Thursday, down 1.1% on the session and trading well below its 50-day moving average of 37.51, with the stock pinned near its 52-week low even as average 20-day volume sits around 7.45 million shares.[4] The pressure follows a difficult stretch for fundamentals: on Mar 18, 2026, the company reported fiscal third-quarter profit of $303.1 million, or 56 cents per share, down sharply from $625.6 million a year earlier as management tried to revive volumes and market share in a tougher consumer backdrop.[4]
In 2025, General Mills had already signaled that the turnaround would not be quick, guiding investors to expect full-year net sales between down 1% and up 1%, with adjusted earnings per share falling 10% to 15% in constant currency.[1] Earlier that year, the company leaned on price cuts across brands like Pillsbury and Progresso to support volumes, a strategy that helped move more product but weighed on revenue and profit growth as inflation squeezed household budgets and softened demand for some packaged foods.[1][2][3]
Macro conditions have not been especially friendly either. In 2025, Reuters reported that rising consumer prices and a cooling U.S. labor market were pressuring household budgets, contributing to softer demand for General Mills’ North America portfolio even as international and pet food segments provided some offset.[2] The company has tried to counter that pressure by emphasizing sustainability and brand strength, including recognition on TIME’s World’s Best Companies 2025 list in the Food & Beverage category, but investors have so far focused more on earnings compression than on long-term positioning.[5]
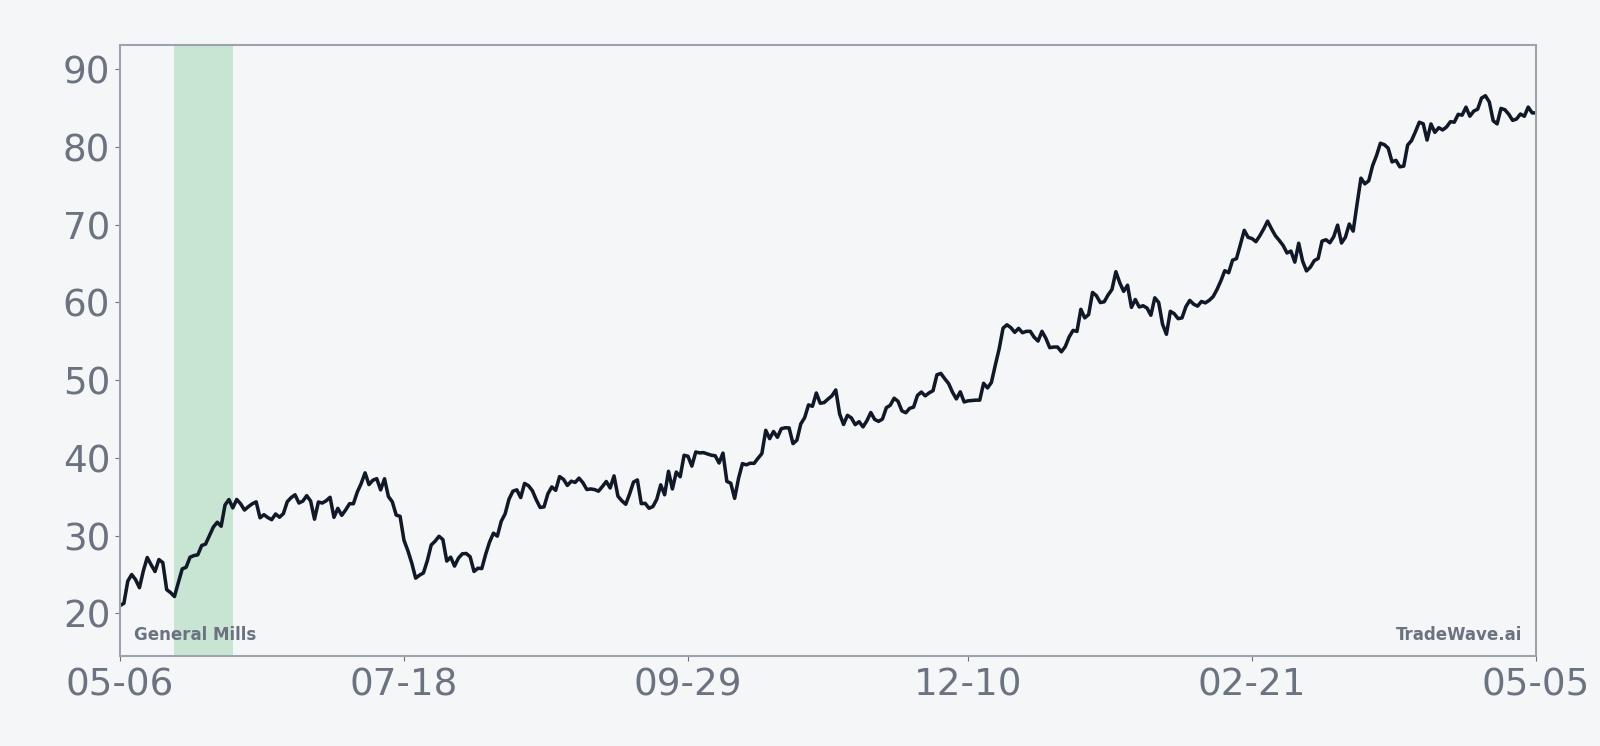
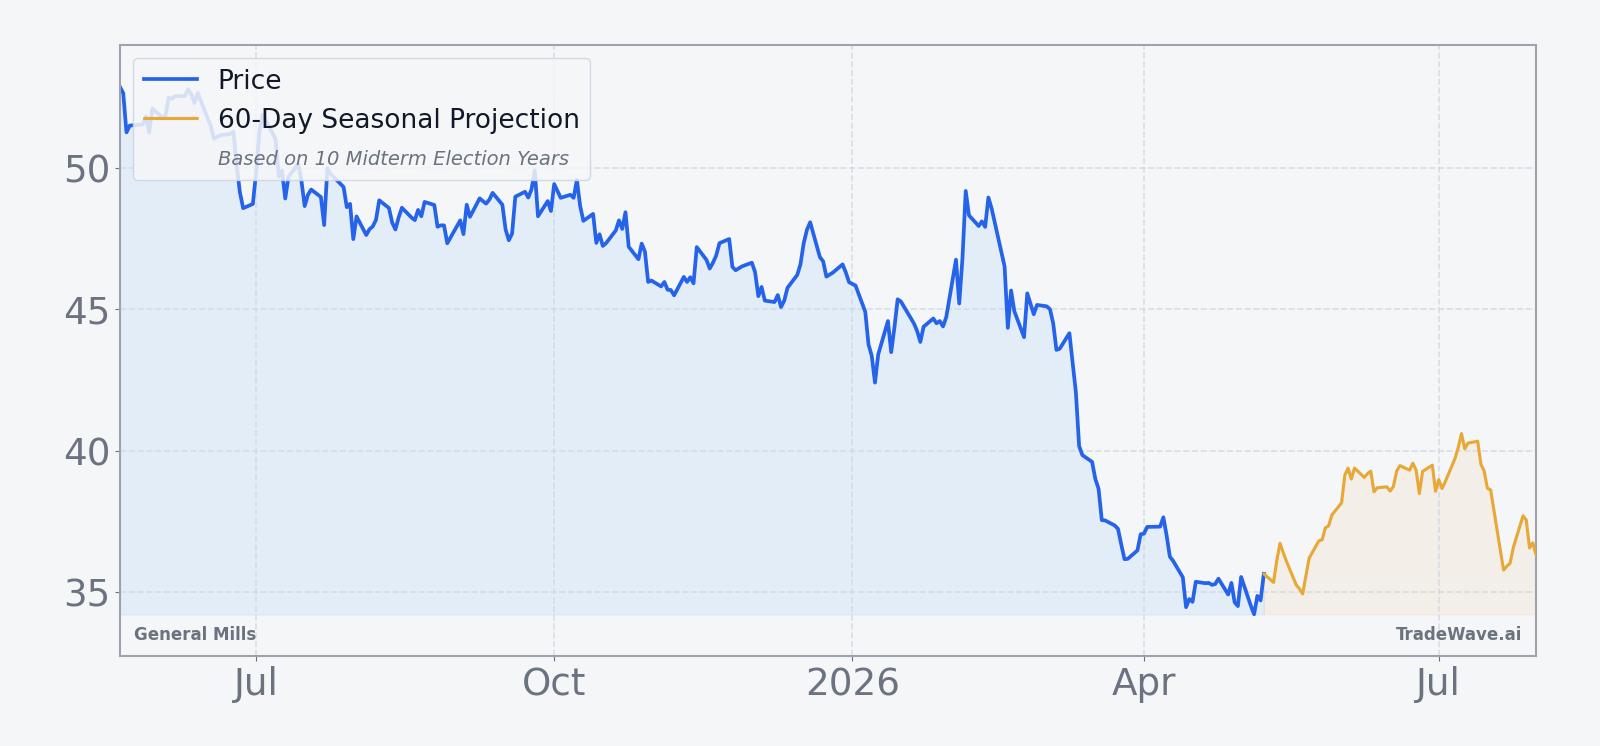
The chart below situates the latest move against the past year of trading and a 60-day seasonal projection.
What should traders watch as this General Mills seasonal window approaches?
First, the calendar: the 16-day window begins on May 20, so price action in the days just before the start will shape how much room there is for any typical seasonal bounce. If General Mills remains pinned near its 52-week low as the window opens, traders will be watching whether the stock can reclaim the 50-day moving average zone around 37.50 during or shortly after the pattern, which would mark a clear break from the recent downtrend.[4]
Second, fundamentals and macro headlines will matter for how closely this cycle tracks the historical GIS seasonal trend. Any updates on pricing strategy, volume recovery or cost pressures following the weak March quarter could either reinforce the defensive case for the stock or keep pressure on the turnaround narrative.[4] On the macro side, incoming data on inflation and the labor market will feed into expectations for consumer spending and rate policy, both of which tend to influence flows into or out of consumer staples.
Finally, behavior inside the window itself will be the real test of this 10-for-10 pattern. A move that quickly turns higher and holds gains with contained intraperiod drawdowns would be consistent with the historical seasonality. A failure to bounce, or a rally that is sold aggressively with deeper-than-usual adverse swings, would signal that the current earnings and macro backdrop are overpowering what has been a remarkably consistent midterm-year May tailwind for General Mills.
Sources
- [1] The Wall Street Journal, "General Mills Quarterly Profit Falls Amid Price Cuts," Dec 17, 2025.
- [2] Reuters, "General Mills keeps annual outlook as North America demand softens," Sep 17, 2025.
- [3] The Wall Street Journal, "General Mills Is Cutting Prices on Food, and It’s Paying Off," Dec 17, 2025.
- [4] The Wall Street Journal, "General Mills Posts Lower Profit, Sales Amid Turnaround," Mar 18, 2026.
- [5] General Mills, "General Mills Recognized on TIME’s World’s Best Companies 2025 List," Sep 10, 2025.
About this seasonal analysis
Seasonal pattern data is sourced from TradeWave.ai, which analyzes historical price behavior across annual calendar windows going back up to 30 years. Read the full data methodology or the book The 100-Year Pattern by Afshin Moshrefi (2026 edition). Past performance of seasonal patterns does not guarantee future results. This article is for informational purposes only and does not constitute investment advice.