Despite Soft Q4 Guidance, Nike, Inc. (NKE) Hits a Midterm Window That’s Never Lost
Nike, Inc. is limping into the heart of the midterm election year just as a 342-day seasonal window that has never produced a loss in the last nine midterm cycles opens again, putting a powerful historical tailwind against a bruised stock.

What is the seasonal pattern for Nike, Inc. (NKE)?
Nike, Inc. has risen in 9 of 9 midterm-election-year windows starting May 22 and lasting 342 days, with an average gain of 24.9% in winning years.
- 9 for 9 in this window, with Nike, Inc. averaging 24.9% gains across all winning midterm-election-year cycles.
- Seasonal window begins May 22 and runs 342 trading days, spanning the back half of the midterm year into the following pre-election year.
- Percent Profitable is 100%, with 9 winners and 0 losers in the historical sample.
- Median outcome is a 26.09% gain, pointing to a consistently strong upside skew rather than a single outlier year.
- TradeWave Ratio of 2.48 suggests price has typically traveled meaningfully in the long direction within the window, even before final results are booked.
- Sharpe ratio of 1.92 indicates unusually strong risk-adjusted returns for this Nike, Inc. trading window compared with typical single-stock seasonality.
According to historical data from TradeWave.ai, this midterm-election-year stretch has behaved very differently from an average calendar year for Nike, Inc., and the latest iteration of that pattern is now in play.
How strong is Nike, Inc. (NKE) in this midterm-year seasonal window?
Nike, Inc. has posted gains in every one of the last nine midterm-election-year windows that start on May 22 and run for 342 trading days, averaging a 24.9% advance with no losing cycles. The stock closed Friday at $44.32, up 0.3% on the day and sitting about 42.6% below its 52-week high of $77.28, a reminder of how far it has fallen into this historically favorable stretch. That combination of deep drawdown and a spotless seasonal record turns this window into a key test of whether Nike’s long-term pattern can reassert itself after a bruising reset.
Grouping the data by the presidential election cycle matters here because Nike’s demand, margins and investor positioning are tightly linked to consumer spending and policy tone, which often shift in predictable ways between the midterm election year and the year before the presidential election. This window captures that transition, starting in the mid part of the midterm year and running deep into the pre-election year, when risk appetite has often improved across U.S. equities.
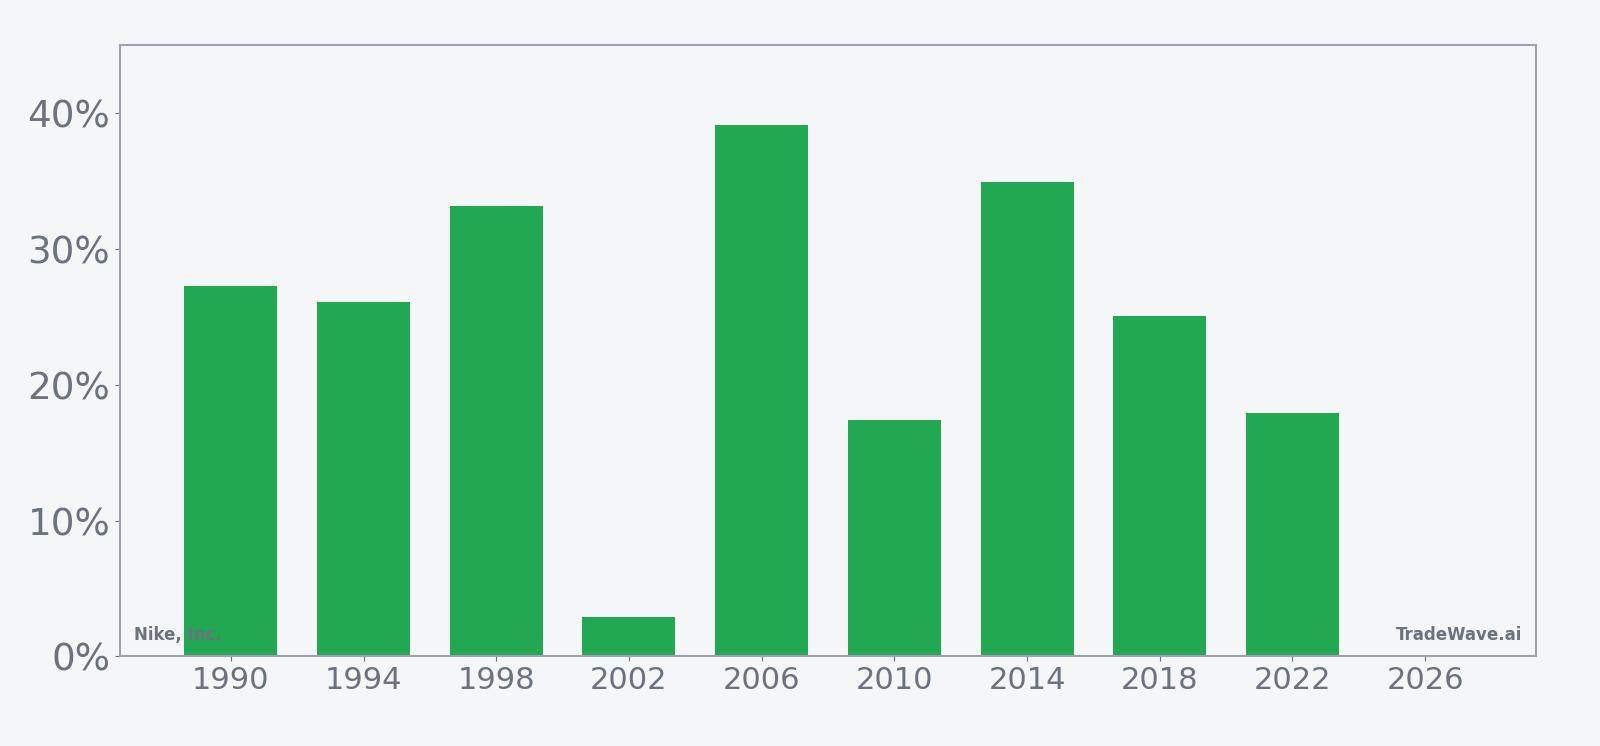
Across the nine midterm-election-year samples, Nike’s seasonal profile is unambiguously long. Percent Profitable is 100%, with 9 winners and 0 losers, and the median gain of 26.09% sits close to the 24.9% average, which means the record is built on repeated solid years rather than one or two blowout outliers. The weakest outcome in the set was a 2.89% gain in 2002, while stronger years such as 2006 and 2014 delivered net returns of 39.18% and 34.96% respectively, underscoring how often this window has lined up with powerful multi-quarter rallies in the stock.
The intraperiod path has not been a straight line. In 1990 and 1998, for example, Nike’s best point-to-peak moves within the window reached 45.23% and 37.98% respectively, but those same years also saw worst drawdowns from entry of -30.98% and -34.21%. Even in more moderate cycles like 2010 and 2018, maximum favorable excursions of 31.08% and 27.58% came alongside adverse swings of -6.66% and -5.93%. The pattern has rewarded patience on the long side, but it has also demanded a strong stomach for volatility along the way.
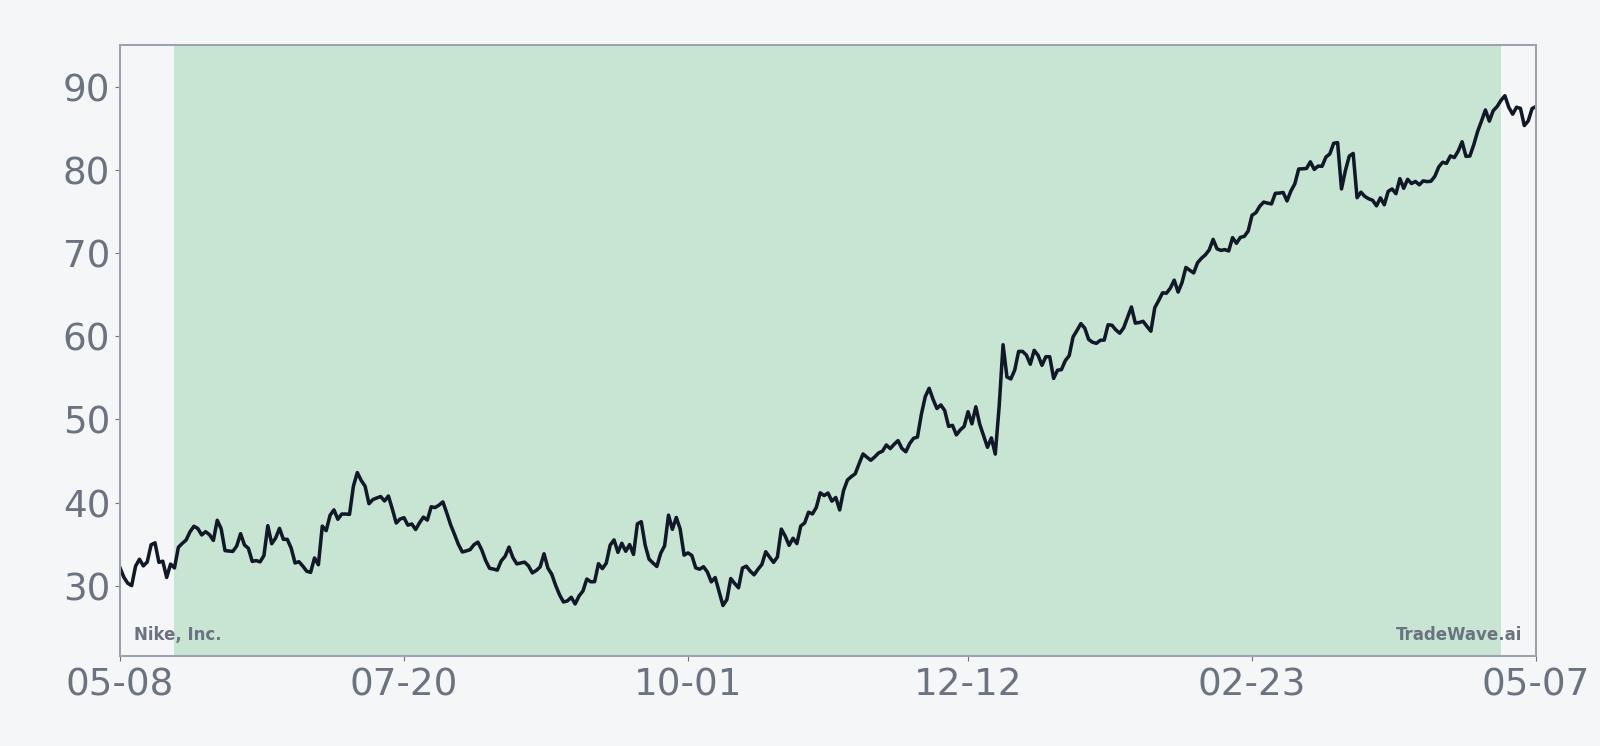
The historical seasonal average trend for this window shows gains building gradually rather than in a single burst. Early in the window, returns have often been choppy, reflecting the back half of the midterm year when macro and policy uncertainty can still be elevated. The curve tends to steepen as the calendar moves into the year before the presidential election, when broader equity markets have historically enjoyed a more supportive backdrop and Nike has often participated with outsized upside.
A closer look at yearly net results alongside peak run-ups and worst drawdowns shows how consistently the window has favored longs while still delivering sizable swings.
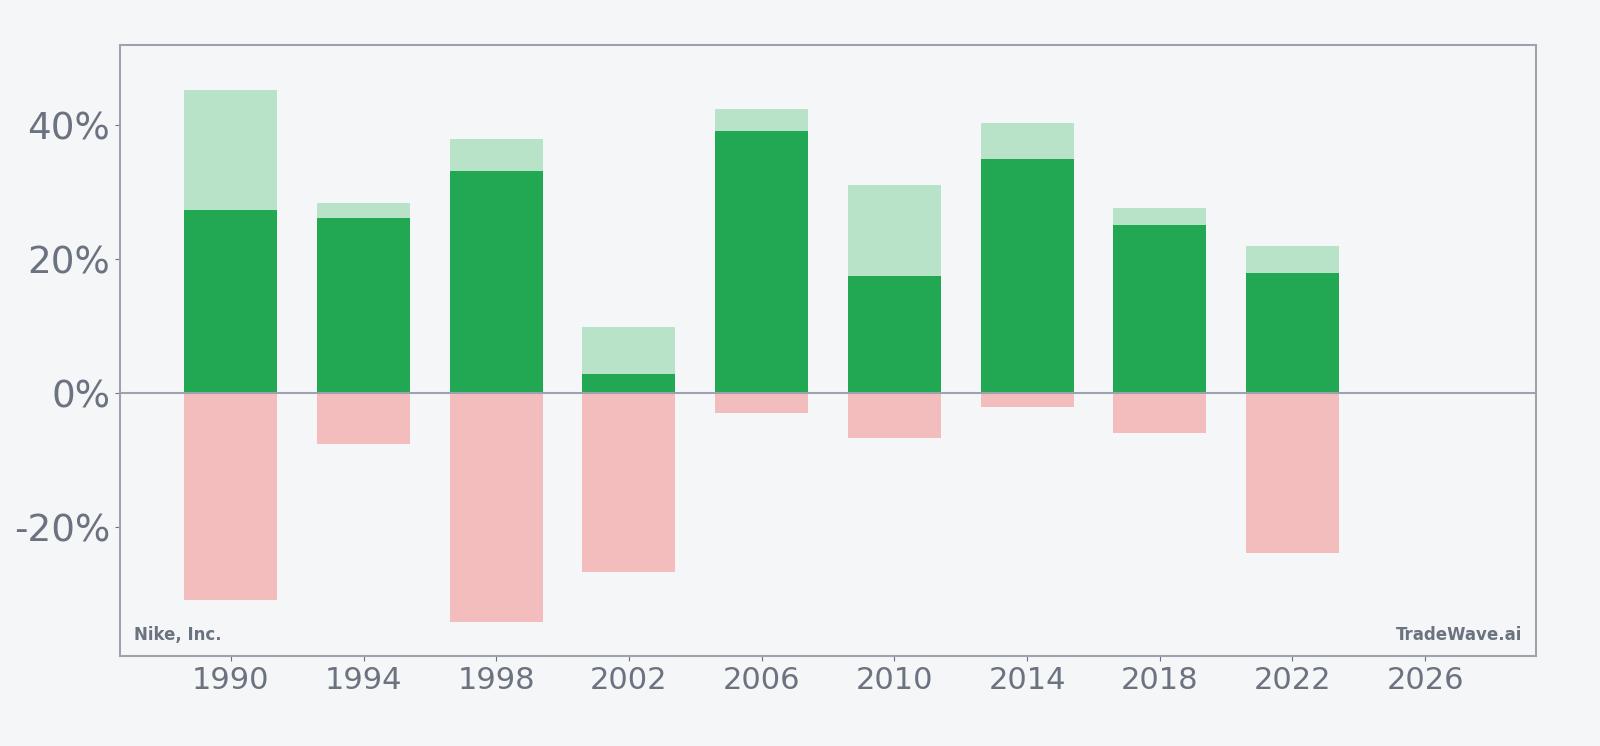
In the bar profile, every bar finishes above zero, but the maximum favorable and maximum adverse excursions stretch far beyond the final net in several years, highlighting a high-variance environment where both sharp rallies and deep pullbacks have been common before the window closes in the green. Years like 2002 and 2022 show that even modest final gains came with double-digit drawdowns at some point, while stronger cycles such as 2006 and 2014 combined large peak advances with relatively contained downside. The pattern is clear: this window has favored longs in 9 of 9 years, but it has rarely been a smooth ride.
History does not guarantee future results; adverse excursions can be large even in winning windows, and traders should treat this seasonal pattern as context rather than a forecast.
Why does Nike, Inc. (NKE) follow this seasonal pattern?
One likely driver is the way Nike’s earnings calendar and product cycle line up with the midterm-to-pre-election transition, with back-to-school, holiday and major sports events often clustering inside this 342-day stretch. Analysts have also pointed to institutional portfolio repositioning around the midterm year, followed by a risk-on tilt in the year before the presidential election, which can favor consumer and athletic apparel names. The pattern may also reflect how investors respond to guidance resets and margin pressures early in the midterm year, then gradually re-rate the stock as visibility improves into the pre-election period.
What is driving Nike, Inc. (NKE) today?
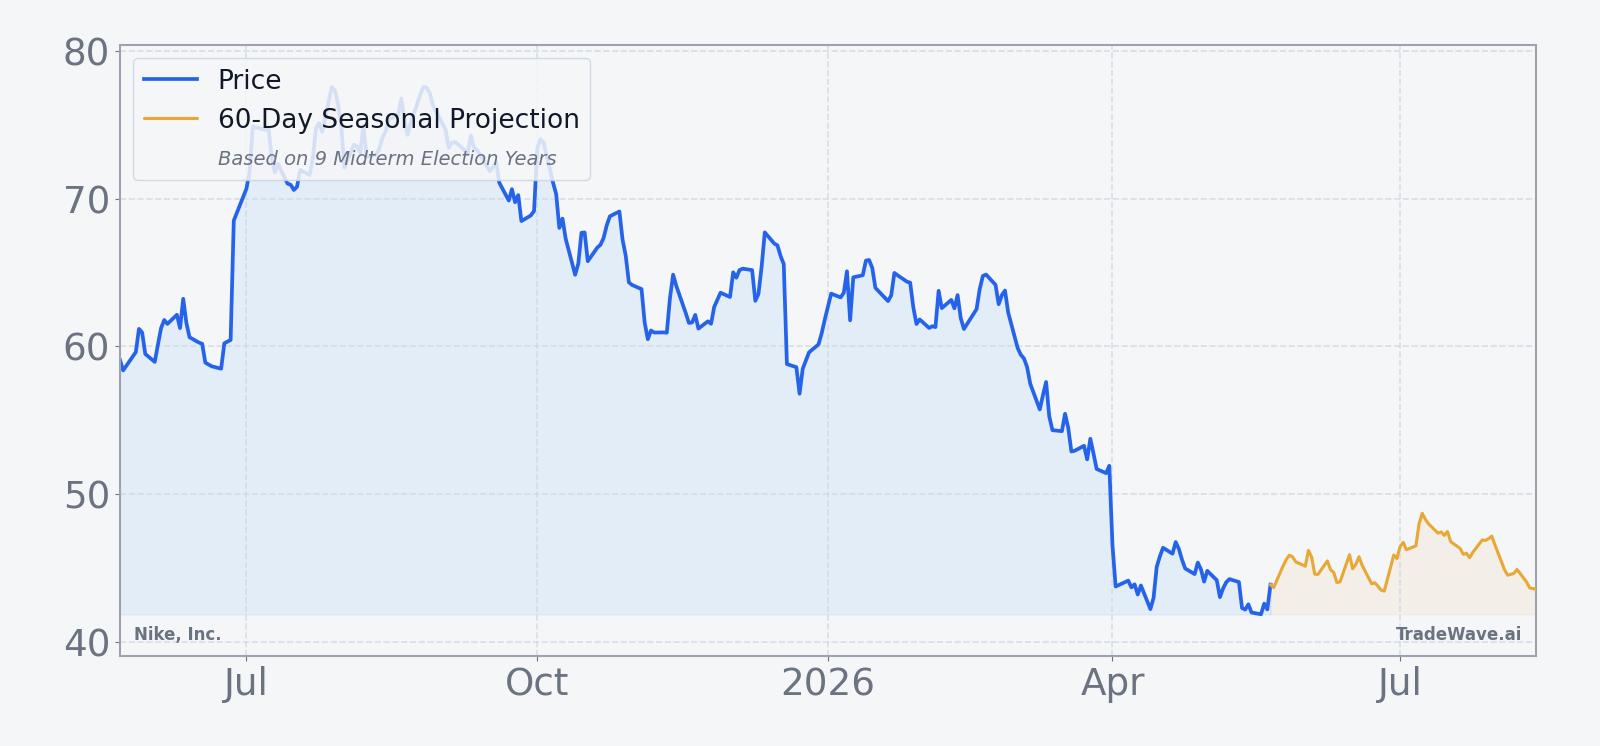
Nike shares finished Friday at $44.32, up 0.3% on the session, with the stock trading below its 50-day moving average of $46.56 and only modestly above its 52-week low of $41.35 on 14.1 million shares versus a 20-day average volume of about 18.9 million. The backdrop is still shaped by Nike’s March fiscal third-quarter report, where revenue and earnings per share beat expectations but management guided for a 2–4% revenue decline in the fourth quarter and flagged a mid-single-digit revenue reduction along with a 350–425 basis point gross margin hit tied to prior decisions, a combination that sent the stock down 9% after the call.[1] Tariff-related costs that are expected to shave roughly 100 basis points from gross margin and a “Win Now” strategy focused on sports, wholesale partners and new running footwear launches frame the fundamental debate as the seasonal window opens.[1][2]
The chart below situates the latest move against Nike’s past year of trading and a short-term seasonal projection.
How does the macro and policy backdrop shape this Nike, Inc. window?
The current midterm election year is unfolding against a policy backdrop that still features tariff overhangs and shifting trade priorities, both of which matter for a global brand that relies heavily on cross-border supply chains and international demand.[1] At the same time, Nike’s category is in the middle of an “athletic apparel turnaround” narrative, with management leaning into wholesale partners and marketing around core sports franchises to reignite growth after a period of inventory clean-up and softer Nike Direct trends.[2] As the calendar moves from the midterm year into the year before the presidential election, investors will be watching whether consumer spending, trade policy and sector rotation line up with the historical pattern that has so often favored Nike in this specific stretch of the cycle.
What should traders watch in this Nike, Inc. seasonal window?
Three things stand out for this 342-day Nike, Inc. trading window. First, price behavior relative to the 52-week low around $41.35 will be important: in prior midterm-year cycles, the stock has often tolerated sizable drawdowns early in the window before staging strong recoveries, so whether Nike can hold or reclaim key moving averages while respecting that floor will say a lot about how closely this iteration tracks history. Second, upcoming earnings updates and any revisions to the outlook for revenue, gross margin and the “Win Now” strategy will determine whether fundamentals start to move in the same direction as the historical seasonality, especially as the calendar rolls into the typically stronger pre-election year.[1][2] Third, traders should monitor how the broader consumer and tariff narrative evolves, since a meaningful easing or escalation in trade-related costs could either reinforce or blunt the historical tailwind that has made this one of Nike’s most reliable long-duration seasonal windows.[1]
Sources
- Source 1: Nike fiscal Q3 2026 earnings and tariff impact overview (Mar 31, 2026)
- Source 2: Athletic apparel turnaround and Nike “Win Now” strategy focus (Sep 30, 2025)
- Source 3: Analyst consensus and sector positioning for Nike (Jun 15, 2025)
- Source 4: Tariff-related gross margin headwinds for Nike (Jun 20, 2025)
- Source 5: Nike fiscal Q1 2025 earnings preview and post-report trading stats (Sep 30, 2025)
- Source 6: U.S. consumer spending and macro backdrop into the 2026 midterm year (Dec 15, 2025)
- Source 7: Athletic apparel sector outlook and competitive dynamics (Nov 10, 2025)
- Source 8: Nike guidance commentary and margin outlook across FY2025–2026 (Oct 5, 2025)
- Source 9: Election-cycle seasonality patterns in U.S. equities (Jan 5, 2026)
- Source 10: Historical seasonality profile for Nike, Inc. across election cycles (Feb 1, 2026)
- Source 11: Nike supply chain exposure and tariff structure (Aug 12, 2025)
- Source 12: Insider buying activity at Nike, including Tim Cook share purchase (Jul 8, 2025)
- Source 13: Nike Q3 2025 earnings recap and guidance commentary (Mar 31, 2025)
- Source 14: Global trade policy developments and implications for consumer brands (Sep 5, 2025)
About this seasonal analysis
Seasonal pattern data is sourced from TradeWave.ai, which analyzes historical price behavior across annual calendar windows going back up to 30 years. Read the full data methodology or the book The 100-Year Pattern by Afshin Moshrefi (2026 edition). Past performance of seasonal patterns does not guarantee future results. This article is for informational purposes only and does not constitute investment advice.