14-of-15 Win Streak: TJX Companies (TJX) Enters a 283-Day Window Averaging 22.1% Gains
TJX Companies is heading into a historically powerful 283-day trading window even as the stock trades about 10.9% below its 52-week high and off recent peaks.

What is the seasonal pattern for TJX Companies (TJX)?
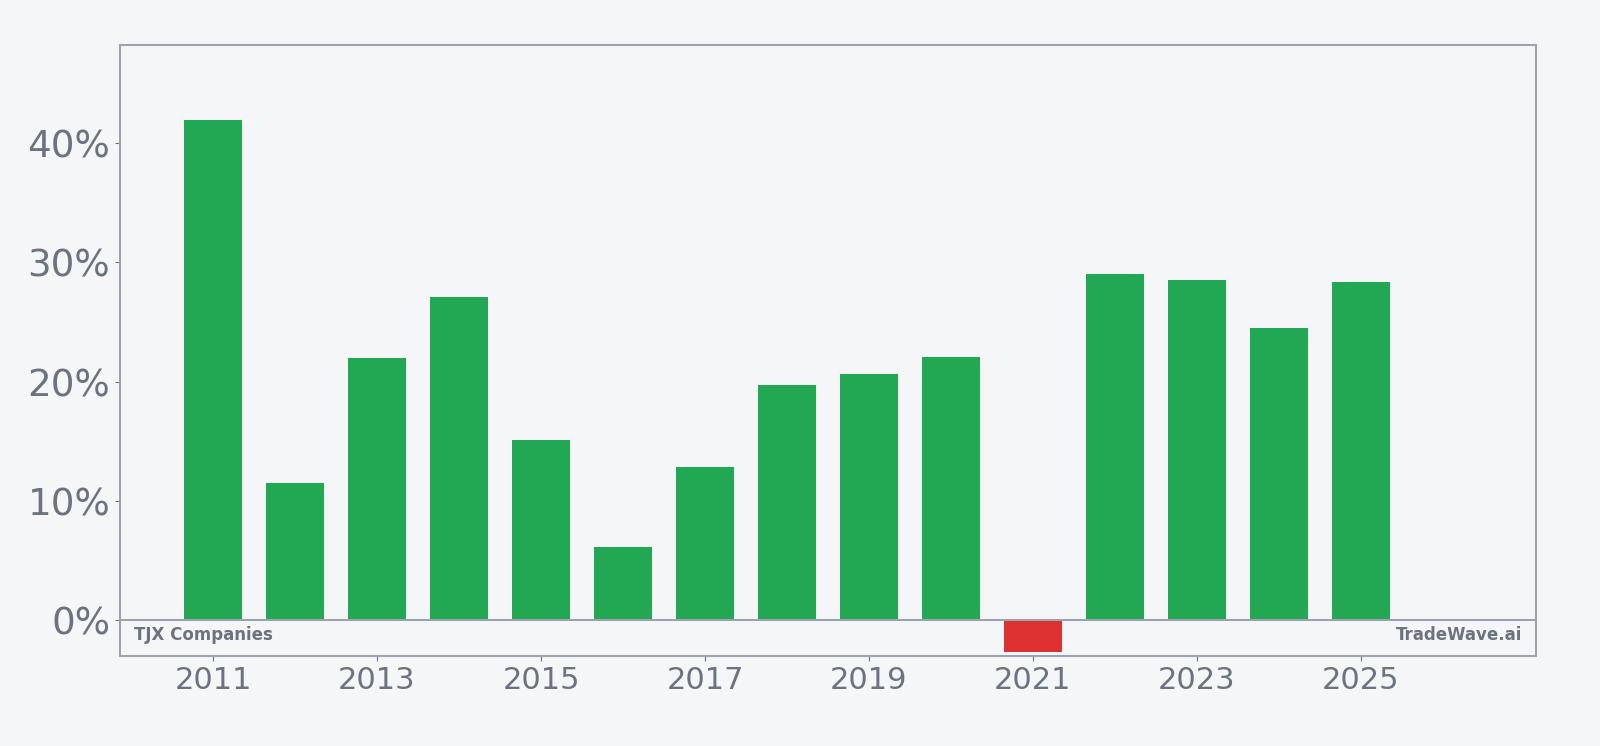
TJX Companies has risen in 14 of 15 years during this late-May 283-day window, with an average gain of 22.1% in winning years.
- 14-for-15 record in this window, with winning years averaging 22.1% gains and only one losing year across the sample.
- The seasonal window begins on May 23 and runs for 283 trading days, covering most of the retail calendar from summer through the following spring.
- Percent Profitable stands at 93%, with 14 winners and 1 loser over the past 15 years in this TJX seasonal trend.
- Including the lone down year, the all-years average return is still a strong 20%, showing how dominant the upside years have been.
- The weakest year, 2021, saw a modest 2.64% loss, while several years posted net gains above 25%, highlighting a skew toward sizable rallies.
- Intraperiod swings can be meaningful, with some years experiencing double-digit drawdowns before finishing higher, so traders still need to respect downside risk.
According to historical data from TradeWave.ai, this upcoming stretch for TJX Companies has behaved very differently from an average year on the calendar, with a clear long-side bias that most investors do not see in standard research.
How strong is the upcoming seasonal window for TJX Companies (TJX)?
TJX Companies has rallied in 14 of the past 15 years during the 283-day window that starts on May 23, averaging 22.1% gains in the winning seasons. Shares finished Monday at $147.77, up 0.3% on the day and sitting about 10.9% below the 52-week high of $165.82 as the next iteration of this pattern approaches.
The trade direction for this TJX Companies trading window is explicitly long, and the historical record backs that up. Percent Profitable is 93%, with 14 winners and just 1 loser across the 15-year lookback, and even when the lone down year is included, the all-years average return still comes in at 20%. The median outcome of 21.97% shows that this is not just a story of one or two outlier rallies; typical seasons have delivered double-digit gains.
Looking at individual years, the weakest season in the sample was 2021, when TJX slipped 2.64% from entry to exit despite a maximum favorable move of 17.42% at one point in the window. On the other side of the spectrum, years like 2022, 2023, 2024 and 2025 all posted net returns between 24.53% and 29.05%, with peak run-ups (maximum favorable excursions) stretching into the high 20s and even near 40%. Add it up: the cumulative return across all 15 windows is 1,437%, and the annualized return clocks in at 19.98%.
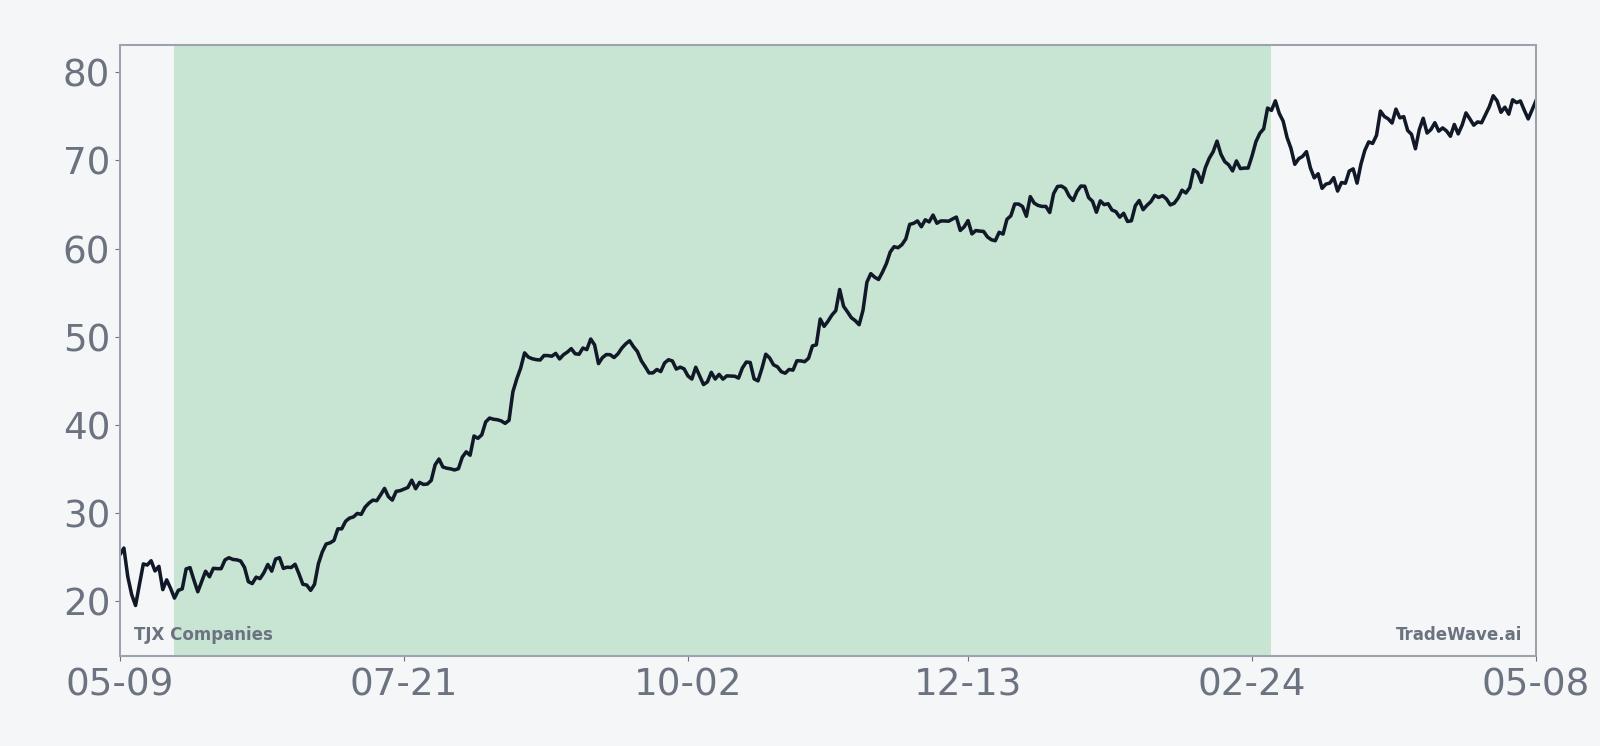
The historical seasonal average trend for this TJX Companies trading window slopes higher for most of the 283 days, with gains tending to build steadily rather than in one short burst. In several of the stronger years, the stock has often pushed higher through the summer and holiday period, then consolidated or extended into the following spring. That profile fits the idea of a long seasonal regime rather than a quick trade.
A combined view of yearly net returns and intraperiod swings shows how upside and drawdowns have coexisted in this window.
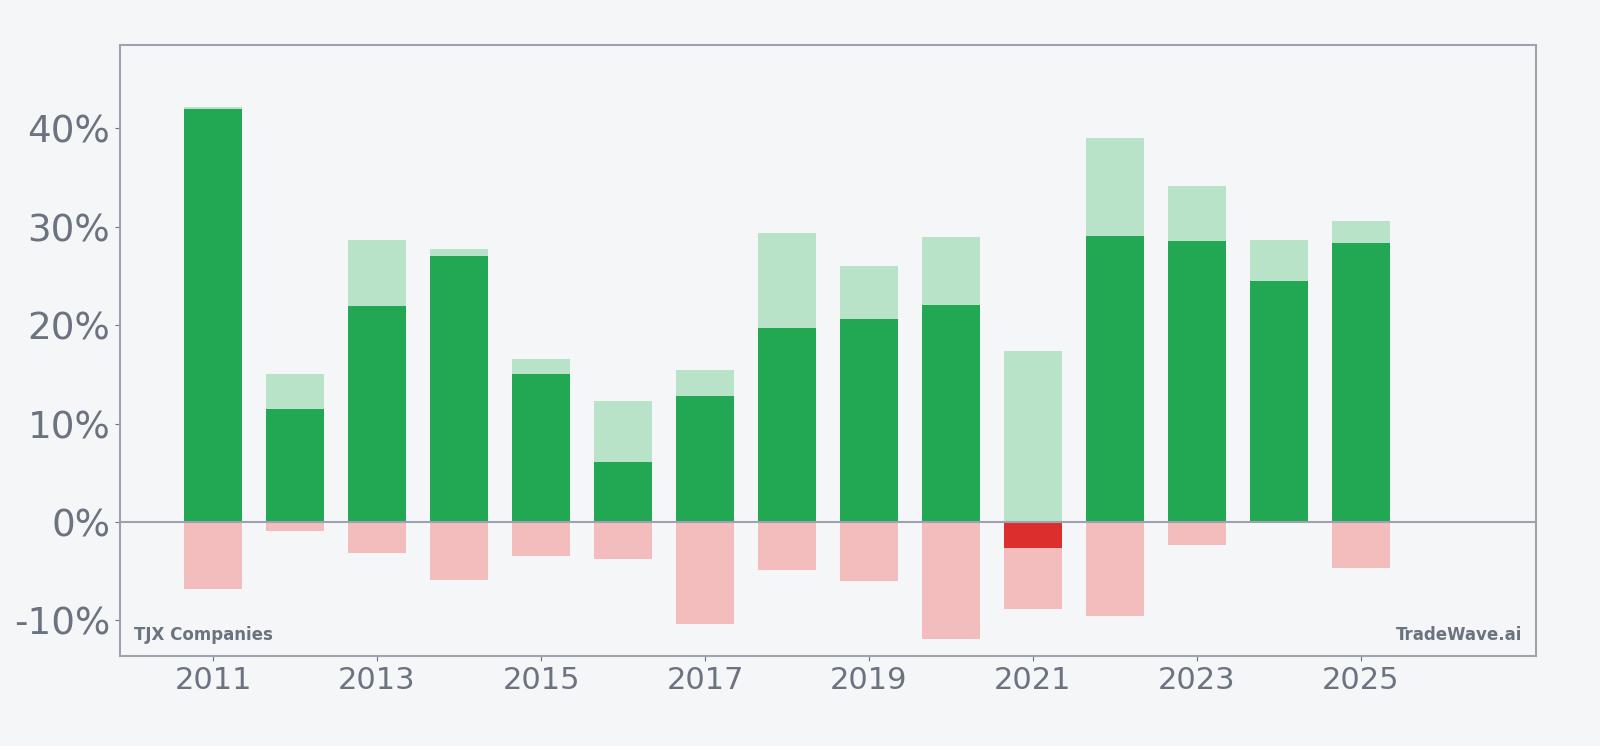
The stacked net, maximum favorable excursion and maximum adverse excursion bars show that even in winning years, TJX has often seen meaningful pullbacks inside the window. For example, 2017 and 2020 both finished with solid double-digit gains but experienced worst-case drawdowns of around 10% to 12% from entry before recovering. In contrast, 2024 stands out with a clean path, where the maximum adverse move was a mild 0.54% while the stock still delivered a 24.53% net gain, illustrating that some seasons have been both strong and relatively smooth.
History does not guarantee future results; adverse excursions (MAE) can be large even in winning windows.
Why does TJX Companies (TJX) follow this seasonal pattern?
One likely driver is the cadence of consumer spending, with TJX Companies heavily exposed to back-to-school, holiday and post-holiday clearance cycles that all fall inside this 283-day stretch. Analysts have also pointed to institutional portfolio repositioning around the company’s fiscal year and earnings cadence, which can cluster buying interest in similar calendar windows over time.[2] For an off-price retailer, periods of consumer caution can further amplify this pattern as shoppers trade down into value channels during key shopping seasons.[5]
What is driving TJX Companies (TJX) today?
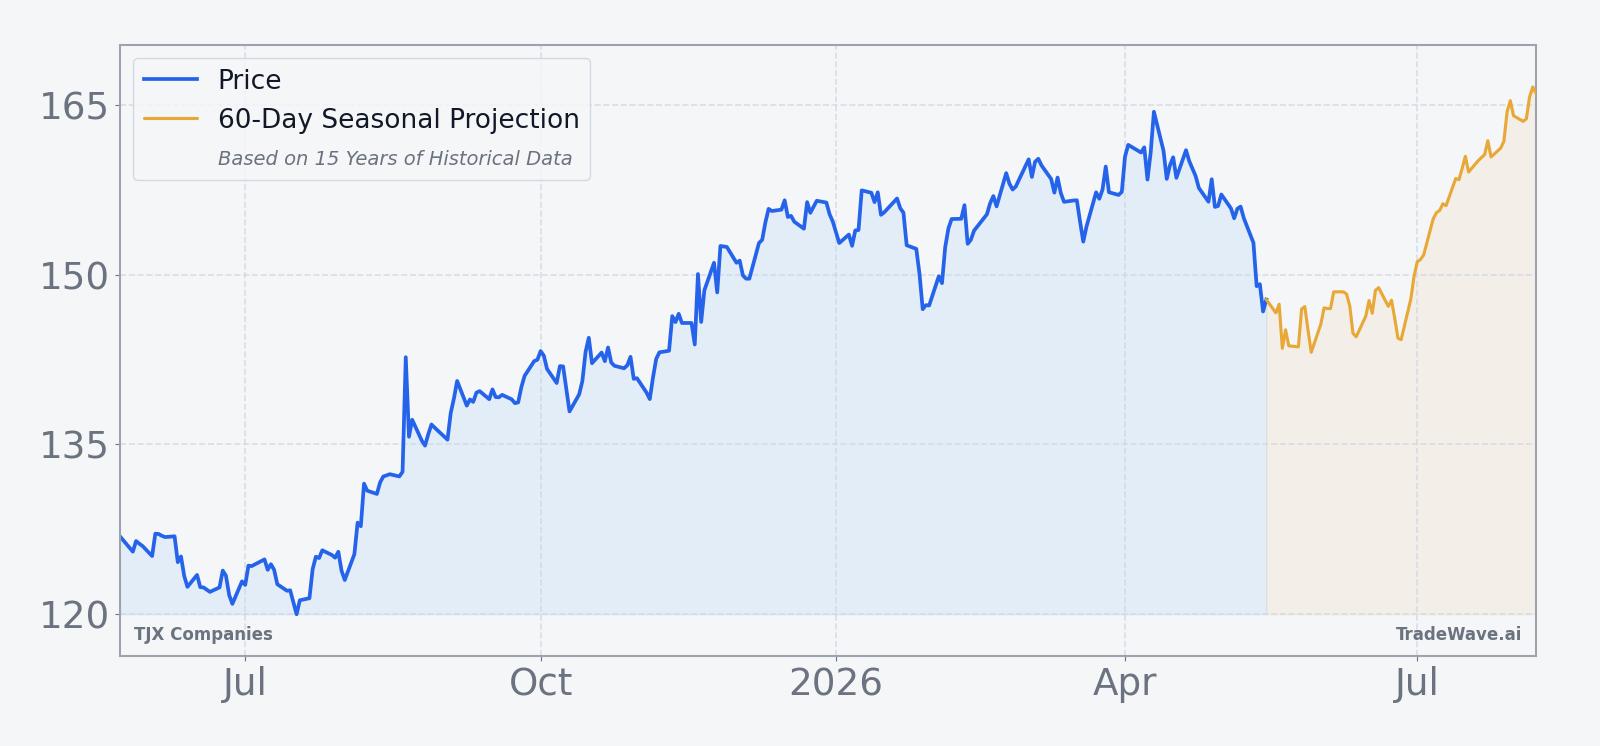
TJX Companies shares closed at $147.77 on May 18, up 0.3% on the session, leaving the stock about 10.9% below its 52-week high of $165.82 and roughly 25.4% above its 52-week low of $117.73. Trading volume of about 4.5 million shares was in line with the 20-day average of 4.45 million, and the stock continues to sit below its 50-day moving average of $156.86, reflecting a pullback of 8.25% over the past month as investors digest a strong multi-quarter run.
In August 2025, TJX delivered a “beat and raise” quarter, with revenue of $14.4 billion topping estimates and management lifting full-year guidance as off-price demand stayed firm despite tariff noise.[3] Later, on Feb 25, 2026, the company again beat expectations with fourth-quarter revenue of $17.7 billion and earnings per share of $1.58, while issuing what analysts described as conservative guidance for fiscal 2027.[2] That combination of strong execution and cautious forward commentary has left some room for debate on how much of TJX’s off-price retail strength is already embedded in the stock.
Sector-wise, TJX sits at the center of the off-price retail theme that has been gaining share from traditional department stores. In August 2025, Reuters reported that the company raised its annual profit forecast on the back of strong demand for discounted apparel and home goods, underscoring how value-focused chains have benefited from a more cautious consumer.[5] With tariffs and sourcing costs still part of the macro conversation, TJX’s ability to lean on third-party sourcing and shift categories has been cited as a competitive advantage that helps protect margins while keeping price points attractive.[1]
On valuation, CNBC and FactSet data cited in February showed TJX carrying a Buy consensus rating, with analysts highlighting its consistent traffic, margin discipline and cash returns to shareholders as reasons the stock remains a core holding in many retail-focused portfolios.[1][4] While specific price targets from those reports reflected earlier price regimes, the tone of coverage has framed TJX as a relative winner in a choppy consumer landscape rather than a deep value laggard.
The chart below situates the latest pullback against TJX Companies’ strong multi-quarter advance and overlays a short-term seasonal projection.
How do earnings shape the outlook for TJX Companies (TJX)?
In February 2026, TJX reported fourth-quarter fiscal 2026 revenue of $17.7 billion, ahead of the $17.4 billion consensus, with earnings per share of $1.58 versus expectations of $1.23 and comparable sales growth of 5%.[2] Management guided fiscal 2027 sales to a range of $62.7 billion to $63.3 billion, with comparable sales growth of 2% to 3%, pretax margin of 11.7% to 11.8% and EPS of $4.93 to $5.02, signaling confidence in steady, if more measured, growth from here.[2]
Those numbers followed an August 2025 quarter where TJX raised its full-year fiscal 2026 EPS guidance to $4.52 to $4.57 and projected comparable sales growth of about 3%, after posting revenue and earnings beats.[3] The pattern across these reports has been consistent: TJX tends to guide conservatively, then deliver upside on both the top and bottom line as traffic and ticket hold up better than feared in a cautious consumer environment.[3][5]
For the upcoming fiscal year, the street expects TJX to lean on a mix of unit growth, merchandising, and disciplined expense control rather than aggressive pricing to hit its targets.[2] That approach fits well with the historical seasonality window, which captures multiple earnings events, including back-to-school, holiday and post-holiday quarters, giving the company several chances to surprise to the upside within the same long seasonal regime.
What macro and sector trends matter for TJX Companies (TJX)?
Macro conditions have been a tailwind for off-price retail, as consumers trade down from full-price channels while still spending on apparel and home categories. In August 2025, Reuters noted that TJX raised its annual profit forecast on strong demand for off-price goods, highlighting how shoppers have been seeking value amid inflation and economic uncertainty.[5] That backdrop has helped TJX gain share from department stores and other traditional retailers that lack the same treasure-hunt appeal.
Tariffs and sourcing costs remain a swing factor, but CNBC coverage in 2025 pointed out that TJX is relatively well positioned because roughly 90% of its merchandise is sourced from third parties, giving it flexibility to shift categories and vendors as conditions change.[1] That flexibility can be especially important across a long seasonal window that spans multiple macro phases, from summer travel to holiday spending and tax-refund season.
Within the broader retail sector, TJX is often viewed as a defensive growth name. When consumer confidence softens, off-price chains can see traffic hold up or even improve as shoppers look for bargains, while in stronger environments, the stores still attract higher-income customers hunting for branded deals.[5] That dual appeal helps explain why the TJX seasonal pattern has been so consistently positive across very different macro backdrops over the past decade and a half.
How does valuation frame TJX Companies (TJX) into this seasonal window?
CNBC and FactSet data cited in February 2026 showed TJX carrying a Buy consensus rating, with analysts emphasizing its durable traffic, margin profile and capital returns as reasons to stay constructive on the stock.[1][4] While specific price targets from those reports are dated relative to today’s $147.77 share price, the tone of coverage has been that TJX deserves a premium to many traditional retailers because of its off-price model and consistent execution.
With the stock trading below its 50-day moving average and off its 52-week high, the upcoming seasonal window arrives at a moment when expectations are solid but not euphoric. That combination of a strong historical seasonality pattern, a still-favorable fundamental story and a modest technical reset is what makes this particular TJX Companies trading window stand out on the calendar.
What should traders watch in this TJX Companies (TJX) seasonal window?
First, watch how TJX behaves around the May 23 start of the 283-day window. Historically, the stock has tended to build gains over the full stretch rather than spike immediately, so early choppiness would not be unusual as long as the broader uptrend reasserts itself within the season.
Second, earnings cadence will matter. The window will capture multiple reports, including key holiday and post-holiday quarters, and prior years show that upside surprises on comps and margins have often lined up with some of the strongest seasonal runs.[2][3] Traders will be looking to see whether fiscal 2027 guidance proves conservative again, as it has in past cycles, or whether management needs to trim expectations.
Third, keep an eye on levels. On the downside, the 52-week low region near $118 is a long way off but serves as the outer boundary of the recent range, while the 50-day moving average around $156.86 and the 52-week high at $165.82 are the key resistance zones that have capped the stock so far. How TJX trades as it approaches or tests those levels during the seasonal window will offer a real-time check on whether the historical pattern is repeating or stalling.
Finally, monitor the broader off-price retail backdrop and consumer data. If value-focused shoppers keep driving strong traffic and TJX continues to navigate tariffs and sourcing costs effectively, the historical seasonality could again align with the fundamental story.[1][5] If, instead, consumer spending rolls over or promotional intensity spikes across retail, this could be one of the rare seasons where the long-biased TJX seasonal trend faces a tougher test.
Sources
- CNBC, "We're raising our price target on TJX after an impressive beat-and-raise quarter" (Aug 20, 2025)
- Reuters, "TJX Cos beats estimates for fourth-quarter revenue on off-price demand" (Feb 25, 2026)
- CNBC, "TJX Maxx parent company TJX beats earnings expectations, raises full-year guidance despite tariff pressure" (Aug 20, 2025)
- CNBC, "We're boosting our price target on retail stock TJX after another knockout quarter" (Feb 25, 2026)
- Reuters, "TJX raises annual profit forecast on strong demand for off-price goods" (Aug 20, 2025)
About this seasonal analysis
Seasonal pattern data is sourced from TradeWave.ai, which analyzes historical price behavior across annual calendar windows going back up to 30 years. Read the full data methodology or the book The 100-Year Pattern by Afshin Moshrefi (2026 edition). Past performance of seasonal patterns does not guarantee future results. This article is for informational purposes only and does not constitute investment advice.