CoStar Group (CSGP) Has Gained in 5 of 6 Midterm Windows, Averaging 37.46% in Winners
CoStar Group is heading toward a historically strong midterm-year trading window even as the stock trades near 52-week lows after activist pressure faded.

What is the seasonal pattern for CoStar Group (CSGP)?
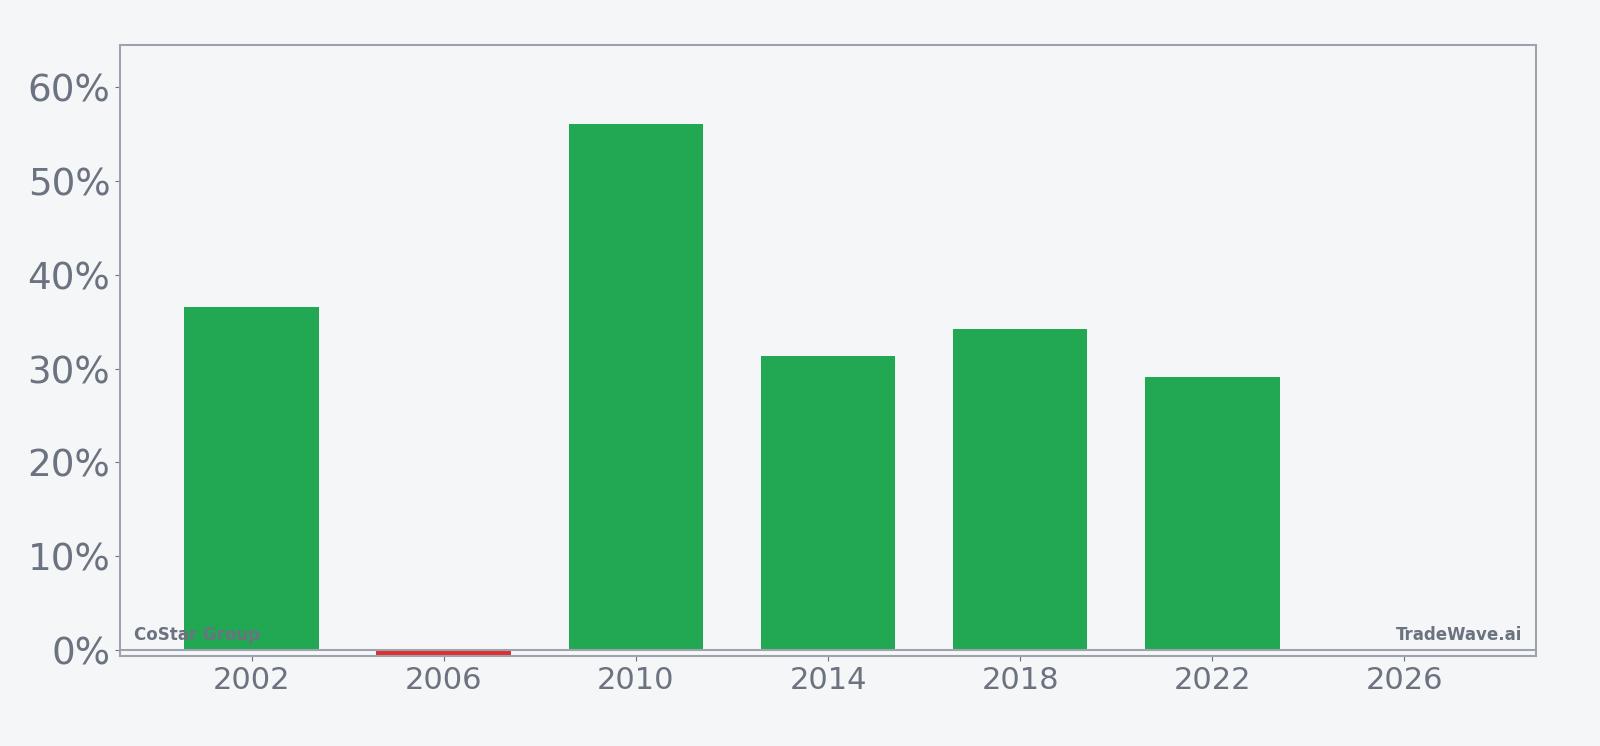
CoStar Group has risen in 5 of 6 midterm-election-year windows starting around late May, with an average gain of 37.46% in winning years.
- 5 wins and 1 loss in this window, with winning years averaging 37.46% gains and a 382% cumulative return across the sample.
- The upcoming midterm-year window begins on May 31, 2026 and spans 364 trading days, covering nearly a full year of CoStar Group trading.
- Percent Profitable stands at 83%, with 5 winners and 1 loser across the last 6 midterm-election-year cycles.
- Average profit across all years, including the lone losing year, is still a robust 31%, while the median outcome is a 32.8% gain.
- Maximum favorable moves inside the window have reached as high as 81.67%, but adverse excursions have run as deep as -29.8%, underscoring real drawdown risk.
- The pattern is aligned with a long trade direction, supported by a 1.8 TradeWave Ratio and a 1.48 Sharpe ratio that signal historically strong risk-adjusted returns.
According to historical data from TradeWave.ai, this midterm-election-year window for CoStar Group has behaved very differently from an average calendar year, and the next iteration is about to open.
How has CoStar Group (CSGP) traded in past midterm-year windows?
CoStar Group has posted gains in 5 of the last 6 midterm-election-year windows starting around May 31, with winning years averaging 37.46% and only one small losing stretch. Shares finished Monday at 32.62, up 2.4% on the day, leaving the stock about 66.5% below its 52-week high of 97.43 and only about 4.0% above its 52-week low of 31.36.
Because this pattern is grouped by the presidential election cycle, it only looks at midterm-election years, which often feature policy uncertainty, shifting regulation and more selective risk appetite. For a company like CoStar Group that sits at the intersection of commercial real estate data and online marketplaces, those mid-cycle shifts can matter more than the average calendar year.
This seasonal window begins on May 31, 2026 and runs for 364 trading days, effectively covering the rest of the midterm year and the early part of the following pre-election year. The trade direction is long, and across the last six midterm-election-year instances CoStar Group has delivered an 83% win rate, with 5 winners and just 1 loser. Average profit in the winning years is 37.46%, while the all-years average, including the -0.6% down year in 2006, still comes in at 31%.
The strongest historical run in this CoStar Group trading window came in 2010, when the stock returned 56.11% from entry to exit and at one point was up 81.67% from the starting level before giving back some gains. The weakest outcome was 2006, which finished down only 0.6% despite a maximum favorable move of 17.34% and a maximum adverse move of -29.8% from entry. That combination of big intraperiod swings and a flat finish is a reminder that even a bullish seasonal pattern can be bumpy.
The maximum favorable excursion, or best point-to-peak move, has ranged from 17.34% to 81.67% across the six years, while the maximum adverse excursion, or worst drawdown from entry, has ranged from -7.22% to -29.8%. In other words, the typical CoStar Group seasonal trend in this window has offered sizable upside potential but has also forced investors to sit through double-digit pullbacks along the way. The 1.8 TradeWave Ratio and 1.48 Sharpe ratio suggest that, historically, the reward has outweighed that volatility for long positions.
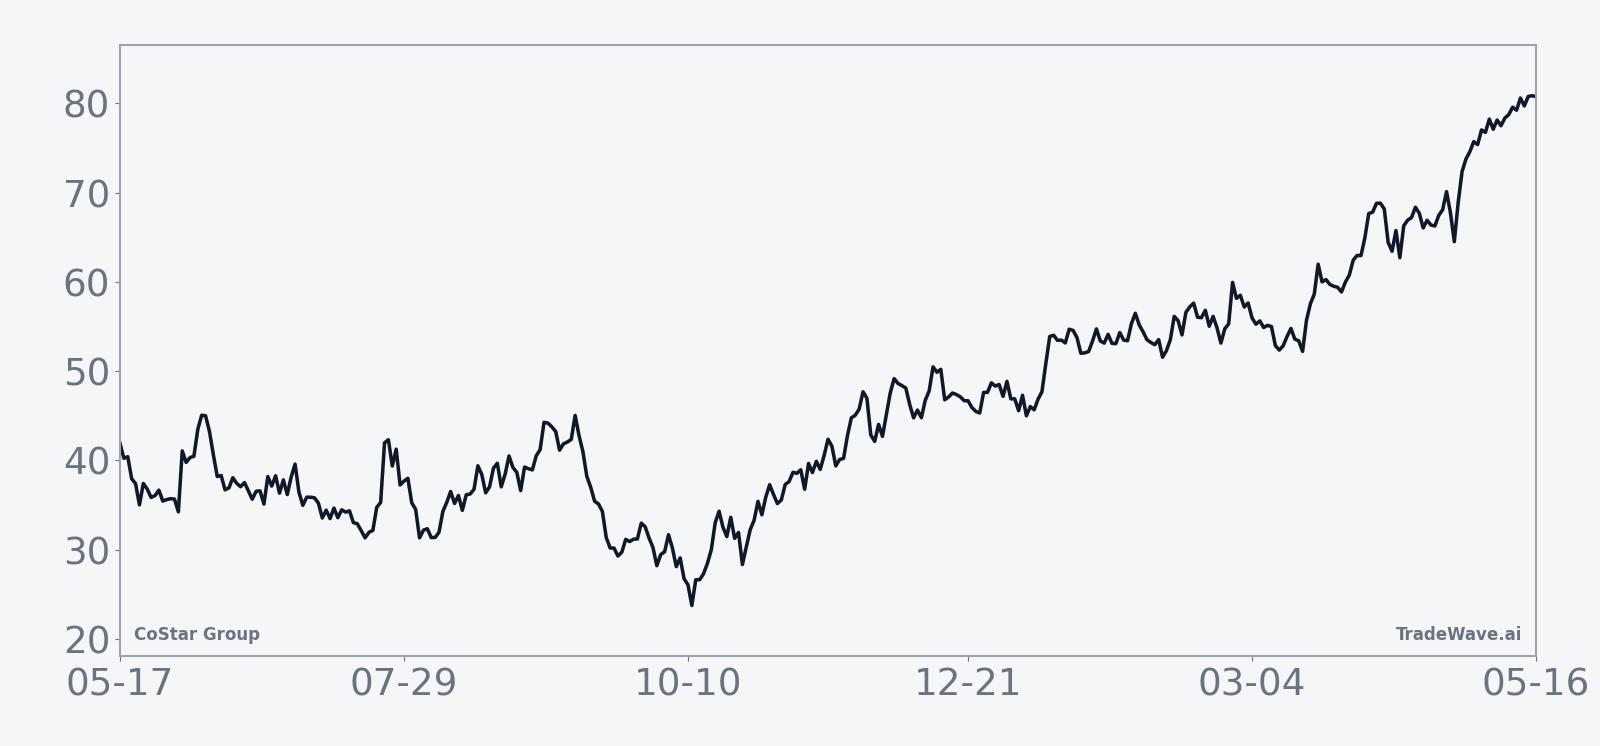
The historical seasonal average trend line slopes higher across most of the 364-day window, with gains tending to build over time rather than arriving in a single burst. The profile shows some early choppiness, then a more persistent climb, which fits a pattern where midterm-year uncertainty gives way to a more constructive pre-election backdrop.
A closer look at yearly net returns and intraperiod swings shows how upside and drawdowns have coexisted in this CoStar Group trading window.
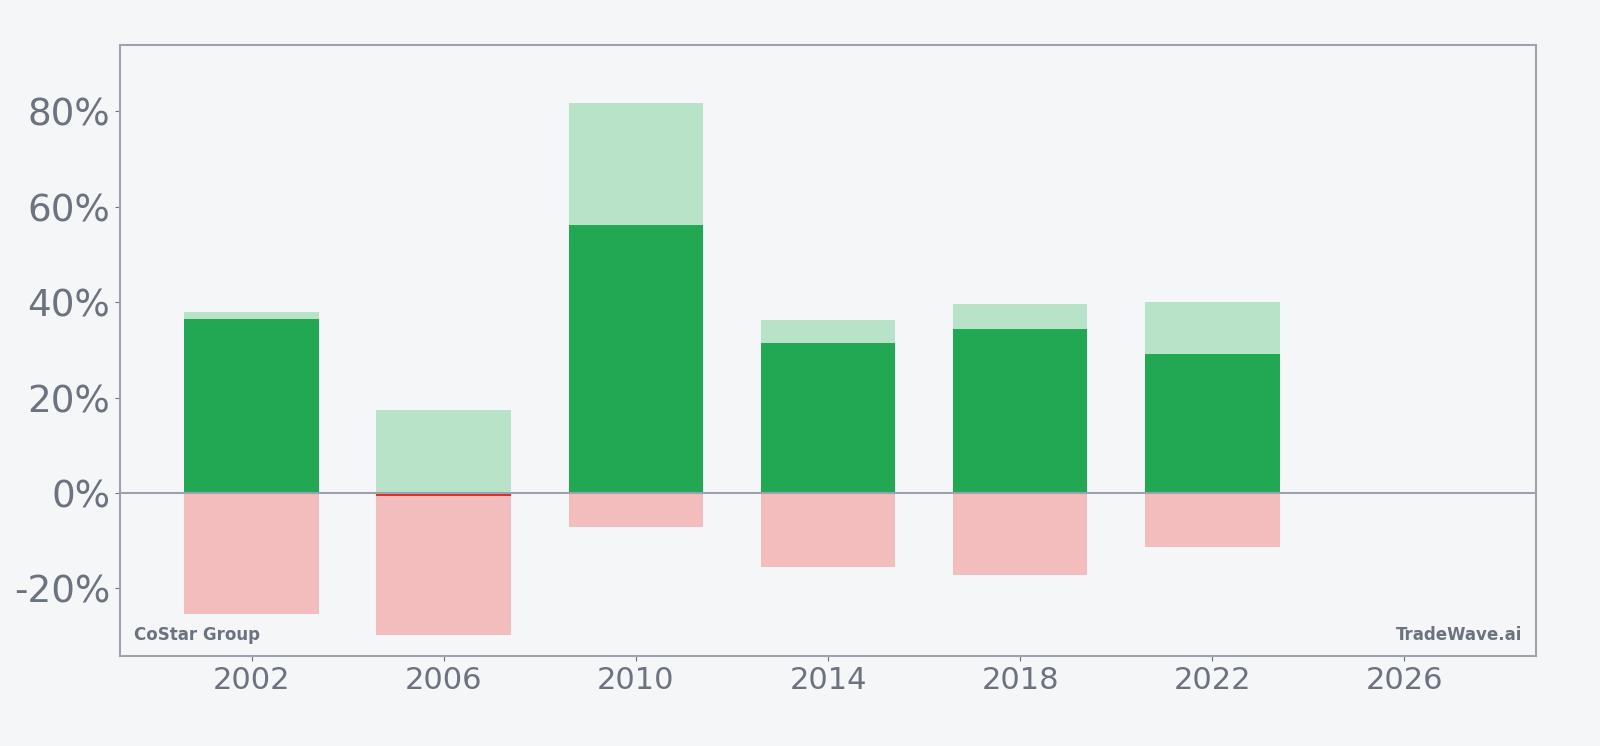
The stacked net, maximum favorable and maximum adverse bars show a consistent pattern: even in winning years, CoStar Group has often experienced double-digit drawdowns before finishing higher, while the lone losing year still saw a meaningful rally that ultimately faded. Add it up: five of six midterm-year windows have rewarded long exposure, but none have been smooth rides.
History does not guarantee future results, and adverse excursions can be large even in winning windows, so traders should treat this seasonal edge as context rather than a forecast.
Why does CoStar Group (CSGP) follow this seasonal pattern?
One likely driver is the way CoStar Group’s customers and investors respond to the policy and rate backdrop that tends to evolve between the midterm election year and the following pre-election year. Commercial real estate demand, online advertising budgets and capital spending plans often reset as Washington’s agenda becomes clearer, which can feed into CoStar Group’s growth expectations and stock pattern analysis. This mid-cycle regrouping may help explain why the company’s midterm-year seasonal trend has leaned bullish despite sizable swings along the way.
What is driving CoStar Group (CSGP) today?
CoStar Group closed Monday at 32.62, up 2.4% on the session, but the stock remains deeply out of favor after sliding from a 52-week high of 97.43 to within a few points of its 52-week low at 31.36. The latest leg lower followed news on Apr 11, 2026 that activist hedge fund Third Point had exited its stake and would not pursue a proxy fight, after the shares had already fallen from roughly 66 dollars to 36.48 dollars during its campaign.[1]
The chart below shows how that drawdown fits into CoStar Group’s past year of trading, alongside a 60-day seasonal projection.
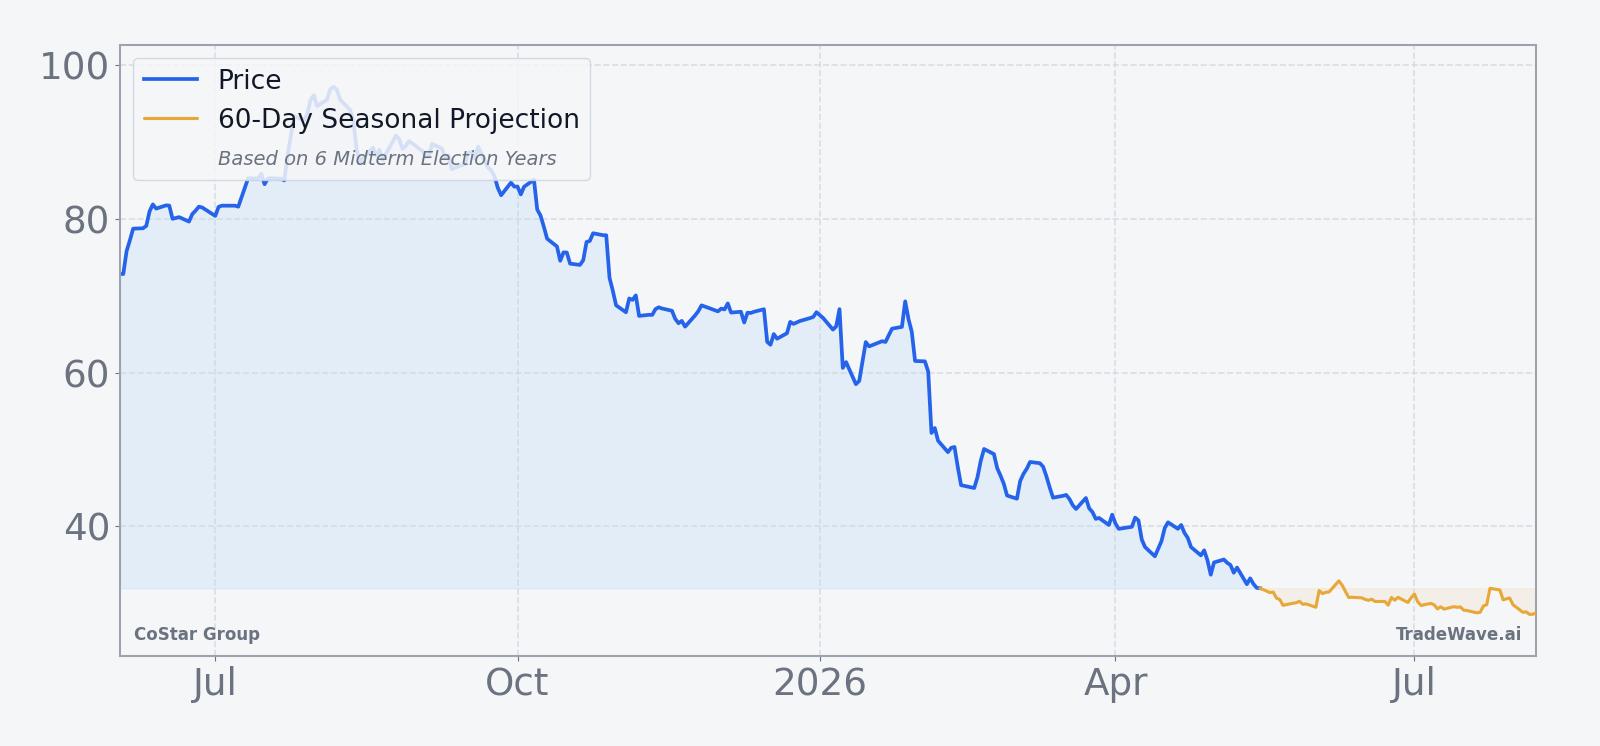
The activist exit removed a potential near-term catalyst for strategic change, leaving fundamentals and the broader software and real estate tech backdrop to do the heavy lifting.[1] With the stock now trading on heavy volume relative to its 20-day average of about 7.9 million shares and sitting well below its 50-day moving average of 38.97, positioning into the late-May seasonal window could matter more than usual for sentiment.
What should traders watch as this CoStar Group seasonal window opens?
First, the calendar: the new midterm-year seasonal window begins on May 31 and runs for roughly a year, so price action in the final days of May will set the entry level for this historical regime. Second, levels: traders will be watching whether CoStar Group can hold above the 31 to 32 dollar band that has defined its recent 52-week low zone, and whether any bounce can reclaim the 50-day moving average near 39 dollars. A sustained move higher from depressed levels that lines up with the historical seasonality would reinforce the bullish midterm-year pattern; a fresh breakdown through the lows would mark a clear deviation from the typical CoStar Group seasonal trend.
Third, catalysts: any updates on product investment, commercial real estate demand or digital marketplace growth could intersect with this window, especially as investors reassess risk into the heart of the midterm election year. Finally, volatility: given that past winning years have still seen maximum adverse moves as deep as roughly -25% to -30%, traders may want to monitor how quickly any pullbacks develop once the window opens. If downside swings remain contained while upside excursions start to build, that would look more like the historical pattern; if drawdowns deepen without corresponding rallies, it would signal that this cycle is breaking from the script.
Sources
About this seasonal analysis
Seasonal pattern data is sourced from TradeWave.ai, which analyzes historical price behavior across annual calendar windows going back up to 30 years. Read the full data methodology or the book The 100-Year Pattern by Afshin Moshrefi (2026 edition). Past performance of seasonal patterns does not guarantee future results. This article is for informational purposes only and does not constitute investment advice.