15-for-15: Amazon (AMZN) Has Rallied Every Early-Summer Window, Averaging 11.75% Gains
Amazon is trading just above its 52-week high after a strong AI- and AWS-driven earnings beat, heading toward a historically powerful early-summer window that has never produced a loss in the past 15 years.

What is the seasonal pattern for Amazon (AMZN)?
Amazon has risen in 15 of 15 years during this late-May to mid-July window, with an average gain of 11.75% in winning years.
- 15 for 15 in this window, with Amazon averaging 11.75% gains across all winning years.
- The 61-day window begins on May 23 and has delivered a 418% cumulative return over the past 15 years.
- Percent Profitable is 100%, with 15 winners and 0 losers in the historical sample.
- Typical winners have seen strong upside follow-through, reflected in a TradeWave Ratio of 1.96 and a Sharpe ratio of 1.78.
- Intraperiod swings have included meaningful drawdowns in some years, even as every window finished positive.
- The pattern has tended to favor long exposure, with gains often clustering in the middle of the window.
According to historical data from TradeWave.ai, this early-summer stretch has behaved very differently from an average month on the calendar for Amazon, and the next iteration is about to open again.
How strong is Amazon’s (AMZN) early-summer seasonal window?
Amazon has rallied in 15 of 15 years during the 61-day window that starts on May 23, averaging 11.75% gains with no historical losses. That kind of clean streak is rare for a mega-cap stock and turns a routine calendar flip into a potential volatility event for a name that already anchors major indices.
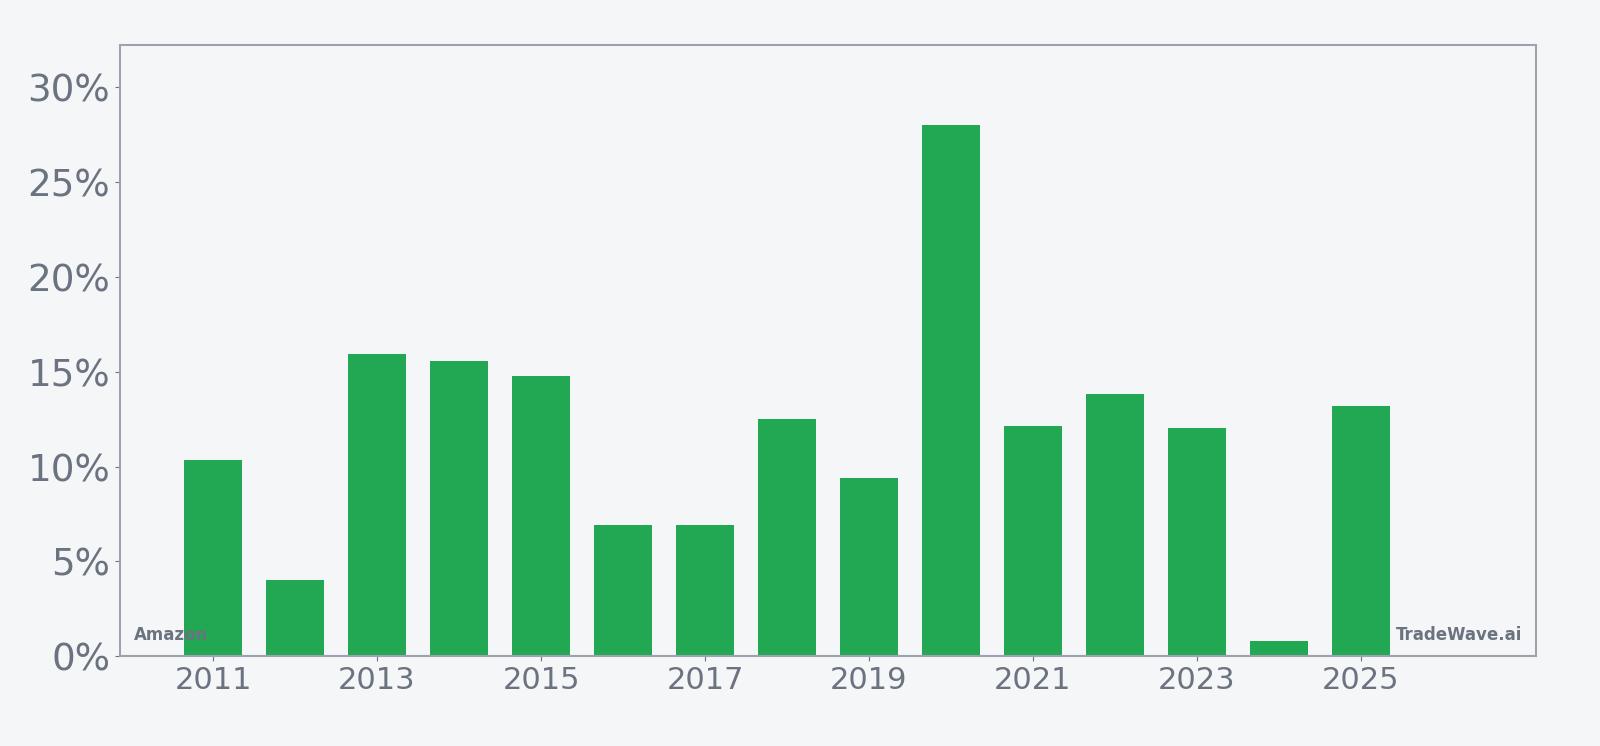
Historically, this has been a long-biased window. The trade direction is explicitly long, and every one of the past 15 iterations finished in the green, from a modest 0.83% gain in 2024 to a 28.0% surge in 2020. Average winners gained 11.75%, while the median outcome of 12.11% shows that the typical year has delivered a double-digit move rather than being skewed by a single outlier.
The per-year profile shows that even the softer years still offered upside. In 2016 and 2017, Amazon added roughly 7% in the window, while stronger cycles like 2018, 2021, 2022 and 2025 all posted gains north of 12%. The standout was 2020, when the stock rallied 28.0% between late May and mid-July as pandemic-era e-commerce and cloud demand accelerated.
The historical seasonal average suggests that gains tend to build gradually rather than arriving in a single burst. The curve slopes higher through the first half of the window, often consolidates briefly, then pushes again into the back half. That pattern lines up with Amazon’s typical calendar, where post-Prime Day commentary and mid-year cloud demand updates can reinforce bullish positioning.
Yearly net and peak moves highlight how much room Amazon has historically had to run inside this window, even when drawdowns appeared along the way.
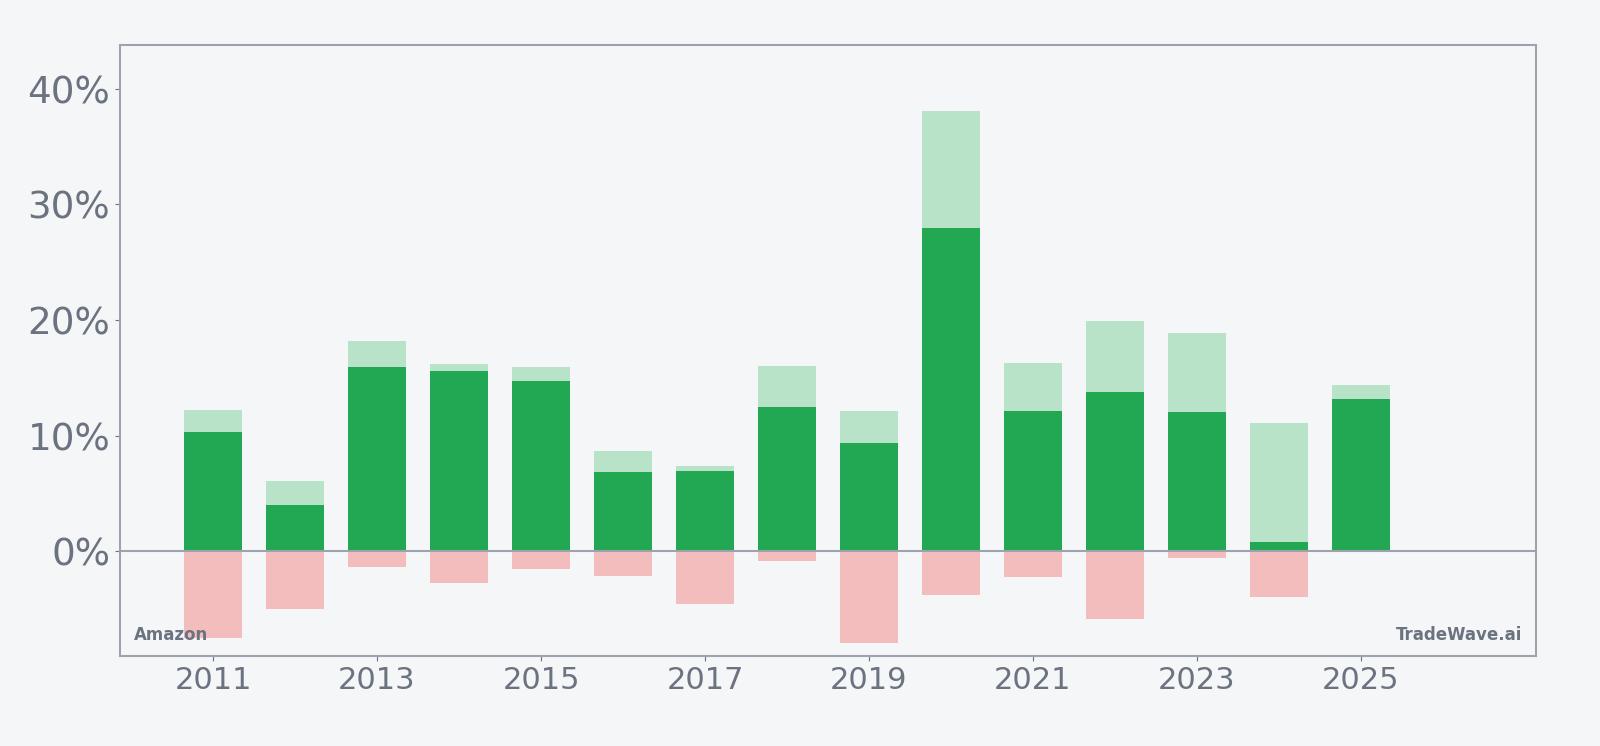
The combination of net returns with maximum favorable and adverse excursions underlines how active this window can be. In strong years like 2020, the maximum favorable move reached 38.09%, far above the already-impressive 28.0% net gain, while the worst drawdown from entry was limited to 3.79%. Other years, such as 2019 and 2022, saw deeper adverse moves of 7.9% and 5.85% respectively before finishing with gains of 9.37% and 13.82%. That mix of sizable run-ups and non-trivial drawdowns is what drives a TradeWave Ratio of 1.96 and a Sharpe ratio of 1.78, pointing to a historically strong but still volatile long window.
History does not guarantee future results; adverse excursions can be large even in winning windows, and traders should treat this pattern as context rather than a forecast.
Put simply, the record is clean: 15 for 15, with double-digit average gains and a track record of meaningful intraperiod swings that have so far resolved higher by the end of the window.
Why does Amazon (AMZN) follow this seasonal pattern?
One likely driver is Amazon’s earnings and event calendar, with late-spring and early-summer often dominated by guidance updates, AWS commentary and preparations for Prime Day that can reset expectations. Analysts have also pointed to institutional portfolio repositioning around mid-year, when growth managers lean into high-conviction names in cloud, AI and e-commerce. This pattern may also reflect consumer and enterprise spending cycles, as retailers and businesses firm up second-half budgets and cloud commitments heading into the back-to-school and holiday build-up.
What is driving Amazon (AMZN) today?
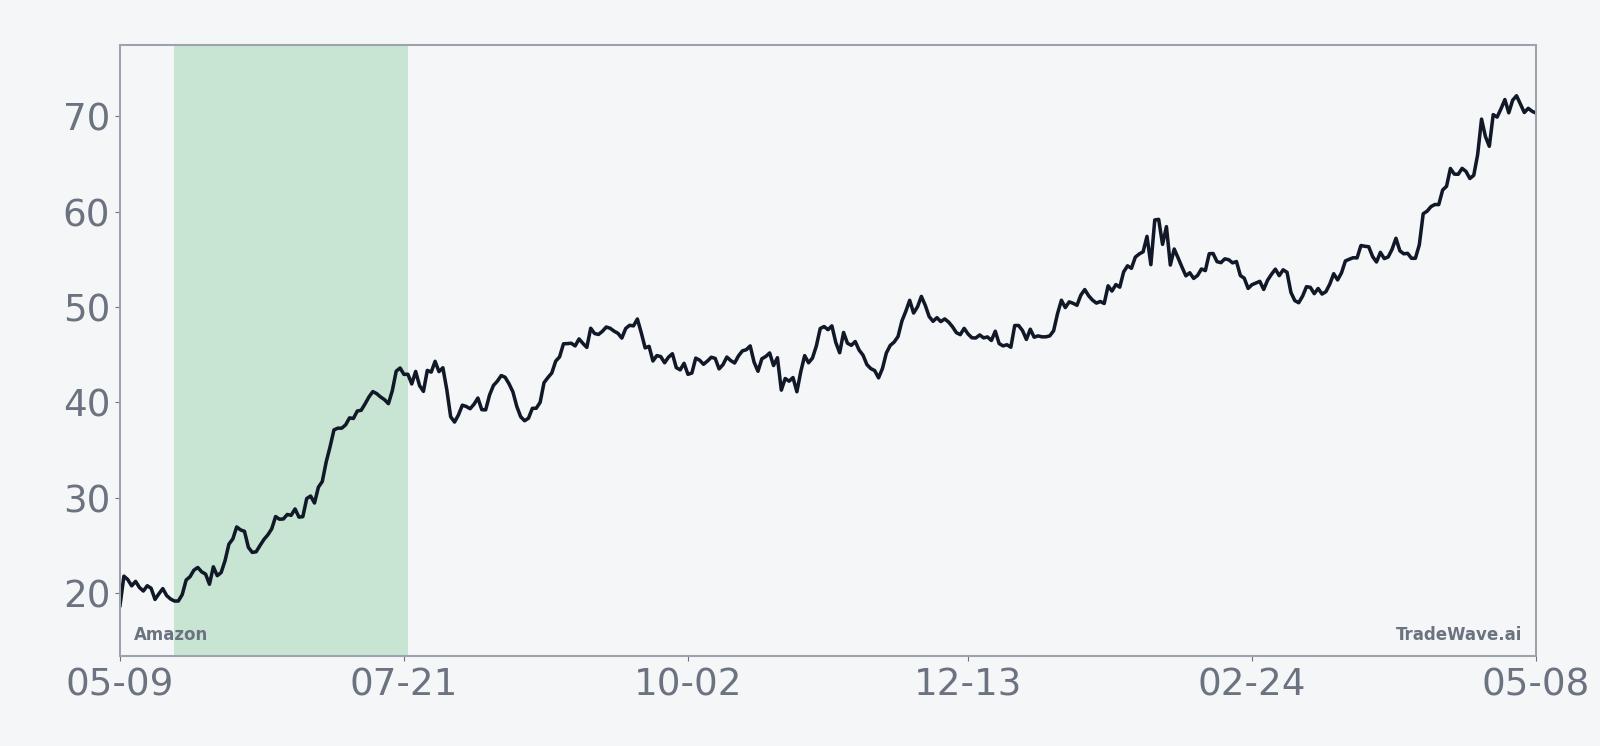
Amazon shares closed at $273.55 on May 6, up 0.6% on the day and trading about 3.5% above their 52-week high of $264.38, after a powerful run that has lifted the stock roughly 27.2% over the past month.[1] The latest leg higher followed a Q1 earnings beat on Apr 29, when Amazon reported revenue of $181.5 billion versus estimates of $177.2 billion and earnings per share of $2.78 against expectations of $1.62, helped by accelerating AWS growth tied to artificial intelligence workloads.[1][4]
Fresh results showed AWS revenue at $37.6 billion, topping forecasts and growing 28% excluding foreign exchange, a sharp contrast to the cloud-growth worries that knocked the stock lower after earlier quarters in 2025.[1][4][5][14] Advertising revenue also came in strong at $17.2 billion, reinforcing the idea that Amazon is increasingly a three-engine story across e-commerce, cloud and ads rather than a single-line retail play.[1]
Street commentary has leaned bullish into this backdrop. UBS lifted its price target to $279 in late 2025, citing upside across e-commerce, cloud and advertising, while other analysts have framed the stock as undervalued relative to its growth profile, pointing to a forward P/E that had been trading at a historic discount before the latest rally.[3][11][12][13] A Forbes review in February 2026 highlighted international expansion and AI chip demand as additional catalysts that could support operating income over the coming quarters.[10]
On the macro side, Amazon is riding a supportive mix of healthy retail sales and robust digital ad spending, which together have underpinned revenue growth even as the company invests heavily in AI infrastructure.[1][2] That combination of cyclical tailwinds and structural AI demand has helped the stock shrug off earlier concerns about cloud deceleration and workforce-related cost pressures that showed up in 2025 earnings commentary.[5][7][14]
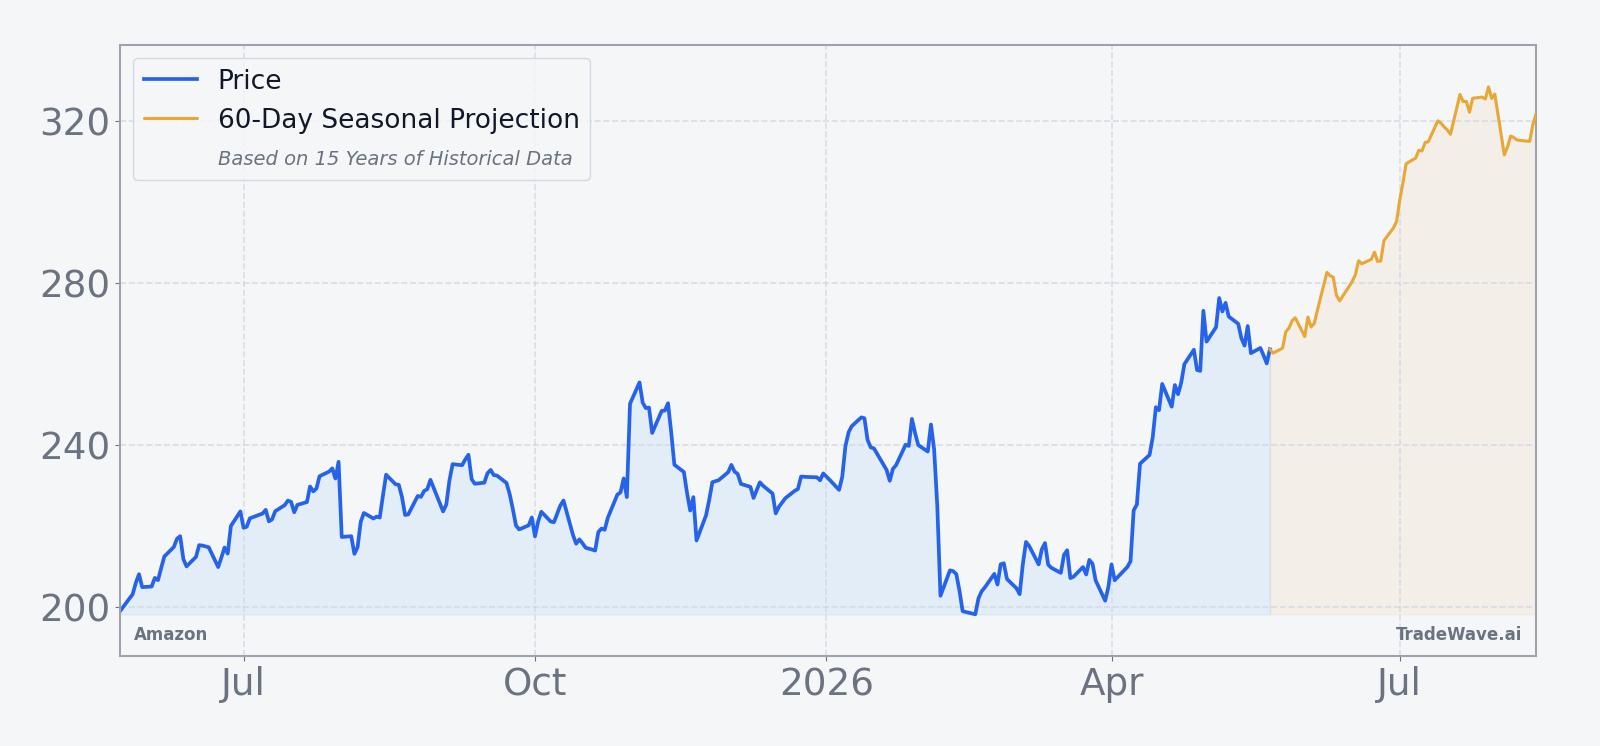
The chart below situates the latest breakout against Amazon’s past year of trading and overlays the upcoming 60-day seasonal projection.
What does the earnings outlook mean for Amazon (AMZN)?
The next scheduled earnings event in the dataset is Amazon’s Q3 2025 report on Oct 30, where analysts had expected revenue of $177.8 billion and EPS of $1.58, with the focus squarely on AI progress and AWS performance.[2] That report ultimately came in ahead of expectations, with AWS and advertising strength offsetting margin pressures and driving a post-earnings surge in the stock.[6]
More recently, management’s Q1 2026 commentary paired the beat with Q2 revenue guidance of $194 billion to $199 billion, above consensus, even as the operating income outlook of $20 billion to $24 billion sat slightly below analyst estimates of $22.9 billion.[1] That mix suggests Amazon is still prioritizing heavy AI and infrastructure investment while keeping a close eye on profitability, a balance that can amplify volatility around earnings dates inside the upcoming seasonal window.
For traders watching the AMZN seasonal trend, the key question is whether AWS and AI momentum can keep surprising to the upside. In August 2025, the stock slumped after cloud growth underwhelmed investors, showing how quickly sentiment can swing when AWS misses the high bar the market has set.[5][14] The early-summer window has historically overlapped with periods when management updates cloud and AI roadmaps, which can either reinforce or challenge the bullish seasonal bias.
How do macro and sector trends frame Amazon’s seasonal outlook?
Amazon sits at the crossroads of several macro themes: consumer spending, digital advertising and enterprise cloud adoption. In April 2026, strong Q1 results were tied to healthy retail demand and ad strength, suggesting that the broader economy is still providing a supportive backdrop for the company’s core businesses.[1][2] That matters for a seasonal pattern that has historically leaned on risk-on sentiment and growth appetite heading into the middle of the year.
Within the tech sector, AWS’s 28% growth excluding FX has reinforced Amazon’s position as a leader in cloud services, even as hyperscale rivals fight aggressively for AI workloads.[1] The company’s ability to convert that demand into operating income, while managing capital intensity from AI chips and data centers, will be a key swing factor for how the stock behaves inside the upcoming window.
On the consumer side, e-commerce and advertising have both been running ahead of expectations, with ad revenue at $17.2 billion in Q1 and retail sales beating forecasts.[1] If those trends hold into late May and June, they could provide fundamental support beneath a seasonal pattern that has historically favored long exposure.
How are analysts valuing Amazon (AMZN) into this window?
Analyst commentary over the past year has framed Amazon as a growth name trading at a relative discount to its own history. In September 2025, MarketWatch described the stock as sitting at a “historic discount” on a forward P/E basis, arguing that the market was underpricing the company’s multi-engine growth story.[12] Subsequent pieces from The Motley Fool and Forbes in late 2025 and early 2026 echoed that view, calling the stock a rare buying opportunity and reiterating buy ratings despite bouts of underperformance.[11][13]
UBS’s $279 price target, set ahead of late-2025 earnings, sits only slightly above the current $273.55 share price, reflecting how the recent rally has already closed much of the perceived valuation gap.[3] That does not mean the upside case is exhausted, but it does suggest that further gains inside the seasonal window may need to be justified by continued beats on AWS, AI and advertising rather than multiple expansion alone.
What should traders watch in Amazon’s (AMZN) early-summer window?
Three things stand out as the May 23 window approaches. First, price levels: with Amazon already about 3.5% above its 52-week high and up 27.2% over the past month, any pullback toward the prior high around $264 could test how committed new buyers are to the post-earnings breakout.[1] Second, fundamentals: updates on AWS growth, AI infrastructure spending and advertising demand will be crucial in determining whether the stock can sustain the kind of double-digit gains that have characterized past early-summer windows.[1][4][10]
Third, behavior inside the window itself. Historically, strong years have seen Amazon absorb mid-window drawdowns of 4% to 8% before finishing higher, while the biggest winners have combined limited downside with outsized maximum favorable moves. If the stock grinds higher with only shallow dips, it would rhyme with the more powerful historical cycles. A deeper, faster selloff that fails to recover by mid-July would mark a clear break from the 15-year pattern and signal that fundamentals or positioning have shifted.
Add it up: a mega-cap stock at fresh highs, a clean 15-for-15 early-summer record, and a market that is increasingly pricing Amazon as a core AI and cloud winner. Traders do not need to treat the seasonal pattern as a script, but they ignore this particular slice of the calendar at their own risk.
Sources
- [1] Yahoo Finance, "Amazon reports Q1 earnings that top analyst estimates amid artificial intelligence push" (Apr 29, 2026).
- [2] Business Insider, "Amazon earnings on deck with focus on AI and AWS" (Oct 30, 2025).
- [3] CNBC, "UBS lifts Amazon price target ahead of e-commerce giant’s earnings" (Oct 28, 2025).
- [4] Seeking Alpha, "Amazon blows past AWS estimates while AI investments dent free cash flow" (Apr 29, 2026).
- [5] Yahoo Finance, "Amazon stock slides 8% after AWS results raise questions about company's AI plans" (Aug 1, 2025).
- [6] Seeking Alpha, "Amazon surges after Q3 beat driven by AWS, ad growth" (Oct 30, 2025).
- [7] Seeking Alpha, "Amazon: Workforce Related Challenges Show Up, Again" (Nov 3, 2025).
- [10] Forbes, "Here Are The Catalysts AMZN Stock Bulls Are Waiting For" (Feb 12, 2026).
- [11] The Motley Fool, "Is This a Rare Buying Opportunity for Amazon Stock?" (Jan 4, 2026).
- [12] MarketWatch, "Amazon’s stock is trading at a historic discount" (Sep 25, 2025).
- [13] Forbes, "Buy Or Sell Amazon Stock?" (Nov 13, 2025).
- [14] Reuters, "Amazon slumps after cloud computing growth underwhelms investors" (Aug 1, 2025).
About this seasonal analysis
Seasonal pattern data is sourced from TradeWave.ai, which analyzes historical price behavior across annual calendar windows going back up to 30 years. Read the full data methodology or the book The 100-Year Pattern by Afshin Moshrefi (2026 edition). Past performance of seasonal patterns does not guarantee future results. This article is for informational purposes only and does not constitute investment advice.