Amazon (AMZN) Has Rallied in 15 of 15 Late-May Windows, Averaging 11.75% Gains
Amazon shares sit at fresh 52-week highs just weeks before a 61-day window that has never produced a loss in the past 15 years, raising the stakes for this year’s move.

What is the seasonal pattern for Amazon (AMZN)?
Amazon has risen in 15 of 15 years during this late-May 61-day window, with an average gain of 11.75% in winning years.
- 15 for 15 in this window, with Amazon averaging 11.75% gains across all winning years.
- The upcoming seasonal window starts on May 23, 2026 and runs for 61 trading days into mid-summer.
- Percent Profitable is 100%, with 15 winners and 0 losers across the 15-year lookback.
- Median profit of 12.11% suggests the typical year has delivered a double-digit advance in this stretch.
- A TradeWave Ratio of 1.96 indicates price has historically traveled meaningfully in the long direction within the window.
- Even in winning years, adverse moves have reached as much as about 7.9% intraperiod drawdown, underscoring real downside risk along the way.
According to historical data from TradeWave.ai, this late-May through mid-summer stretch has behaved very differently from an average calendar month for Amazon. The next section walks through how that pattern has played out and where the risks have clustered in prior years.
How has Amazon (AMZN) traded in the late-May seasonal window?
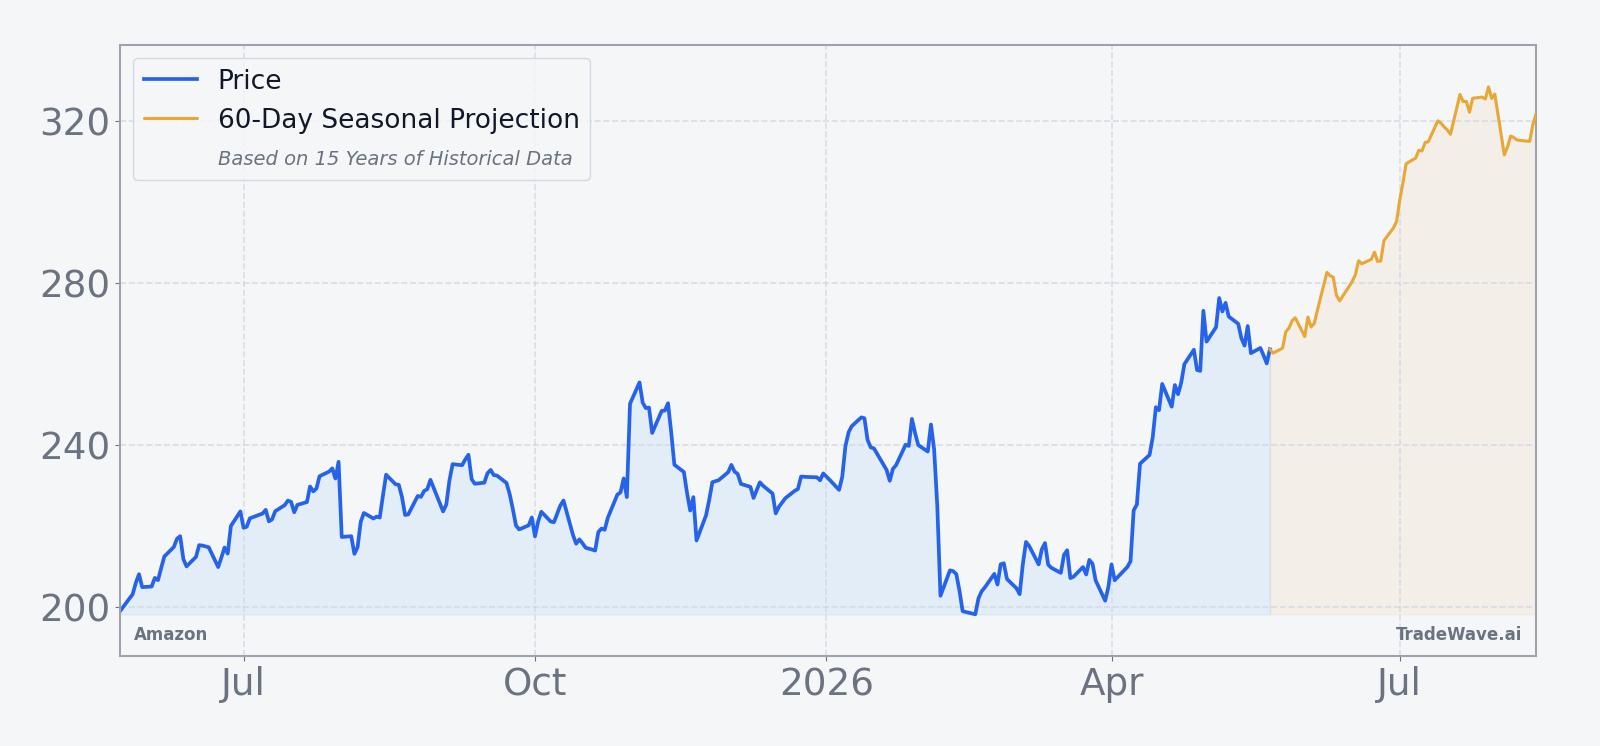
Amazon has posted gains in every single late-May 61-day window for the past 15 years, averaging 11.75% returns with a long bias. The next iteration of that window begins on May 23, 2026, with the stock already trading at 263.99, about 0.3% above its 52-week high of 264.375 and up roughly 3% year to date.[1]
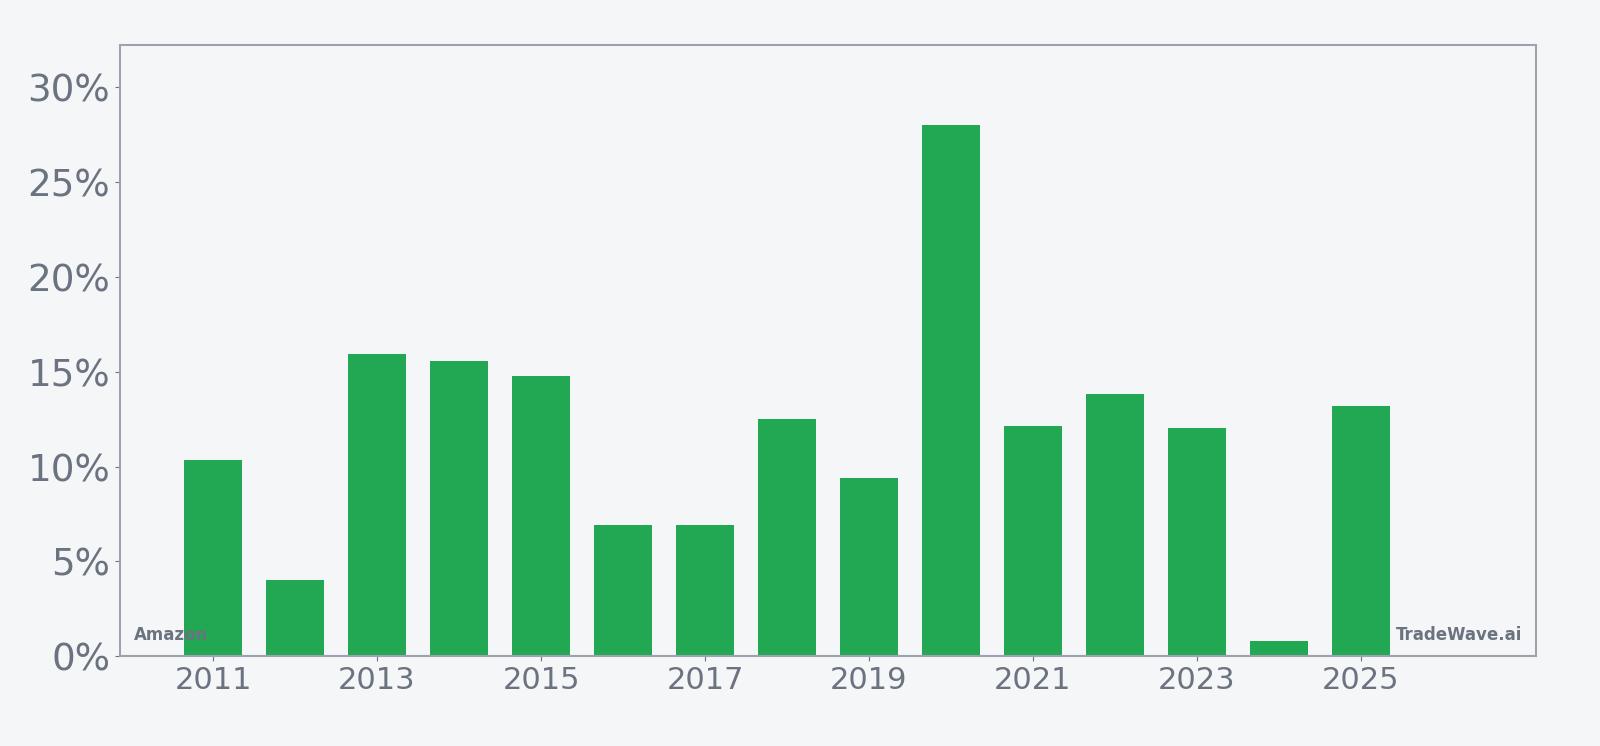
For this long setup, every year in the sample has been a “favorable” year, with no losing outcomes at the end of the 61-day stretch. Average gains of 11.75% and a median of 12.11% point to a fairly tight cluster of double-digit advances rather than a pattern dominated by one or two outliers. The cumulative return across all 15 windows is 418%, which means that simply holding through this slice of the calendar each year would have stacked up a large share of Amazon’s long-run gains.
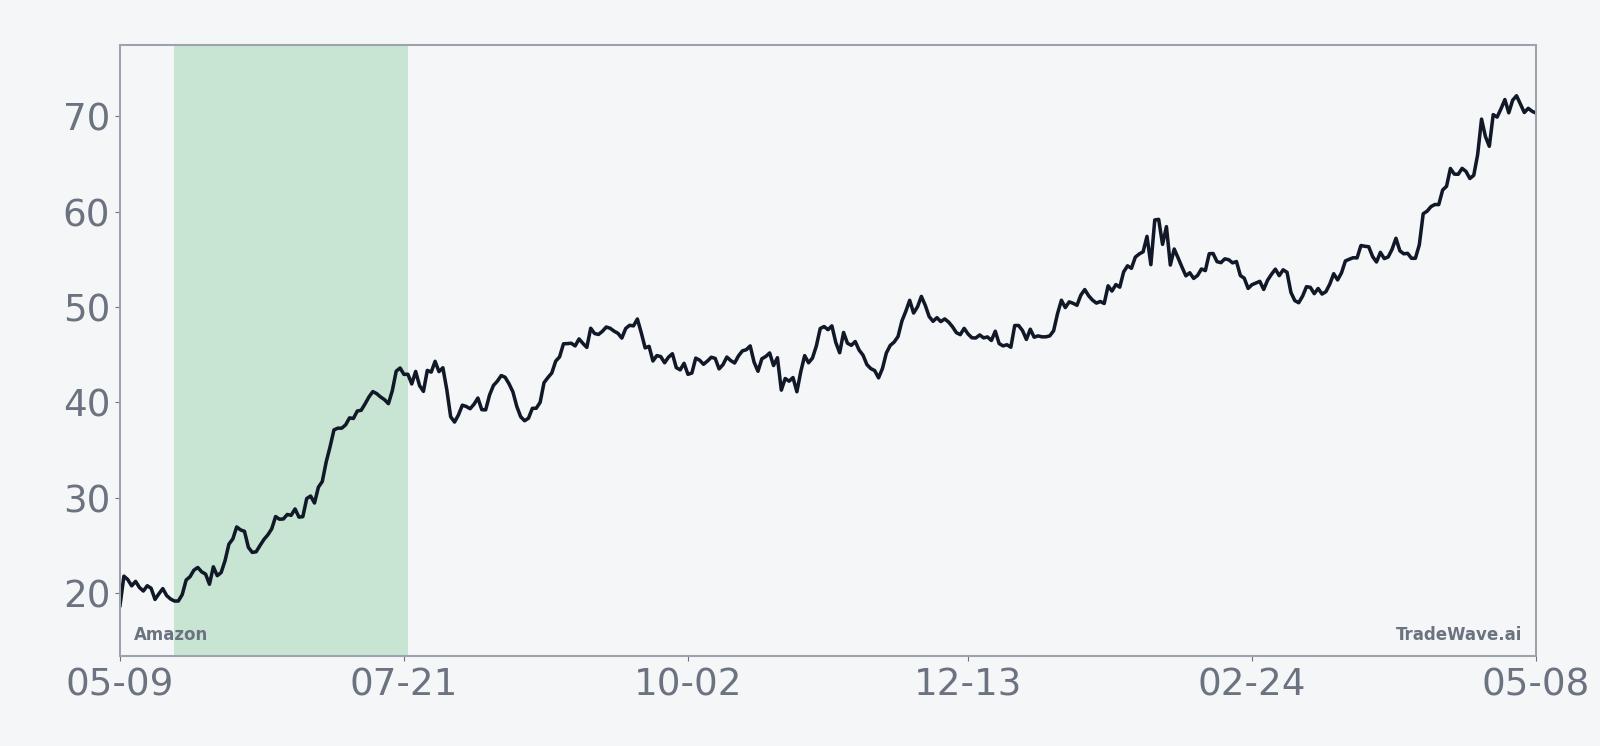
The historical seasonal average suggests the typical year sees Amazon grind higher through the first few weeks of the window, then accelerate into the back half. That fits with several standout years. In 2020, for example, the stock gained 28.0% in this period with a best intraperiod run-up of 38.09% from the entry price, while in 2022 it added 13.82% with a peak move of 19.93%.
A combined view of net results, best run-ups and worst drawdowns shows how much room Amazon has historically given traders on both sides of the tape.
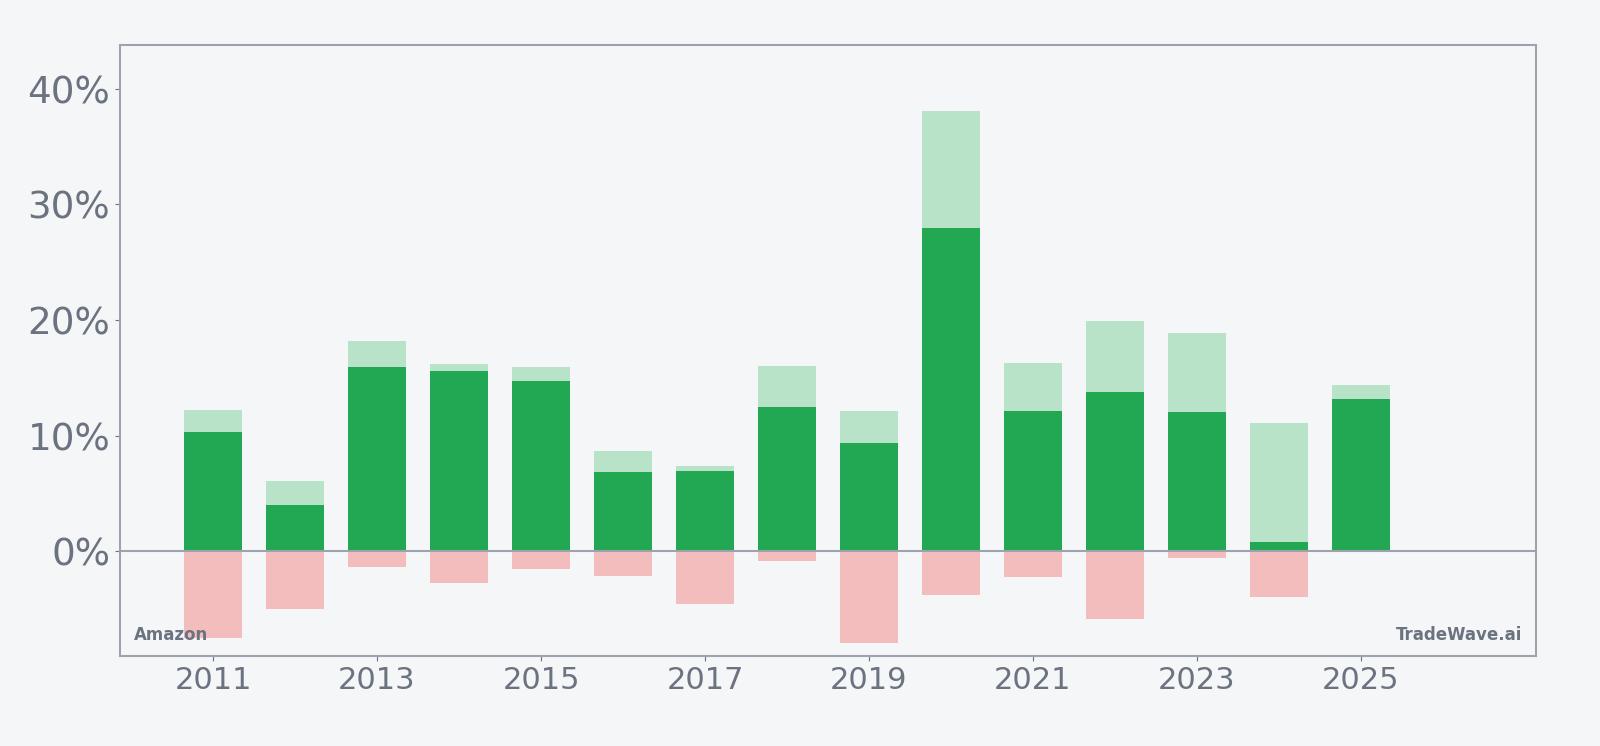
Looking at the best and worst intraperiod moves, or maximum favorable and adverse excursions, the pattern has offered sizable swings. In 2019, Amazon finished the window up 9.37% but at one point had rallied 12.14% from the entry before giving some back, while also enduring a worst drawdown of about 7.9% along the way. Even quieter years have not been straight lines. In 2024 the stock ended the window barely positive at 0.83%, yet still saw an 11.13% peak run-up and a 3.97% pullback from the starting level.
Put together, the history shows a long-biased window with a strong tendency to finish higher, but with enough volatility inside the 61 days that timing and risk management have mattered. Fifteen for fifteen is a rare record for any large-cap stock in a defined calendar stretch, and that is the backdrop Amazon carries into late May.
Why does Amazon (AMZN) follow this seasonal pattern?
One likely driver is the way Amazon’s earnings and guidance cadence clusters around late spring and early summer, when investors often reset expectations for the back half of the year.[1][3][4] Analysts have also pointed to e-commerce and cloud demand that tends to firm after the post-holiday lull, with AWS and advertising growth helping margins in this part of the calendar.[2][7] The pattern may also reflect institutional portfolio rebalancing into high-growth tech ahead of the second-half spending season, which can concentrate buying interest in mega-cap names like Amazon.
History does not guarantee future results; adverse excursions can still be large inside the window even when the final outcome has been positive in prior years.
What is driving Amazon (AMZN) today?
Amazon closed Monday at 263.99, up 3.5% on the day and sitting about 0.3% above its 52-week high of 264.375, extending a one-month rally of 27.2% and leaving the stock roughly 3% higher for 2026 so far.[1] The move keeps Amazon firmly in the market’s leadership group, with investors still focused on how quickly AWS can re-accelerate in artificial intelligence workloads and whether retail and advertising can sustain margin gains seen in prior quarters.[3][7]
In 2025, Amazon’s Q2 results showed revenue of $167.7 billion and earnings per share of $1.68, beating expectations but raising questions about the trajectory of AWS growth and the company’s AI positioning.[3] Later that year, Q3 guidance called for revenue between $174 billion and $179.5 billion, and the eventual report highlighted better-than-expected net sales and profits, with AWS and advertising offsetting margin pressures and lifting the stock.[1][4] Those numbers are dated by 2026 standards, but they frame the debate investors still have about how much of Amazon’s AI and cloud upside is already in the price.
Analyst sentiment remains broadly constructive. In late October 2025, LSEG data cited by CNBC showed a consensus “Buy” rating and a price target around $279, with some firms lifting targets ahead of earnings on expectations for continued strength in AWS and advertising.[2] That target sat only modestly above where the stock trades today, suggesting that at least part of the Street’s earlier upside case has already been realized.
On the macro side, Amazon’s retail business has shown resilience in the face of tariff headlines, with no broad-based changes in selling prices reported in mid-2025.[7] At the same time, sector commentary has emphasized the company’s mix shift toward higher-margin businesses such as cloud and advertising, as well as automation and cost controls that could support operating income even if top-line growth moderates.[2] Balancing that, workforce-related challenges and severance costs have periodically weighed on profitability and remain a watchpoint for 2026.[5]
The chart below puts the latest breakout in context and overlays the next 60 days of the historical seasonal projection.
What should traders watch as the late-May window approaches?
With Amazon already pressing new highs, the key question for this year’s late-May window is whether the stock can extend gains without stretching valuations or investor expectations too far. The historical pattern says this 61-day stretch has been unusually friendly to long positions, but the current setup is starting from a stronger base than many prior years.
Into and through the window, the first thing to watch is how Amazon trades around any updates on AWS and AI strategy, especially as investors look ahead to the next earnings report and fresh guidance on cloud demand and capital spending.[1][3][4][7] A continuation of strong advertising and cloud commentary would rhyme with prior years in which the stock built on late-spring strength, while any renewed concerns about growth or margins could test the pattern’s resilience.
Second, price levels matter. On the upside, traders will be watching whether Amazon can hold above the recent breakout zone near its prior 52-week high and build a new base there. On the downside, any pullback that quickly erases a chunk of the recent 27.2% one-month gain would echo years like 2019 and 2024, when intraperiod drawdowns were meaningful even though the window ultimately finished positive.
Finally, behavior inside the window will be the real tell. If Amazon spends most of late May through mid-summer grinding higher with only shallow pullbacks, it would be consistent with the 15-year seasonal trend. A choppier tape with deeper, faster selloffs would not break the pattern on its own, but it would signal that the balance between AI optimism, macro risk and valuation is shifting compared with earlier cycles.
Sources
- Business Insider, "Amazon earnings on deck with focus on AI and AWS" (Oct 30, 2025)
- CNBC, "UBS lifts Amazon price target ahead of earnings" (Oct 28, 2025)
- Yahoo Finance, "Amazon stock slides after AWS results raise questions about AI plans" (Aug 1, 2025)
- Seeking Alpha, "Amazon surges after Q3 beat driven by AWS and ad growth" (Oct 30, 2025)
- Seeking Alpha, "Amazon: Workforce Related Challenges" (Nov 3, 2025)
- Reuters, "Amazon slumps after cloud computing growth underwhelms investors" (Aug 1, 2025)
About this seasonal analysis
Seasonal pattern data is sourced from TradeWave.ai, which analyzes historical price behavior across annual calendar windows going back up to 30 years. Read the full data methodology or the book The 100-Year Pattern by Afshin Moshrefi (2026 edition). Past performance of seasonal patterns does not guarantee future results. This article is for informational purposes only and does not constitute investment advice.