Southern Company (SO) Has Risen in All 10 Midterm Summers, Averaging 5.41% Gains
Southern Company is trading just below its 52-week high as it moves through a midterm-year seasonal window that has never posted a loss in the last 10 cycles.

What is the seasonal pattern for Southern Company (SO)?
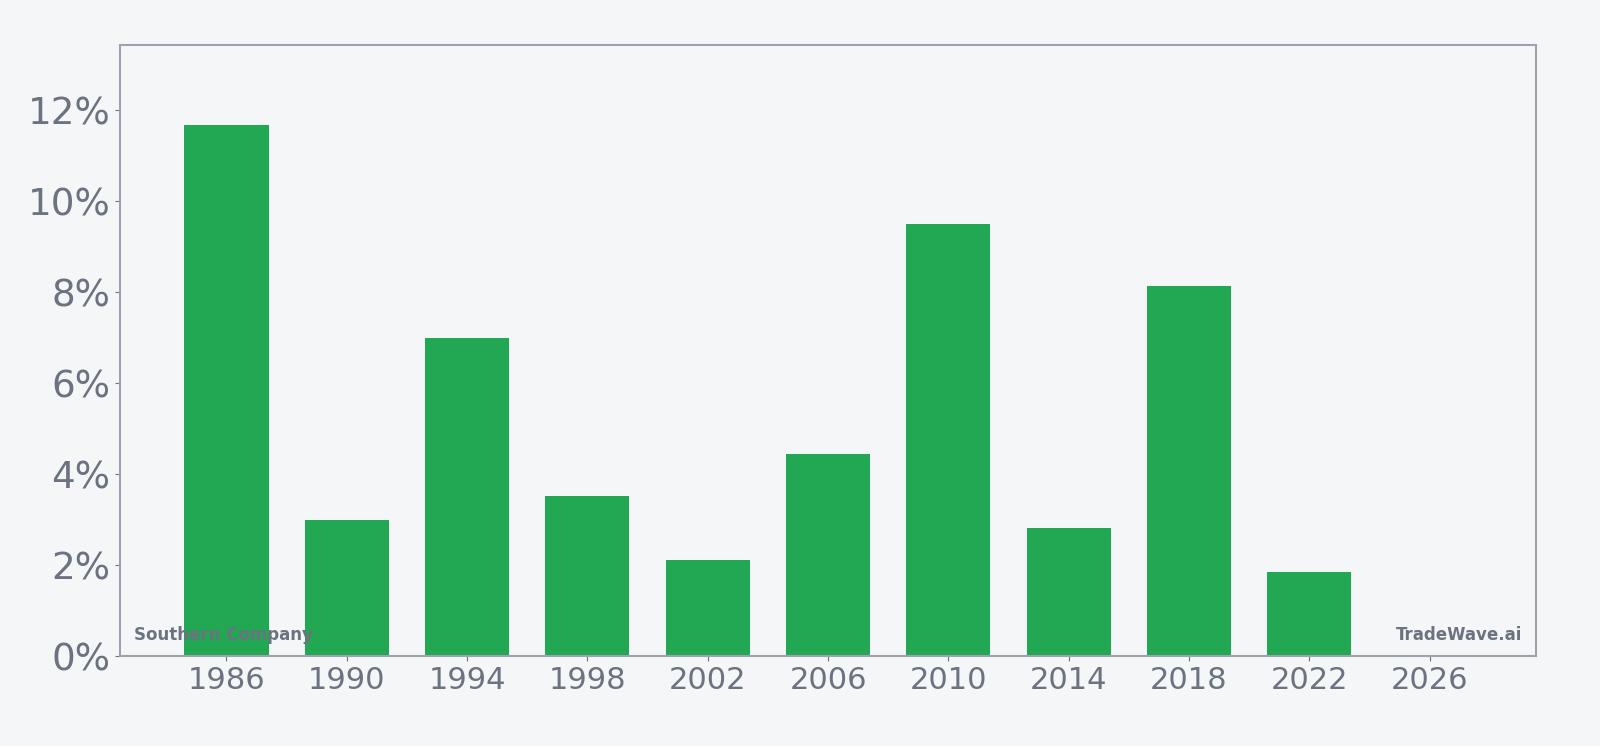
Southern Company has risen in 10 of 10 midterm-year summer windows during this 66-day stretch, with an average gain of 5.41% in winning years.
- 10 for 10 in this window, with Southern Company averaging 5.41% gains in winning years across the last 10 midterm election cycles.
- Seasonal window runs from May 26 for 66 trading days, covering the early summer stretch of midterm election years.
- Percent Profitable is 100%, with 10 winners and 0 losers in the historical sample.
- Cumulative return across all 10 windows totals 68%, with a Sharpe ratio of 1.37 for end-of-window outcomes.
- TradeWave Ratio of 1.52 signals that price has typically traveled meaningfully in the long direction within the window, not just at the close.
- Individual years have still seen sharp drawdowns inside the window, including adverse moves of more than 13% before finishing higher.
According to historical data from TradeWave.ai, this midterm-year summer stretch has behaved very differently from an average month on the calendar for Southern Company, and the current window is already underway.
How has Southern Company (SO) traded in this midterm-year summer window?
Southern Company has posted gains in every one of the last 10 midterm election years during this 66-day window starting May 26, averaging 5.41% per cycle. Shares finished Monday at 94.23, leaving the stock about 3.8% below its 52-week high and roughly 16.1% above its 52-week low, after a modest 2.01% advance over the past month.
Grouping the data by the presidential election cycle matters here because this window only looks at midterm election years, a phase that often brings regulatory noise and rate uncertainty for utilities even as investors lean on the sector for defensive income exposure. Pattern phase and calendar phase are aligned, which means the current setup is directly comparable to the prior 10 midterm-year samples rather than being blended with pre-election or election-year behavior.
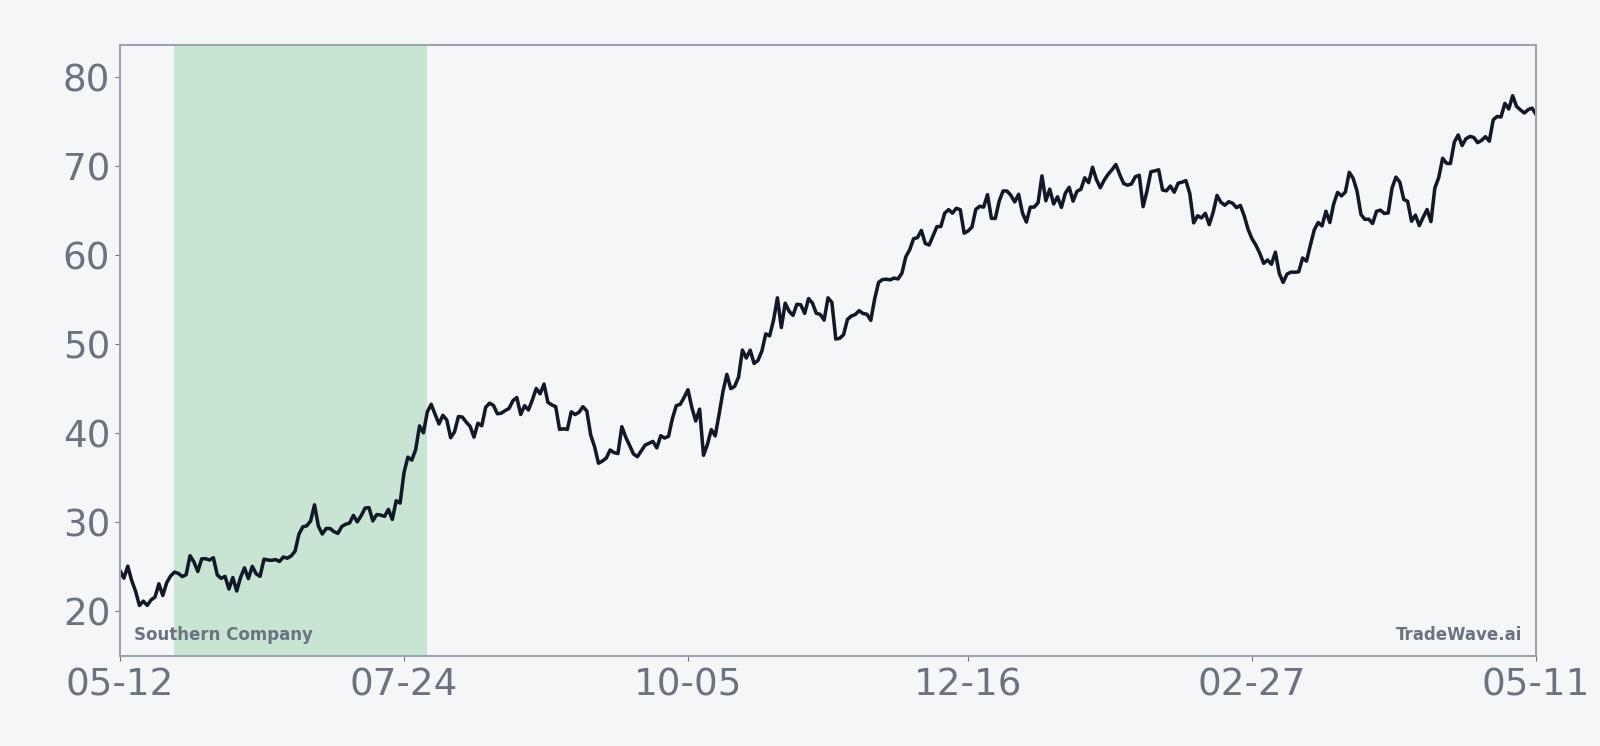
The historical seasonal trend line for this Southern Company trading window shows a steady upward grind rather than a single explosive burst. Gains tend to build over the life of the 66 days, with only brief pauses, which fits a classic utility stock pattern where total return is driven by slow price appreciation on top of dividends. Trend statistics also lean heavily to the long side, with 27 days showing a positive directional bias versus just 3 days skewed lower, and an even stronger 40-to-0 split when the trend is smoothed.
A second view that layers in best and worst intraperiod swings shows how much room the stock has historically had to run or whipsaw inside the window.
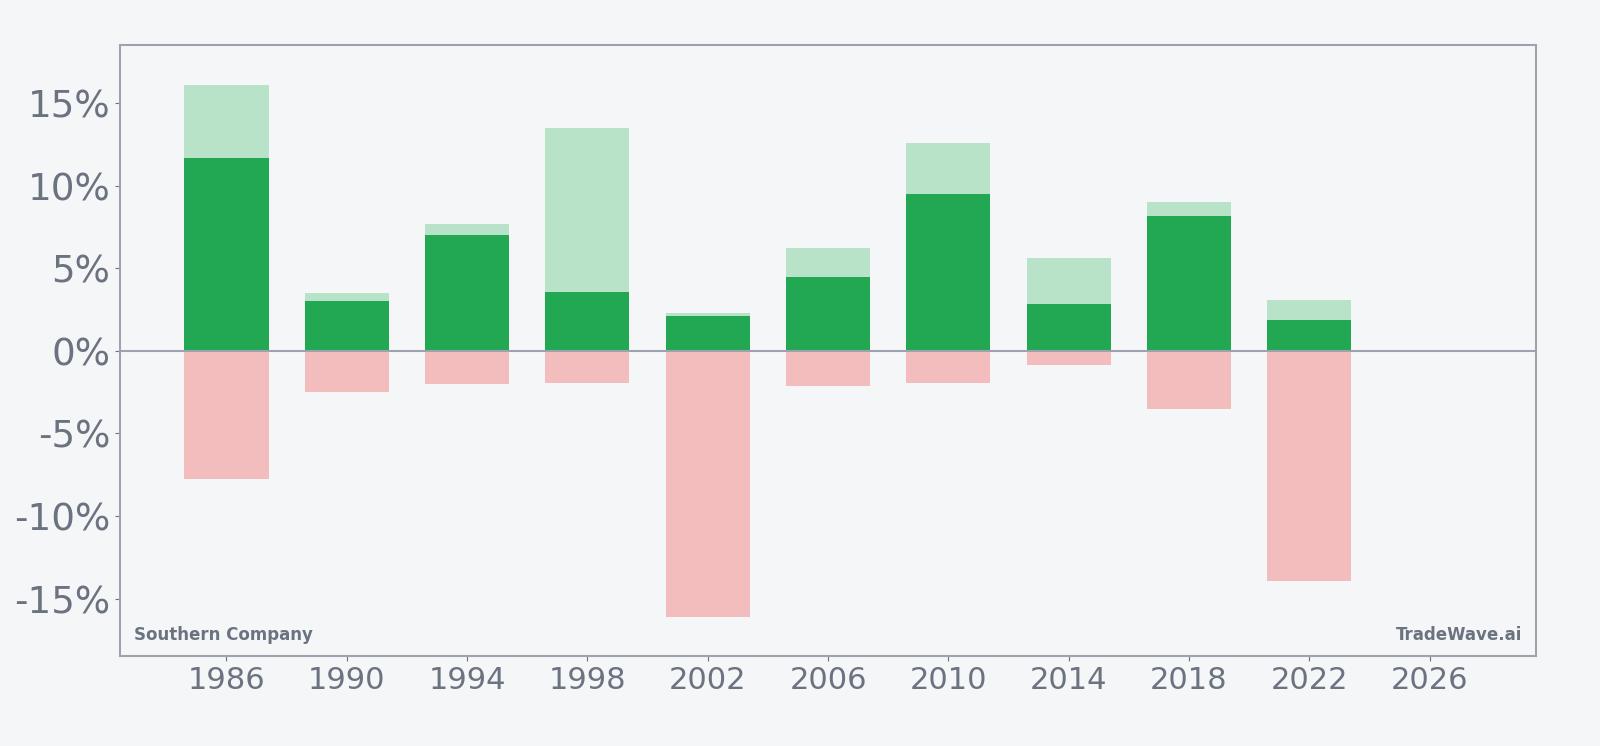
The stacked bar view of net returns, maximum favorable move and maximum adverse move shows that even in winning years, the ride has not always been smooth. In 1998, for example, Southern Company finished the window up 3.53% but at one point had rallied as much as 13.45% from the entry before giving back a chunk of the move, while 2002 and 2022 saw adverse drawdowns of 16.08% and 13.95% inside windows that still closed higher. That mix of solid end-of-window gains and sizable intraperiod swings is consistent with a Trade Direction of long that has worked historically, but with enough volatility to punish weak hands.
The bottom line is simple: 10 for 10. Across four decades of midterm election years, this specific early-summer window has favored long exposure in Southern Company every time in the sample.
Why does Southern Company (SO) follow this seasonal pattern?
One likely driver is the way midyear utility positioning lines up with the policy and rate backdrop in midterm election years, when investors often rotate toward regulated, dividend-paying names as Washington headlines heat up. Analysts also point to the timing of capital spending updates and state-level regulatory decisions, which frequently cluster around midyear and can support sentiment for large electric and gas utilities. The pattern may also reflect institutional portfolio rebalancing, as income-focused managers top up utility exposure heading into the second half of the year.
History does not guarantee future results, and the worst intraperiod drawdowns in this window have been deep even in years that ultimately finished higher.
What is driving Southern Company (SO) today?
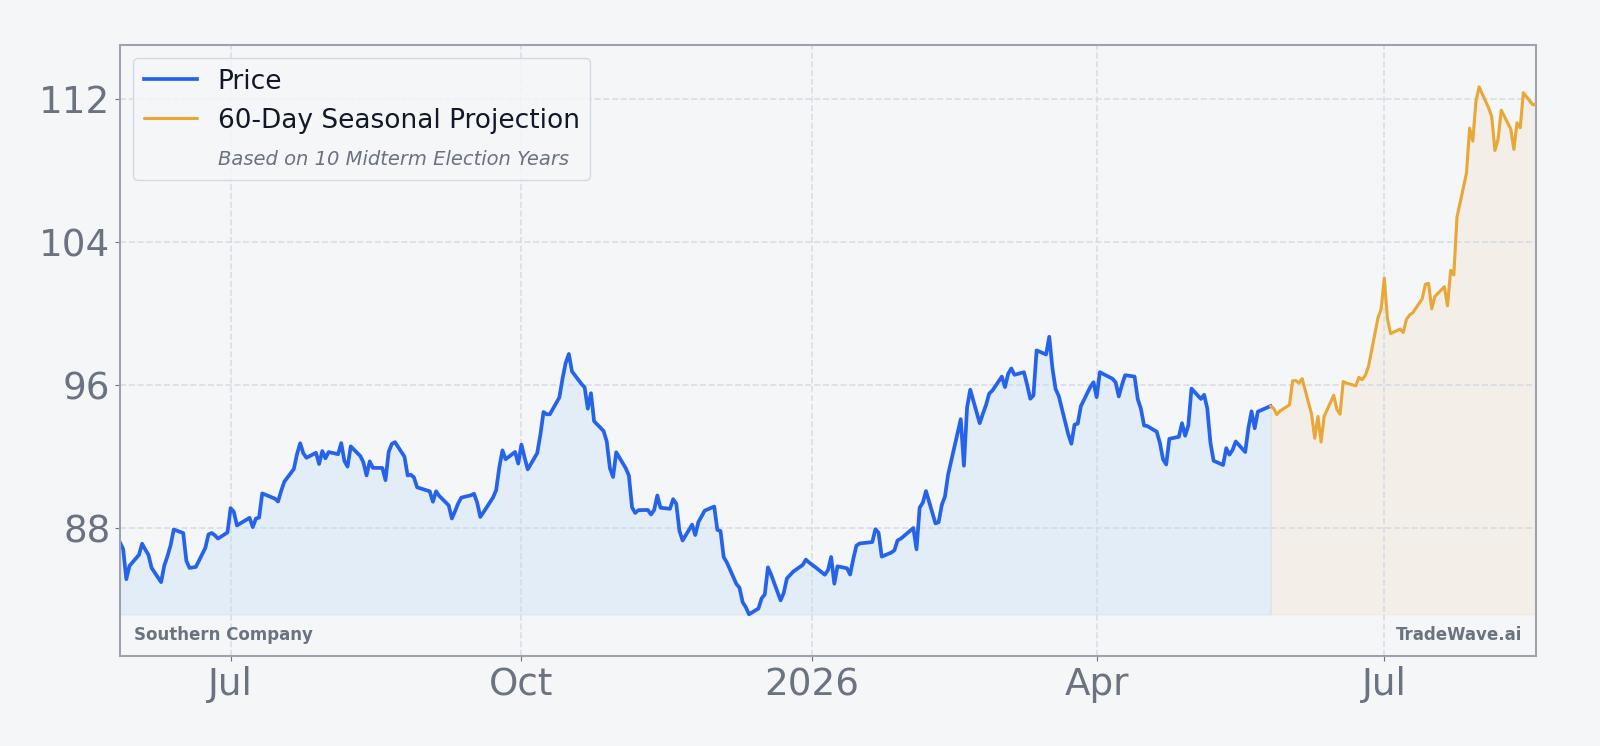
Southern Company closed Monday at 94.23, down 0.32 on the day, a 0.34% slip that still leaves the stock about 3.8% below its 52-week high of 97.95 and roughly 16.1% above its 52-week low of 81.15. The stock has gained 2.01% over the past month, trading modestly above its 50-day moving average of 93.55 on lighter-than-average volume of 2.46 million shares versus a 20-day average of about 5.68 million, a setup that suggests a slow grind higher rather than a momentum spike.
The chart below situates the latest move in its recent multi-month context alongside a 60-day seasonal projection.
From a broader perspective, Southern Company sits in a familiar role as a defensive anchor within the S&P 500, offering regulated earnings and a steady dividend profile that can look attractive when investors are nervous about growth or policy risk. The current midterm election year adds another layer, since utilities often trade as a proxy for expectations around rate policy and infrastructure spending, and any shift in those expectations over the coming weeks will intersect directly with this historically strong seasonal window.
Sources
About this seasonal analysis
Seasonal pattern data is sourced from TradeWave.ai, which analyzes historical price behavior across annual calendar windows going back up to 30 years. Read the full data methodology or the book The 100-Year Pattern by Afshin Moshrefi (2026 edition). Past performance of seasonal patterns does not guarantee future results. This article is for informational purposes only and does not constitute investment advice.