Ford Motor Company (F) Has Dropped in 6 of 6 Midterm June Windows for Shorts
Ford Motor Company is heading toward a mid-June seasonal window that has never favored the bulls in past midterm election years, just as enthusiasm over its new Ford Energy unit pushes the stock near a three-year high.

What is the seasonal pattern for Ford Motor Company (F)?
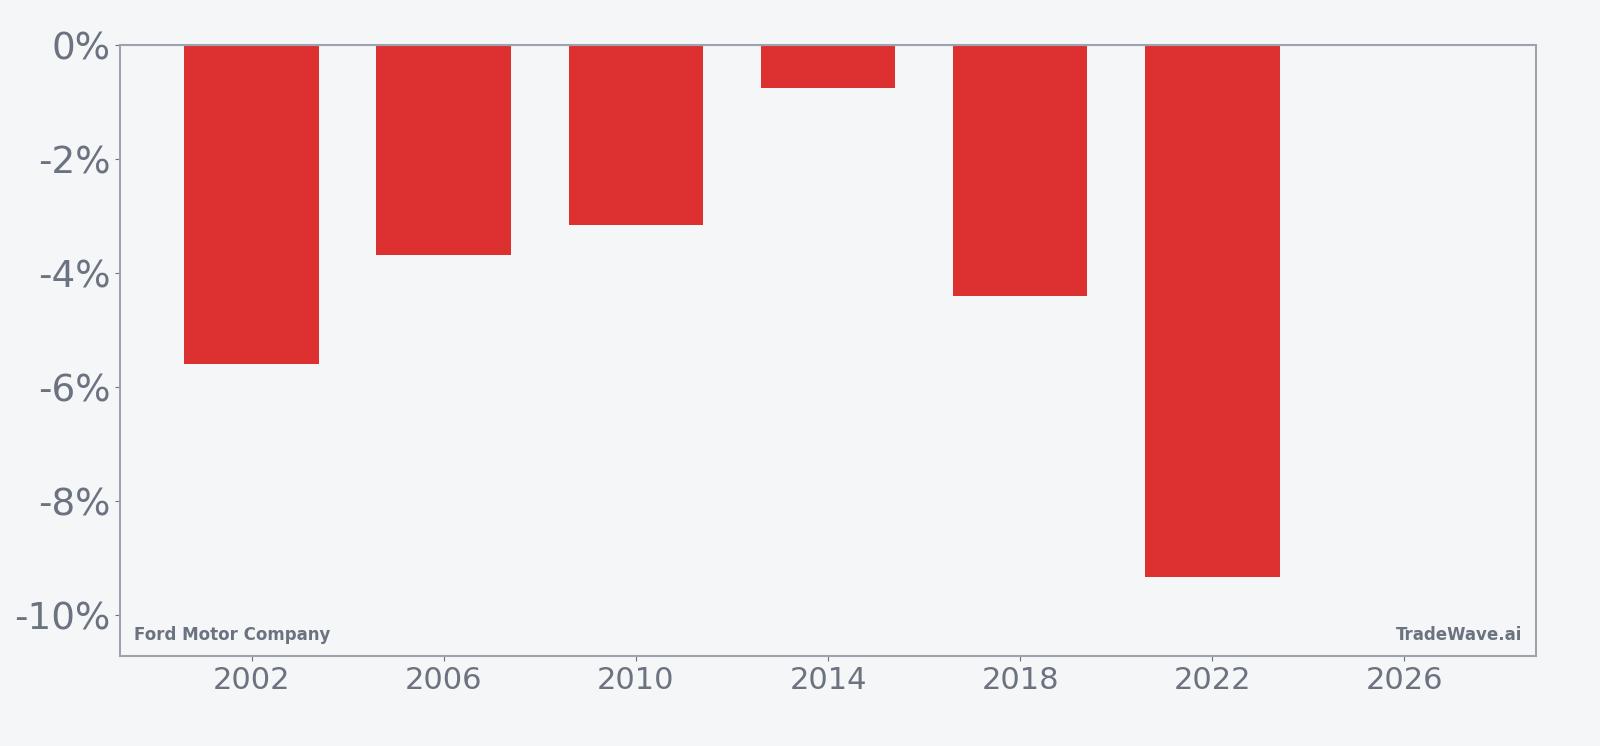
Ford Motor Company has fallen in 6 of 6 midterm-year June windows during this 14-day stretch, with an average gain of 4.49% in winning short trades.
- 6 for 6 in this window for short trades, with average profits of 4.49% across winning years.
- The upcoming 14-day trading window begins on Jun 10, 2026 and is grouped across the last 6 midterm election years.
- Percent Profitable is 100%, with 6 winners and 0 losers for the short-side pattern.
- Individual years have seen net declines between about 0.8% and 9.3% in Ford’s share price during this window.
- Intraperiod swings have been meaningful, with some years showing peak favorable moves above 3% and adverse drawdowns deeper than 8% before finishing lower.
- The pattern aligns with the midterm election year phase, when auto and industrial names often trade through policy and rate uncertainty.
According to historical data from TradeWave.ai, this mid-June stretch has behaved very differently from an average month for Ford, and the next iteration is now less than three weeks away.
How has Ford Motor Company (F) traded in this mid-June window?
Ford Motor Company has declined in every single mid-June window across the last six midterm election years, with short trades averaging 4.49% gains over 14 trading days. The stock last closed at 14.875, up 8.8% on the day and sitting about 0.5% below its 52-week high of 14.95.[8] That combination of a clean 6-for-6 bearish seasonal record and a price pressing against a three-year high gives this upcoming window unusual weight for traders watching the F seasonal trend.
Because this pattern is grouped by the presidential election cycle, it only looks at midterm election years, not every calendar year. That matters for an industrial name like Ford, where policy debates over tariffs, EV credits and labor rules often flare in the middle of a presidential term and can weigh on auto stocks even when the broader market is calm.
The historical seasonal average shows Ford typically starting to soften early in the window, with most of the downside accruing by the second week. That fits a short-bias pattern where favorable years see the stock drift lower rather than collapse, but the cumulative return line still trends steadily negative across the full 14 days.
Year-by-year net returns and intraperiod swings show how consistently this window has leaned bearish for the stock price.
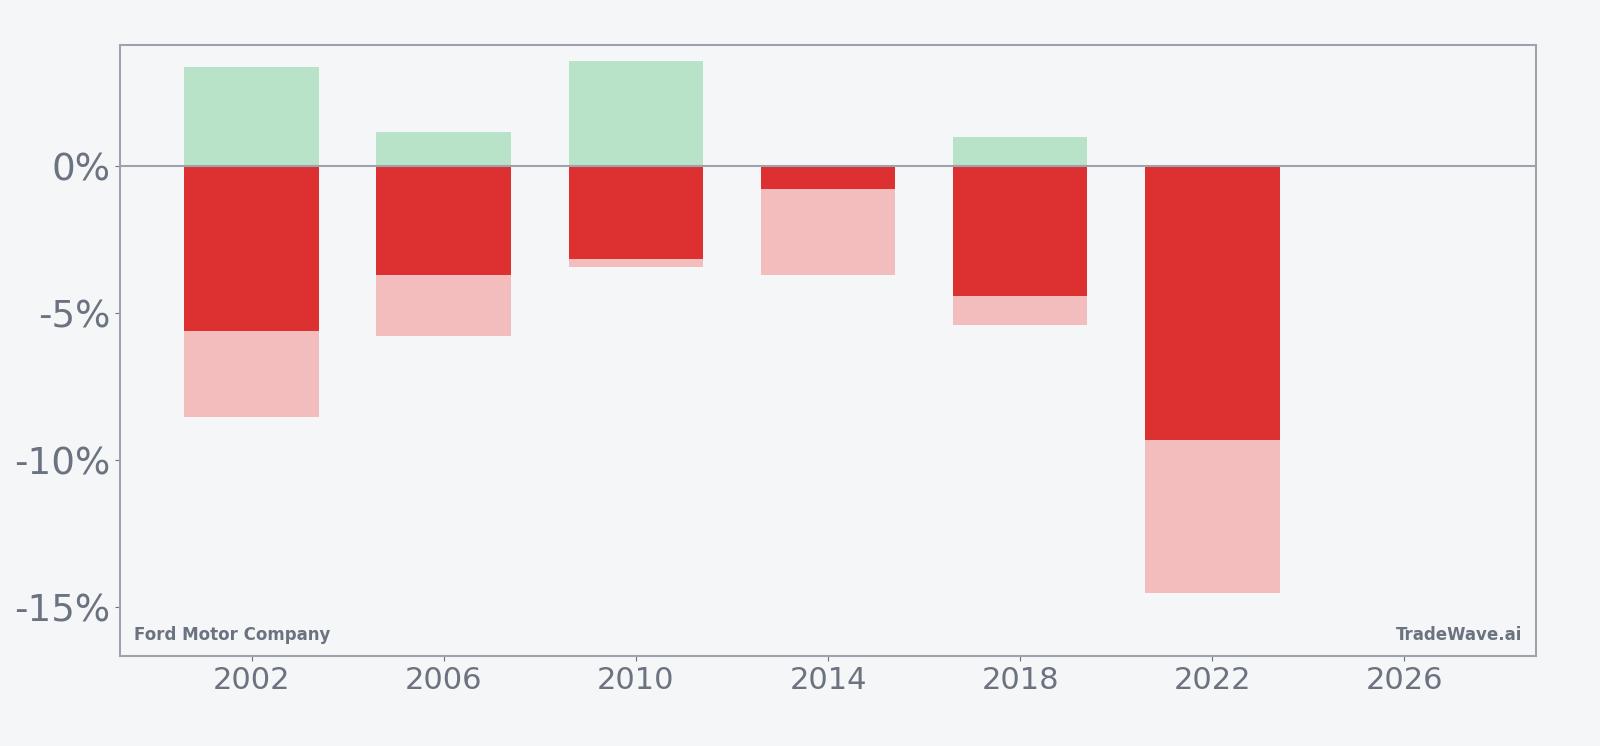
The per-year breakdown shows every midterm-year sample finishing lower, with net drops ranging from 0.76% in 2014 to 9.33% in 2022. In stronger short years like 2002 and 2022, the worst intraperiod drawdowns from the entry reached roughly 8.5% and 14.5% respectively, while the best point-to-peak moves in the trader’s favor topped 3% in several cases. That mix of solid maximum favorable excursion and sizable maximum adverse excursion underlines that this Ford Motor Company trading window has historically been directional but not low-volatility.
The pattern is clear: this mid-June stretch has favored short exposure in 6 of 6 midterm election years, with average short-side gains of 4.49% across the sample.
Why does Ford Motor Company (F) follow this seasonal pattern?
One likely driver is the way midterm election years bunch policy headlines around autos, from emissions rules to EV subsidies, at the same time that summer demand and incentive programs are still taking shape. Analysts have also pointed to institutional portfolio rebalancing in industrials and autos around midyear, as managers adjust exposure ahead of the second-half macro and policy calendar. This mid-June window may reflect that combination of policy uncertainty and sector rotation, which has repeatedly coincided with softer Ford share prices in past midterm cycles.
History does not guarantee future results; even in a clean 6-for-6 pattern, adverse excursions within the window can be large before trades move back in the historical direction.
What is driving Ford Motor Company (F) today?
Ford shares jumped 8.8% on Friday to close at 14.875, leaving the stock about 0.5% below its 52-week high of 14.95 and extending a roughly 20.6% gain over the past month.[8] The move caps a powerful run that began when Ford unveiled its new Ford Energy subsidiary on May 13, pitching the unit as a domestic battery storage supplier for utilities and data centers that can ride the same AI infrastructure wave powering big tech.[7] A week later, Ford landed its first Ford Energy customer, signing a deal with EDF for up to 4 GWh a year of battery storage systems, a contract that reinforced the idea that this is more than a slideware pivot.[2]
Wall Street has taken notice. On May 13, Morgan Stanley highlighted Ford’s partnership with China’s CATL as a way to deliver compliant U.S. energy storage systems for data centers and AI workloads, arguing that the new business could help re-rate a stock long treated as a cyclical automaker rather than an energy and infrastructure play.[6] The excitement has pushed Ford to its highest close in three years, with MarketWatch flagging the stock as the S&P 500’s biggest gainer on the day of the Ford Energy launch and again noting the three-year high on May 22.[7][8]
At the same time, the core auto business still anchors the story. Ahead of Ford’s first-quarter 2026 earnings update on Apr 29, the company guided investors to full-year adjusted EBIT of $8 billion to $10 billion, free cash flow of $5 billion to $6 billion and capital spending of $9.5 billion to $10.5 billion, underscoring the heavy investment cycle behind EVs, software and now grid-scale batteries.[4] That spending profile, combined with a consensus “Hold” rating and a long-standing debate over Ford’s domestic manufacturing footprint, has kept some investors cautious even as the stock rips higher.[1]
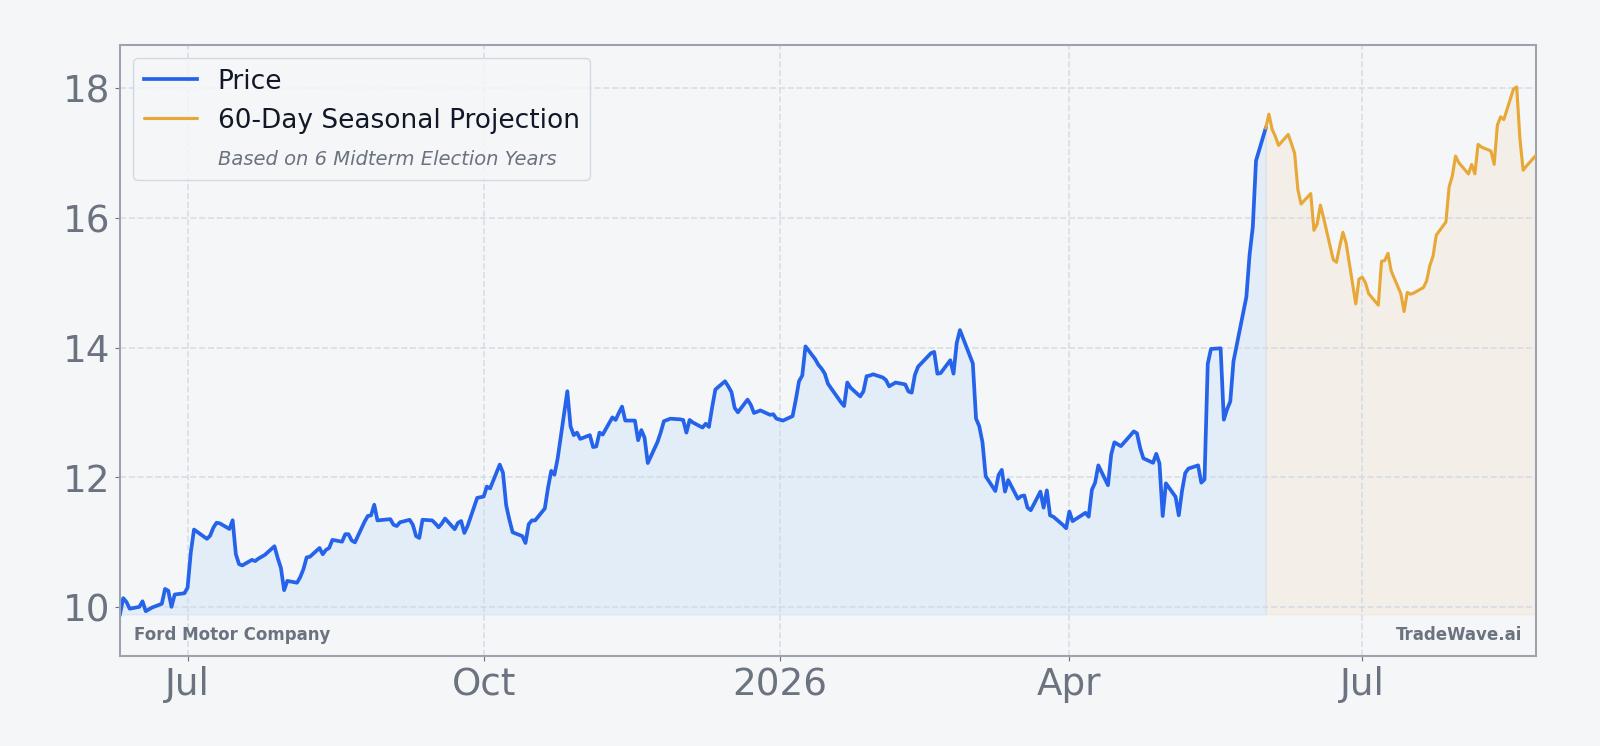
The chart below shows how that narrative shift has played out in price terms, along with a 60-day seasonal projection overlay.
What should traders watch as this Ford seasonal window approaches?
The first marker is timing. The 14-day window tied to the last six midterm election years begins on Jun 10, so any shift from the current uptrend into a flatter or softer tape around that date would be consistent with the historical seasonality. If Ford instead powers straight through the window and holds above the recent 52-week high, that would be a clear break from the past pattern and a sign that the Ford Energy narrative is overwhelming the usual midterm-year drag.
Second, price levels matter. Traders focused on the F seasonal trend will be watching whether the stock can sustain closes above the mid-teens or whether rallies toward the high-14s and low-15s attract selling pressure during the window. A series of lower highs or a quick slide back toward the 50-day moving average, which currently sits near 12.29, would echo prior midterm-year behavior where the stock gave back part of its spring gains.[8]
Finally, the macro and policy calendar could interact with this pattern. Any fresh headlines on EV credits, tariffs, labor negotiations or grid investment during June would land right inside the historical window that has already leaned bearish for Ford. If those catalysts coincide with heavier volume on down days, it would fit the past midterm-year script of policy noise pressuring autos. If they arrive and the stock shrugs them off, it would signal that this cycle’s combination of AI infrastructure exposure and Ford Energy growth is rewriting the usual seasonal playbook.
Sources
- GuruFocus: Ford (F) Faces Pressure for Domestic Manufacturing Shift (Jun 2, 2025).
- CNBC: Ford lands its first customer for energy business (May 18, 2026).
- CNBC: Ford Motor is set to report earnings after the bell (Oct 23, 2025).
- CNBC: Ford Motor is set to report earnings after the bell (Apr 29, 2026).
- CNBC: Ford Motor is set to report results after the bell (Feb 10, 2026).
- Yahoo Finance: Ford shares jump 6% as Morgan Stanley hails CATL-backed energy business (May 13, 2026).
- MarketWatch: Ford’s stock is the S&P 500’s biggest gainer (May 13, 2026).
- MarketWatch: Ford’s stock climbs to highest close in three years (May 22, 2026).
About this seasonal analysis
Seasonal pattern data is sourced from TradeWave.ai, which analyzes historical price behavior across annual calendar windows going back up to 30 years. Read the full data methodology or the book The 100-Year Pattern by Afshin Moshrefi (2026 edition). Past performance of seasonal patterns does not guarantee future results. This article is for informational purposes only and does not constitute investment advice.