Parker Hannifin (PH) Near 52-Week High as 24-Day Midterm Weak Stretch Opens May 31
Parker Hannifin is heading into a 24-day midterm-election-year seasonal window that has usually rewarded short sellers, just as the stock trades near its 52-week high.

What is the seasonal pattern for Parker Hannifin (PH)?
Parker Hannifin has fallen in 9 of 10 midterm-election-year windows starting May 31, with an average 5.99% gain for short positions in winning years.
- 9 for 10 in this window, with short trades averaging 5.99% gains in winning years.
- Seasonal setup is bearish for the stock, running 24 trading days from May 31 in midterm election years.
- Percent Profitable is 90%, with 9 winning short years and just 1 losing year across the sample.
- Including all years, the average outcome is a 5% move in favor of the short side over the window.
- Historical best and worst intraperiod swings show sizable rallies and drawdowns before the window closes, underscoring volatility risk.
- The pattern sits in the mid part of the midterm election year, when policy uncertainty and industrial cyclicals often trade more defensively.
According to historical data from TradeWave.ai, this late-May window for Parker Hannifin behaves very differently from an average month on the calendar. The next section walks through how that pattern has played out across the last ten midterm election years.
How has Parker Hannifin (PH) traded in this midterm-year window?
Parker Hannifin has declined in 9 of the last 10 midterm-election-year windows starting May 31, a stretch that has historically favored short positions over the following 24 trading days. Today the stock closed at 867.39, leaving it about 15.8% below its 52-week high of 1,030.30 but still far above its 52-week low of 626.24, so any seasonal pullback would be starting from elevated levels.
Because this pattern is grouped by the presidential election cycle, it reflects how Parker Hannifin has behaved specifically in the midterm election year, not across random calendar years. That matters for an industrial name tied to capital spending and infrastructure, since midterm years often bring policy debates on budgets, regulation and defense that can temporarily hit order books and valuations.
The trade direction for this setup is short, and the historical record backs that stance. Across the last ten midterm election years, 9 windows ended with the stock lower, while only 1 produced a loss for short sellers. In winning years, the average move in favor of the short side was 5.99%, while including all years the average outcome still leans 5% in favor of shorts over the 24 trading days.
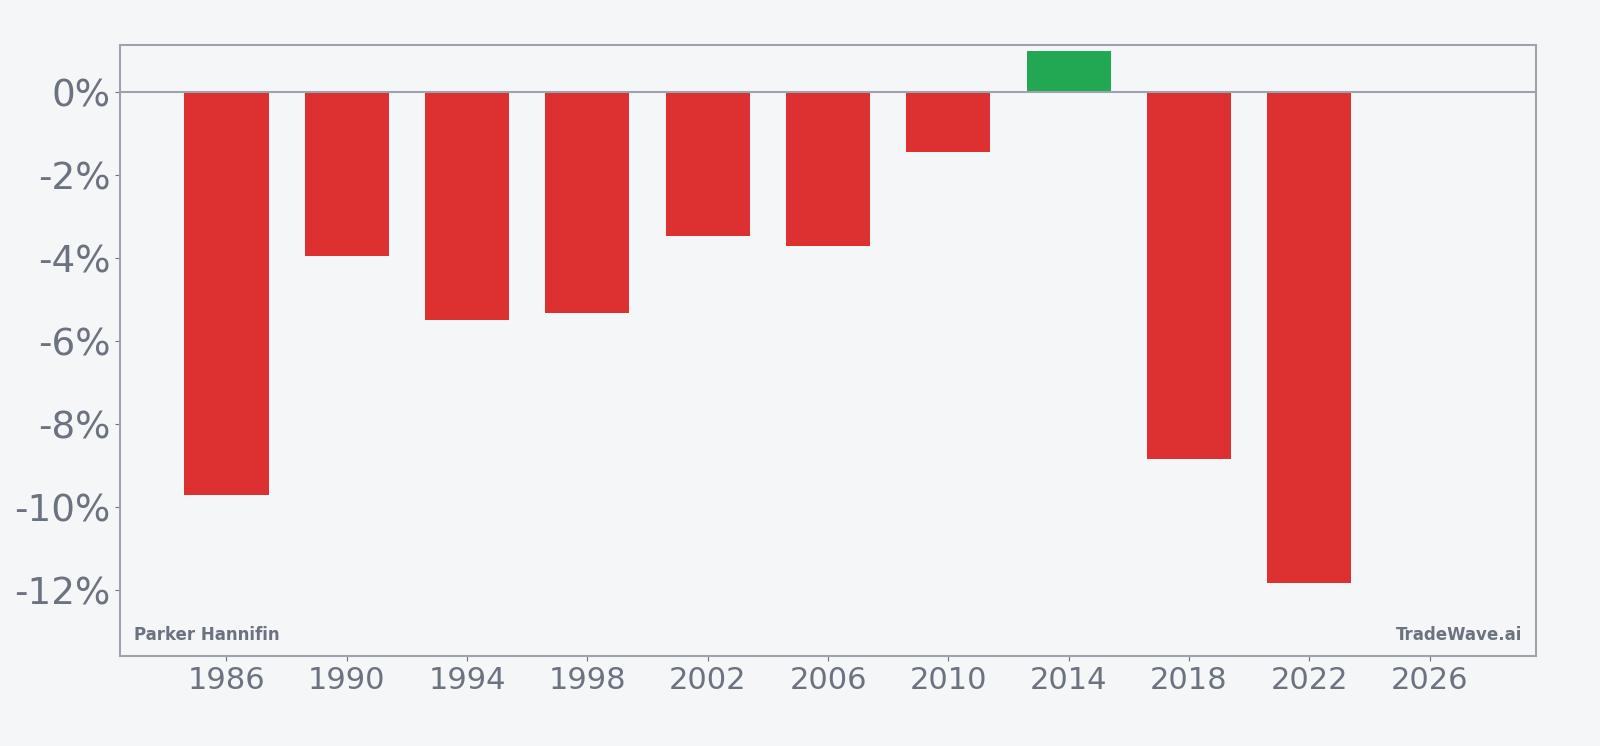
The per-year table shows that the strongest short-friendly years were 2022 and 1986, when the stock fell 11.83% and 9.72% respectively from entry to exit. Even the milder down years, such as 2010 with a 1.45% decline, still moved in the trade direction by the close. The lone losing year for shorts was 2014, when Parker Hannifin rose 0.98% over the window, a relatively modest squeeze compared with the larger declines in other cycles.
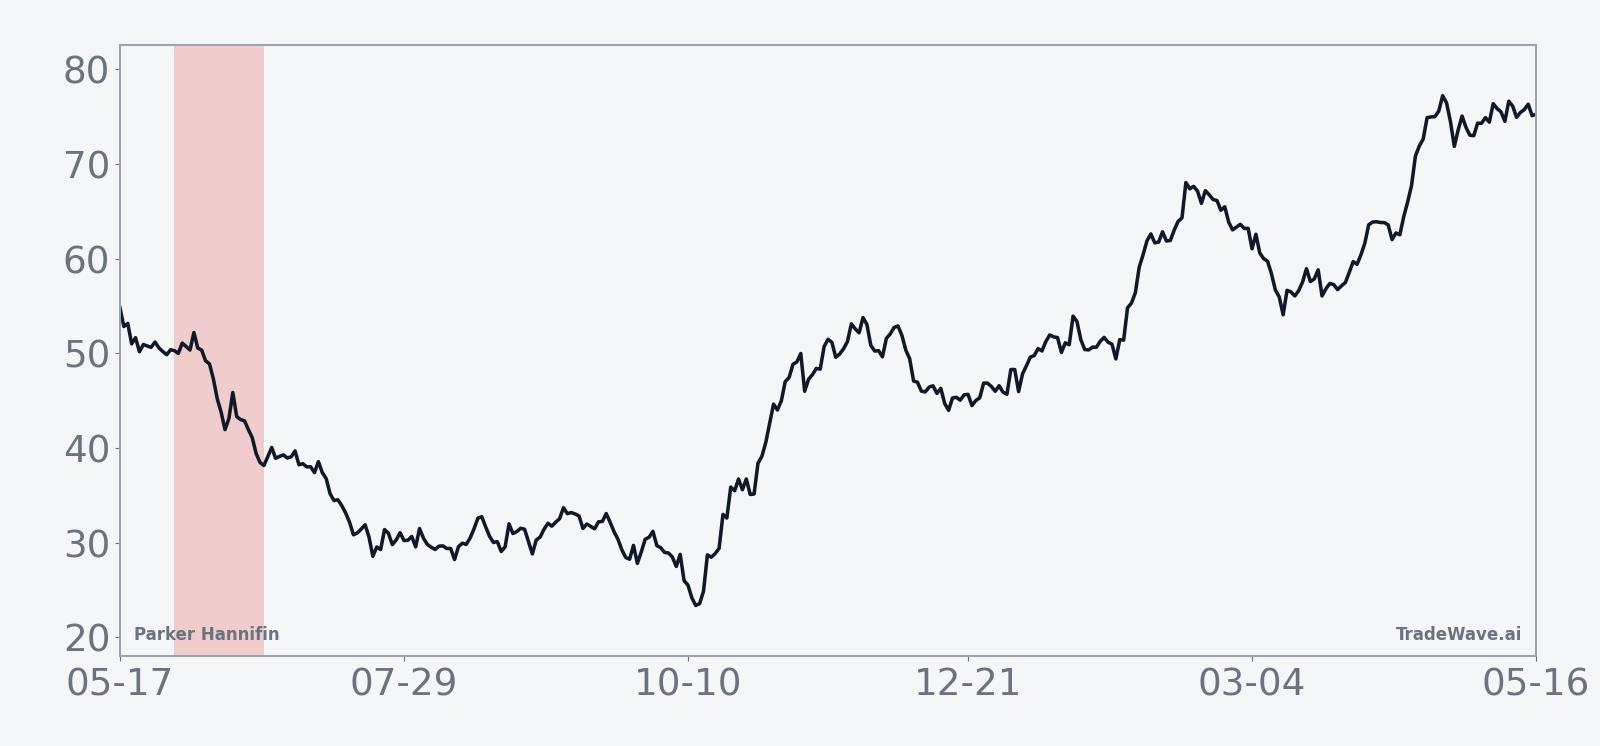
The historical seasonal trend chart suggests that weakness has tended to build gradually rather than in a single air pocket. On average, Parker Hannifin drifts lower across much of the 24-day span, with the cumulative line stepping down in stages instead of collapsing all at once. That profile fits a pattern of steady de-risking or position trimming rather than a one-off shock.
A second view combines net results with the best and worst intraperiod swings to show how far the stock has typically traveled inside the window.
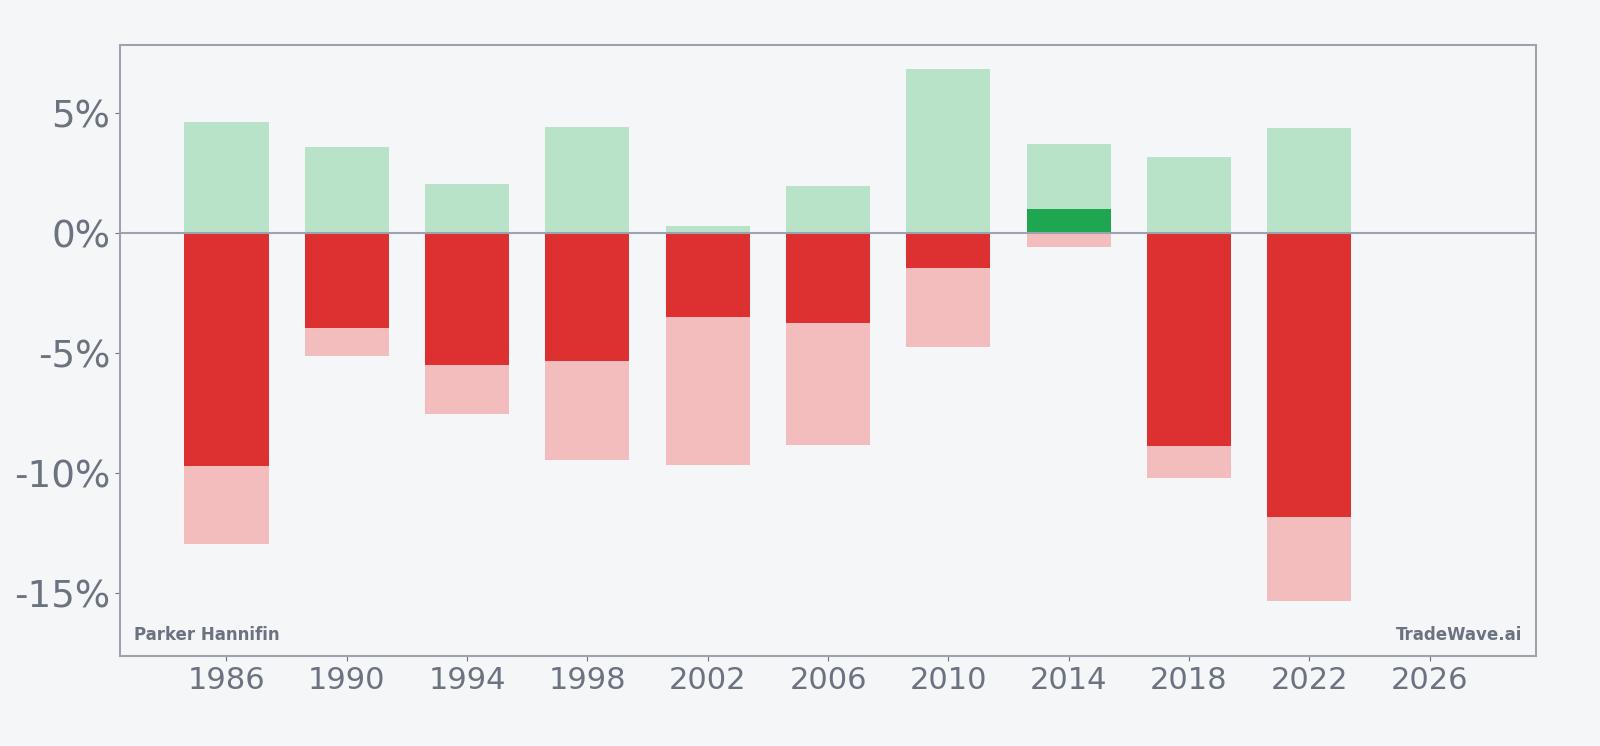
The combined net, maximum favorable move and maximum adverse move bars show that even in years where the short trade ultimately worked, the stock often staged sizable rallies inside the window. For example, in 2022 the best intraperiod move against the short was a 4.38% rally before the decline deepened, while the worst drawdown in favor of the short reached 15.33%. That mix of large favorable and adverse excursions is consistent with a high-variance window where timing and risk management matter as much as direction.
History does not guarantee future results, and maximum adverse moves have at times been large even in years that finished in the trade direction.
Why does Parker Hannifin (PH) follow this seasonal pattern?
One likely driver is the way industrial spending and order visibility tighten in the middle of the midterm election year, when Washington budget fights and regulatory debates can slow capital decisions. Analysts often point to institutional portfolio repositioning around this time, as managers rebalance exposure to cyclical industrials ahead of the second-half policy calendar. For a diversified motion and control supplier like Parker Hannifin, that combination of macro uncertainty and portfolio rotation may translate into a recurring pocket of selling pressure in late May and June of midterm years.
What is driving Parker Hannifin (PH) today?
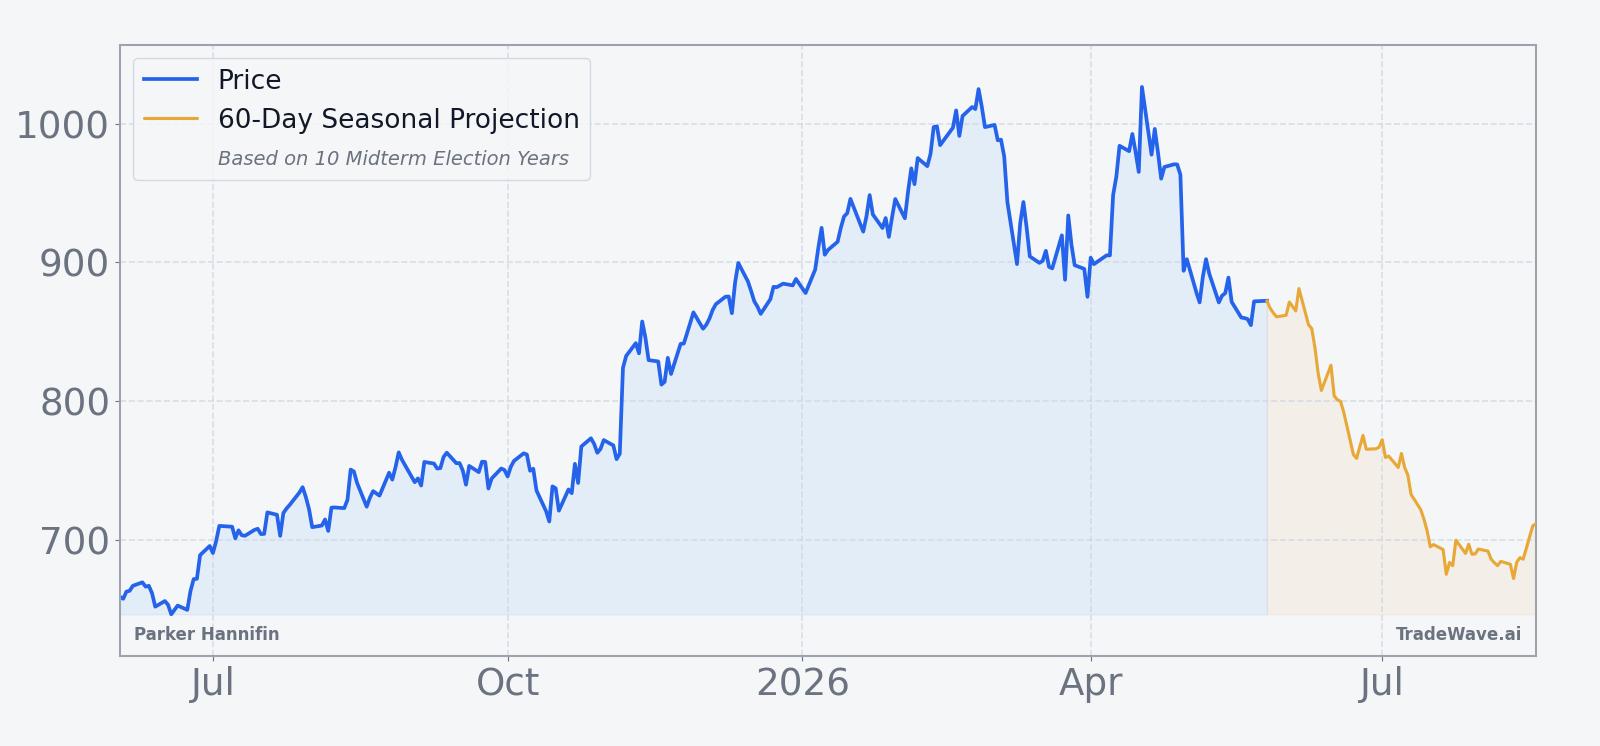
Parker Hannifin finished Tuesday at 867.39, up a fraction on the day and roughly 10.5% below its level a month ago, after a pullback from this year’s highs. The stock is trading above its 50-day moving average of 912.27 and on lighter-than-average volume of about 494,000 shares versus a 20-day average near 834,000, suggesting the recent consolidation has come with reduced participation rather than heavy distribution.
The chart below situates the latest move in its recent multi-month context alongside a 60-day seasonal projection.
What should traders watch in this Parker Hannifin (PH) window?
With the midterm-year window set to open on May 31, the first thing to watch is how Parker Hannifin behaves around the 900 to 920 zone near its 50-day moving average. A failure to reclaim that band as the window begins would be consistent with the historical pattern of steady midterm-year pressure, while a decisive break higher would look more like the rare 2014-style squeeze against shorts.
Second, intraday swings will matter as much as closing prices. Past windows have seen both sharp rallies and deep drawdowns inside the 24-day span, so traders will want to track whether early bounces are being sold into or whether dips are attracting fast buying. If the stock starts posting repeated downside days with only shallow intraday recoveries, that would echo the stronger short-friendly years like 2022 and 1986.
Finally, the broader policy calendar could shape how this midterm-year pattern plays out. Any headlines around infrastructure funding, defense appropriations or industrial regulation in June would likely feed directly into sentiment for Parker Hannifin, potentially amplifying the existing historical bias. If the stock can hold firm through that backdrop and the seasonal window, it would mark a clear break from the last ten midterm cycles and signal that the current uptrend is overpowering the usual election-year rhythm.
Sources
About this seasonal analysis
Seasonal pattern data is sourced from TradeWave.ai, which analyzes historical price behavior across annual calendar windows going back up to 30 years. Read the full data methodology or the book The 100-Year Pattern by Afshin Moshrefi (2026 edition). Past performance of seasonal patterns does not guarantee future results. This article is for informational purposes only and does not constitute investment advice.