Thor Industries (THO) Has Dropped in 10 of 10 Midterm Windows Starting May 27
Thor Industries is trading just above its 52-week low as it approaches a midterm-election-year seasonal window that has historically favored the short side for 120 days.

What is the seasonal pattern for Thor Industries (THO)?
Thor Industries has fallen in 10 of 10 midterm-election-year windows starting around May 27, with an average gain of 12.01% in winning years for short positions.
- 10 for 10 in this window, with short trades averaging 12.01% gains across the last 10 midterm election years.
- Seasonal window starts May 27 and runs for 120 trading days, targeting the heart of the midterm-year summer and early fall.
- Percent Profitable is 100%, with 10 winners and 0 losers for the short-side pattern in this Thor Industries trading window.
- Average profit of 12.01% for shorts reflects sizable historical declines in THO during this specific midterm-year seasonal pattern.
- Individual years have seen adverse moves against the trade of more than 20%, so intraperiod drawdowns can be sharp even in winning setups.
- The THO seasonal trend in this window lines up with broader midterm-year volatility, making this a key stretch for RV and leisure sector risk management.
According to historical data from TradeWave.ai, this upcoming midterm-year stretch has behaved very differently from an average summer for Thor Industries. The next section walks through how that election-cycle seasonality has played out in prior decades.
How has Thor Industries (THO) traded in this midterm-year window?
Thor Industries has declined in all 10 midterm-election-year windows starting around May 27, with short positions averaging a 12.01% gain over 120 trading days. Shares finished Thursday at 75.73, up 1.3% on the day and sitting about 6.0% above the 52-week low of 70.56 while still far below the 52-week high of 122.83.
The presidential election cycle matters here because this pattern only looks at the last 10 midterm election years, not every calendar year. Midterm years often feature policy uncertainty, shifting fiscal priorities and choppy risk appetite, which can hit cyclical names like Thor Industries harder than broad benchmarks.
This seasonal window begins on May 27 and spans 120 trading days. Historically, during this period, Thor Industries has tended to drift lower, which is favorable for the short trade direction embedded in this pattern. Percent Profitable is 100%, with 10 winners and 0 losers, so every midterm-year sample in this THO seasonal trend has delivered a net decline by the end of the window.
The average profit of 12.01% reflects the mean percentage gain for short positions across those 10 years, while the median profit of 11.32% shows that typical outcomes have been clustered near that double-digit level. The cumulative return of 208% for the strategy across the sample underscores how consistently this RV and leisure stock has weakened in this specific midterm-year slice.
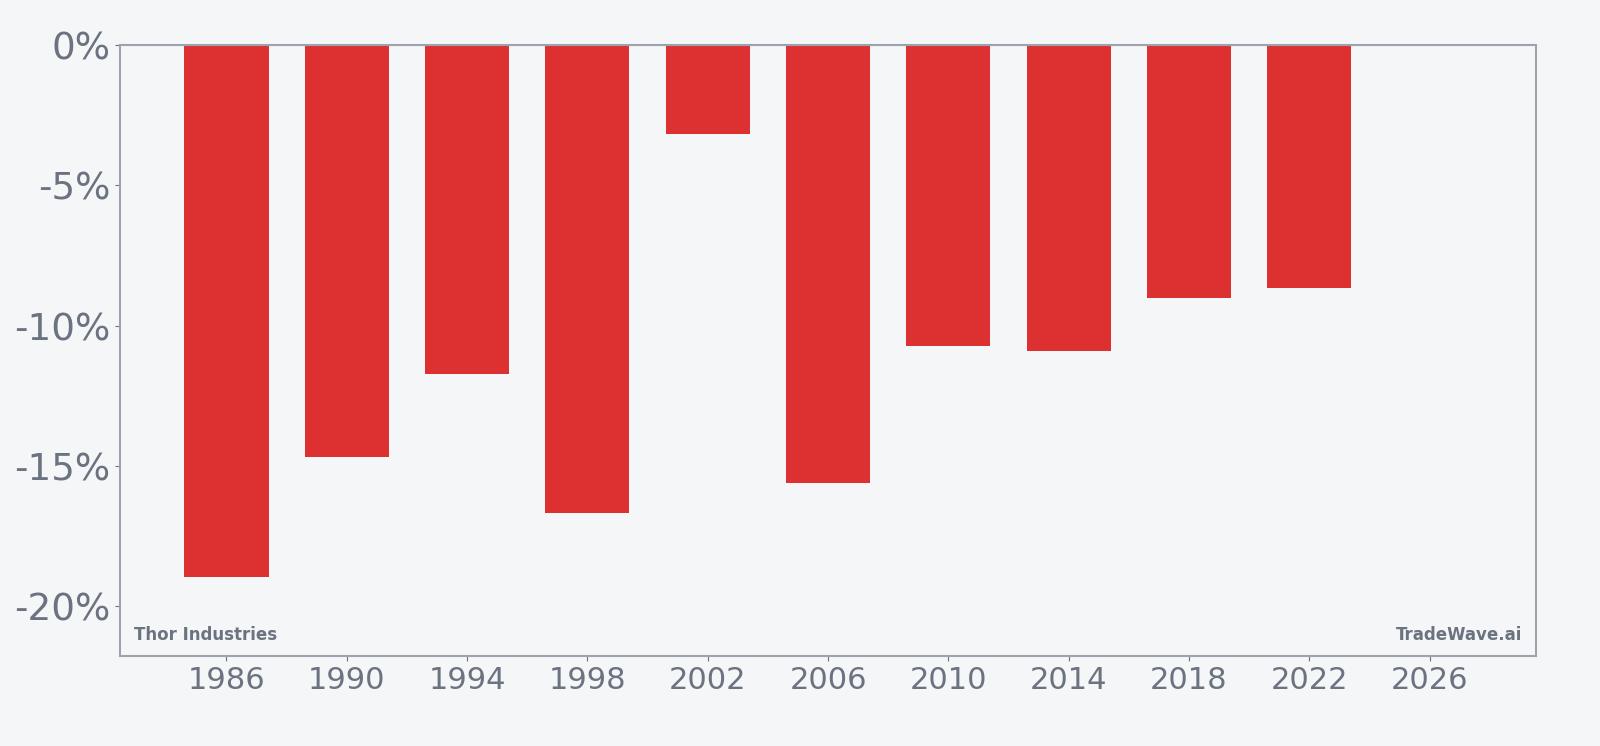
Looking at individual years, 1986 stands out as one of the strongest for shorts, with a net return of about 18.94% as THO fell from an entry price of 1.006 to 0.8155. On the milder side, 2002 still produced a profitable short outcome of 3.17%, but that year also carried one of the deepest intraperiod drawdowns, with the stock moving as much as 29.52% against the trade before finishing lower.
The MFE and MAE profile shows why this window commands respect. In 2022, for example, the maximum favorable move for shorts reached 26.25%, while the worst adverse move was 11.58%, illustrating that even winning years can feature sharp countertrend rallies before the pattern reasserts itself. Several earlier cycles, including 1994 and 2010, saw adverse excursions of more than 20% and 30% respectively, highlighting the potential for painful squeezes inside an ultimately profitable short window.
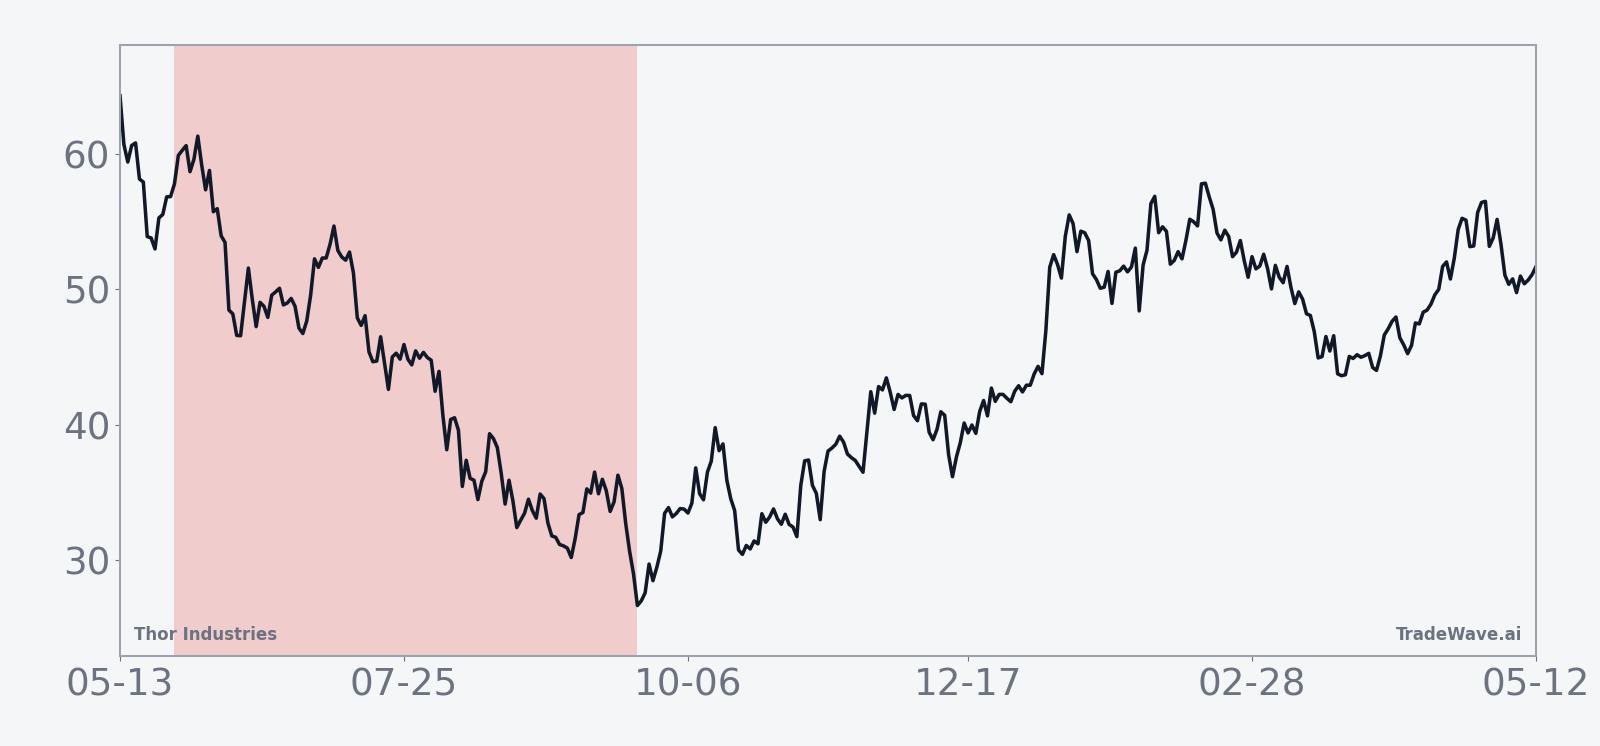
The historical seasonal average suggests that much of the downside for THO in this window has tended to accrue gradually rather than in a single shock. The curve slopes lower over the full 120 days, with some mid-window choppiness that lines up with the large MAE readings in several years.
A stacked view of net returns alongside best and worst intraperiod moves shows how often rallies and drawdowns have coexisted inside this bearish seasonal stretch.
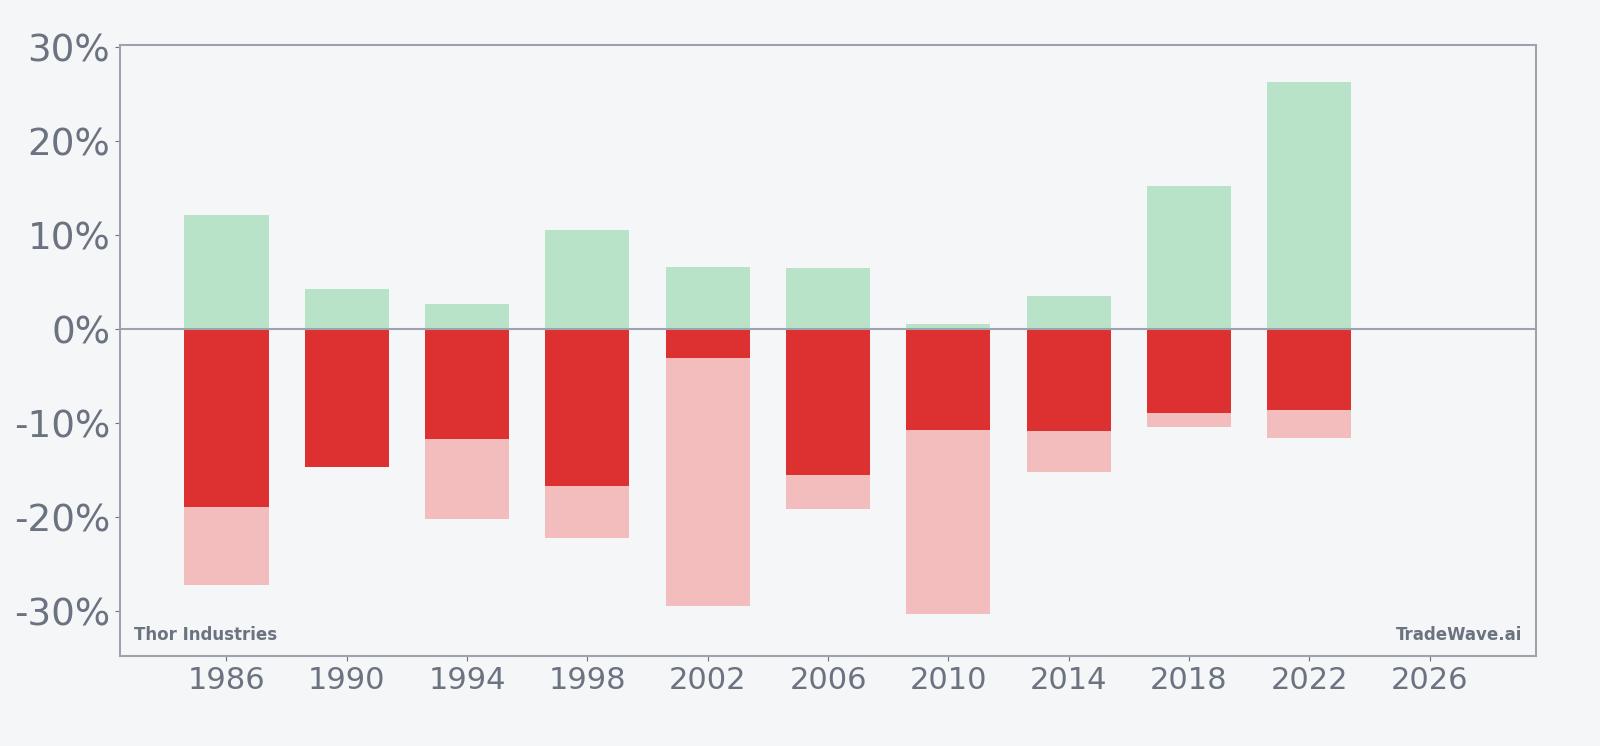
The stacked net, MFE and MAE bars make the pattern clear: shorts have historically had room to work, but they have also had to survive sizable squeezes along the way. Add it up and you get a 10-for-10 record for the short side in this midterm-year window, with double-digit average gains but plenty of volatility inside the path.
History does not guarantee future results; adverse excursions can be large even in winning windows, and traders can still lose money if timing or risk management is off.
Why does Thor Industries (THO) follow this seasonal pattern?
One likely driver is the way midterm election years intersect with the RV demand cycle and dealer inventory management. Analysts often point to summer travel spending, fuel prices and financing costs as swing factors for big-ticket leisure vehicles, which can make midyear guidance resets more common. This pattern may also reflect institutional portfolio repositioning around policy uncertainty, as investors trim cyclical exposure like Thor Industries while they wait for clearer signals on rates, consumer strength and fiscal priorities.
What is driving Thor Industries (THO) today?
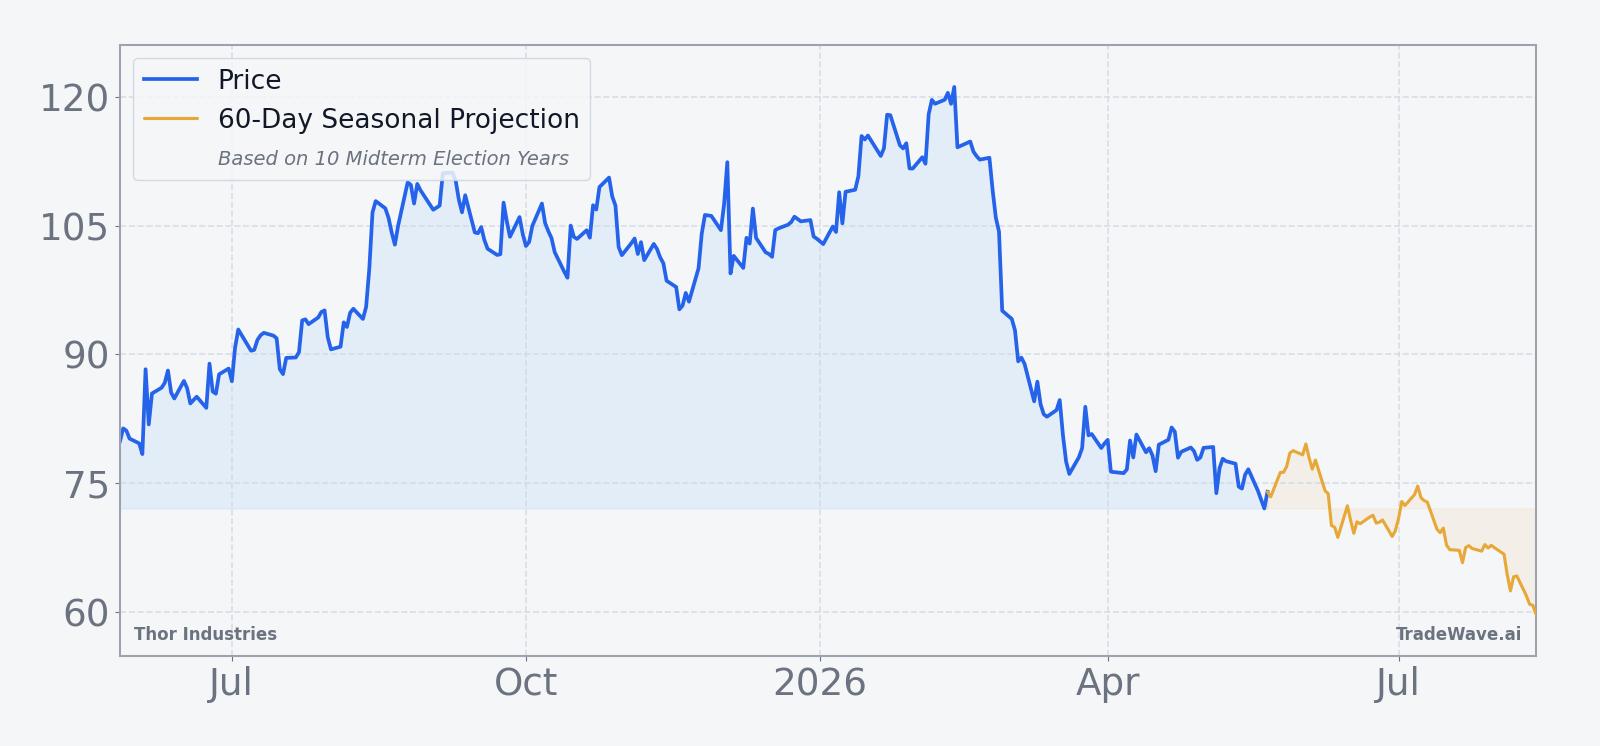
Thor Industries closed Thursday at 75.73, up 0.97 on the day for a 1.3% gain, on volume of about 622,556 shares versus a 20-day average of roughly 553,388. The stock has dropped about 4.17% over the past month and trades well below its 52-week high of 122.83, leaving it about 6.0% above the 52-week low of 70.56 as it heads into this historically weak midterm-year seasonal window.
The chart below situates the latest move in its recent multi-month context alongside a short-term seasonal projection.
What should traders watch in this Thor Industries seasonal window?
First, the calendar: the 120-day window starting May 27 runs through much of the summer and into the early fall, overlapping key periods for RV orders, dealer inventory decisions and macro data on consumer spending. If THO starts to roll over in late May or June and stays heavy on rallies, that would be consistent with the historical seasonality; a sustained break higher that holds above recent highs would contradict the pattern and signal that this midterm-year may be different.
Second, price levels matter. The 70.56 area, which marks the 52-week low, is the first line to watch on the downside; a decisive break with expanding volume would fit the historical short-side bias. On the upside, traders will be watching whether the stock can reclaim and hold above the 50-day moving average near 78.09, which would suggest buyers are willing to lean against the seasonal headwind.
Third, macro and policy catalysts could shape how this midterm-year pattern plays out. Data on consumer confidence, employment and interest rates will feed directly into expectations for discretionary spending on RVs and travel, while any shifts in fiscal policy or regulation affecting manufacturing and credit availability could either reinforce or blunt the usual midterm-year volatility. If those catalysts line up with the historical pattern, the 120-day window could again be a challenging stretch for longs; if they break the script, THO’s behavior in this window will be an important tell for how much weight to give this particular seasonal trend in future cycles.
Sources
About this seasonal analysis
Seasonal pattern data is sourced from TradeWave.ai, which analyzes historical price behavior across annual calendar windows going back up to 30 years. Read the full data methodology or the book The 100-Year Pattern by Afshin Moshrefi (2026 edition). Past performance of seasonal patterns does not guarantee future results. This article is for informational purposes only and does not constitute investment advice.