9-of-10 Losing Midterm Windows: Valero Energy (VLO) Nears an 8-Day Stretch Priced for Shorts
Valero Energy is heading into an early-June seasonal window that has usually meant short-term downside, even as the stock trades just below record highs.

What is the seasonal pattern for Valero Energy (VLO)?
Valero Energy has fallen in 9 of 10 midterm-election-year windows starting around Jun 3, with an average 4.4% gain for the short side in winning years.
- 9 for 10 in this window, averaging 4.4% gains in winning years for short positions.
- Percent Profitable is 90%, with 9 winners and 1 loser across the last 10 midterm election years.
- Avg Profit is 4.4% for winning years, while Avg Profit - All, including the lone losing year, is still 4%.
- The trade direction is Short, so years with negative stock returns have historically been favorable for this pattern.
- Intraperiod swings have been meaningful, with several years showing deep drawdowns before finishing as profitable shorts.
- The upcoming 8-day window beginning Jun 3 sits in the mid part of the midterm election year, a phase that often brings choppy trading for cyclicals.
According to historical data from TradeWave.ai, this early-June stretch has behaved very differently from an average month for Valero Energy, and the next iteration is just days away.
How has Valero Energy (VLO) traded in this early-June window?
Valero Energy has dropped in 9 of the last 10 midterm-election-year windows that start around Jun 3 and run for eight trading days, making this one of its most consistently bearish short-term patterns. Shares finished Friday at $246.49, up 2.2% on the day and about 6.2% below the 52-week high of $262.89.[2] That combination of a strong longer-run uptrend and a historically weak early-June pocket is what has short-term traders’ attention.
The presidential election cycle matters here because this pattern only looks at the last 10 midterm election years, not every single year on the calendar. Midterm years often bring policy uncertainty, shifting expectations for regulation and fuel standards, and position shuffling across energy stocks, which can create short, sharp air pockets in names that have otherwise been strong.
The historical seasonal average shows a fairly steady downward drift across the eight days, which lines up with the short trade direction. Losses for the stock, which are gains for the short, tend to build gradually rather than in a single gap, suggesting that pressure often persists across most of the window instead of reversing quickly.
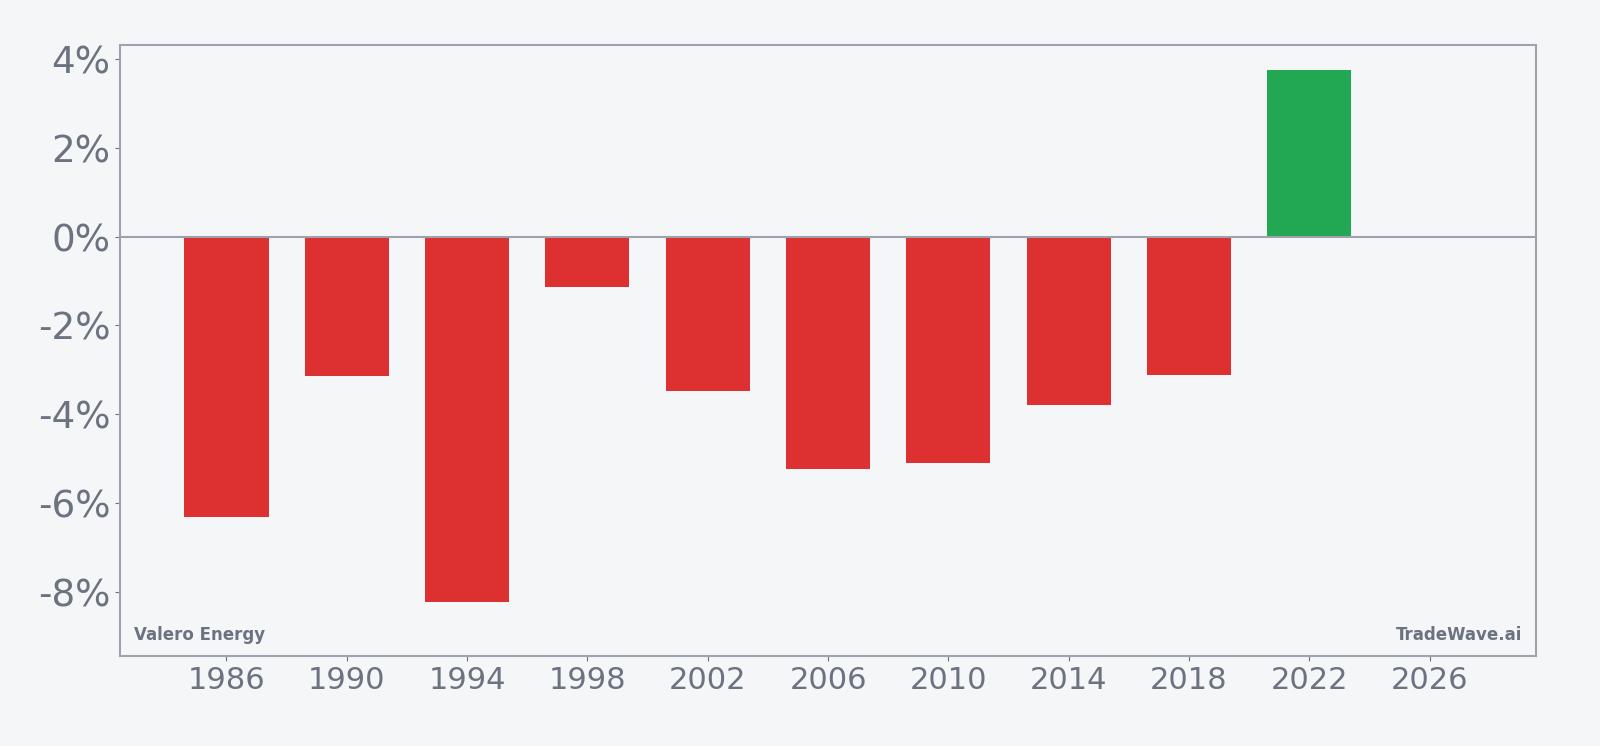
Year-by-year bars that combine net results with peak run-ups and worst drawdowns show how much the stock has typically moved inside the window.
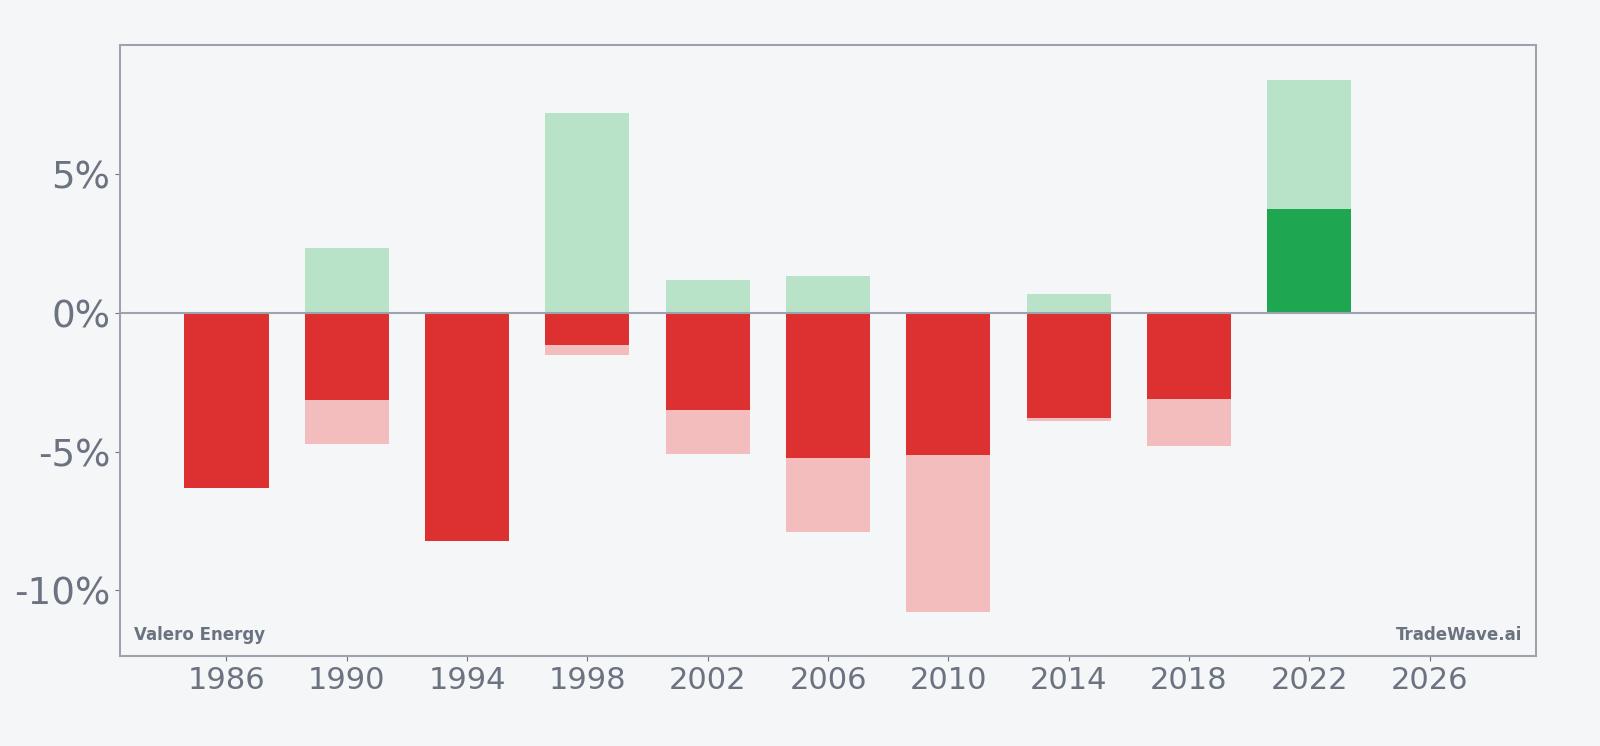
The per-year breakdown shows that the strongest short years, such as 1994 with a 8.23% drop and 2010 with a 5.11% decline, also carried sizable intraperiod drawdowns where the stock moved against the short before rolling over. The lone losing year for the pattern, 2022, saw Valero rally 3.76% with a maximum favorable move of 8.41% for longs, underscoring that a powerful uptrend can overwhelm even a strong seasonal tendency. Add it up: across ten midterm-election-year samples, this short window has delivered a 41% cumulative return for the strategy, but it has not been a one-way street.
History does not guarantee future results, and maximum adverse moves inside the window have at times been large even in years that finished as profitable shorts.
Why does Valero Energy (VLO) follow this seasonal pattern?
One likely driver is the way refining stocks trade around summer fuel demand and crack spread expectations. Early June often brings a reset in gasoline and diesel margin forecasts as traders digest Memorial Day demand data and updated refinery utilization, which can pressure high-flying refiners. In midterm election years, shifting policy headlines around energy regulation and strategic petroleum reserve decisions may add another layer of volatility, making this short window more pronounced for Valero.
What is driving Valero Energy (VLO) today?
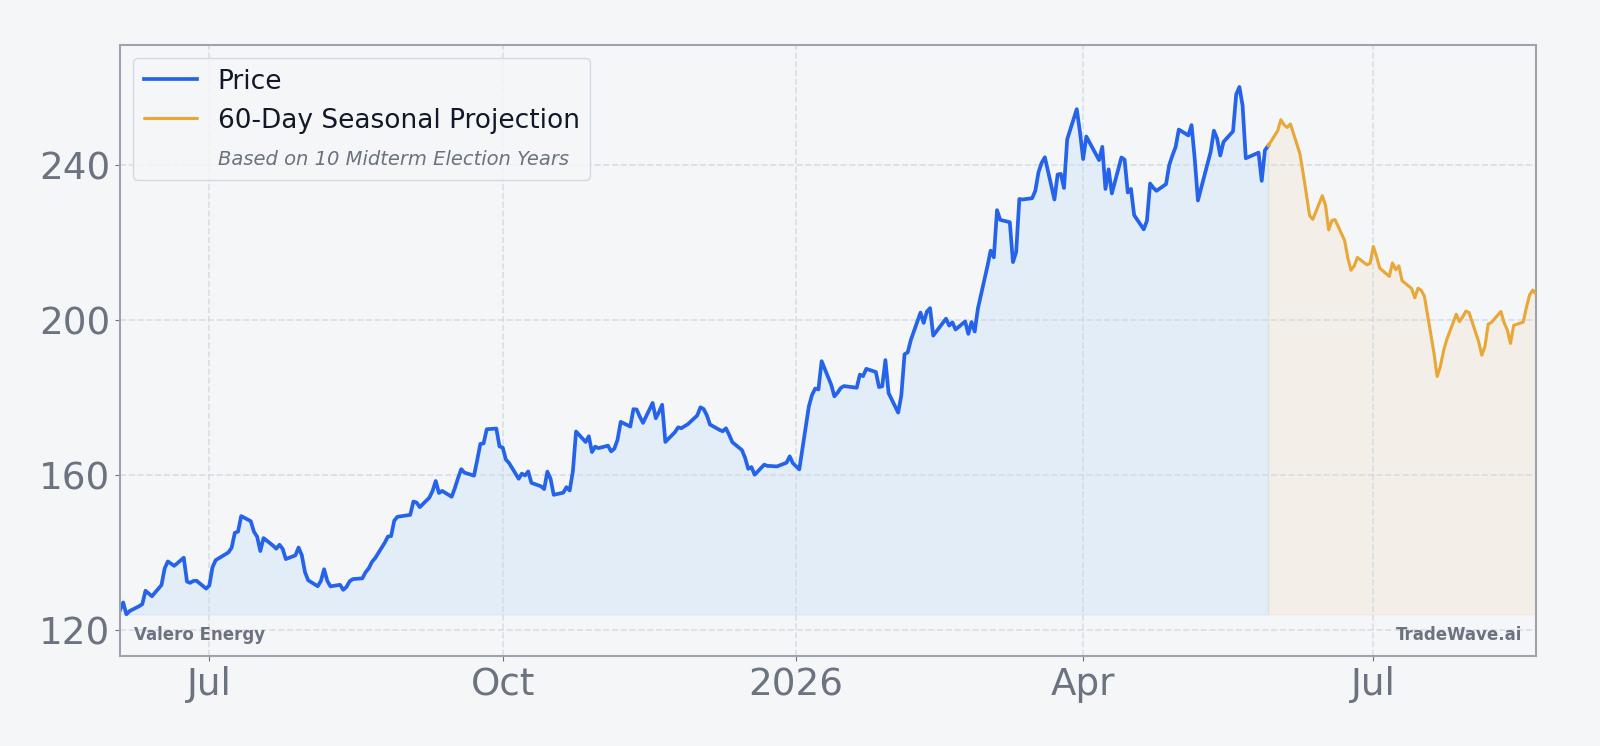
Valero Energy closed at $246.49, up 2.2% on the day, extending a strong run that has left the stock about 6.2% below its 52-week high of $262.89 and more than double its 52-week low of $121.54.[2] The move builds on a string of strong quarters: in Q4 2025 Valero posted adjusted EPS of $3.82 versus $3.27 expected as refining margins jumped to $13.61 per barrel, while Q3 2025 also beat estimates with $3.66 in adjusted EPS on a sharp rebound in 3-2-1 crack spreads and product margins.[1][2] Those results have kept the refining sector in focus, with analysts at Goldman Sachs maintaining a Buy rating and a $197 price target in late 2025, a level that reflected an earlier price regime before the latest leg higher.[1]
Macro and policy themes are also in play. In January 2026, UBS highlighted Valero as one of the best-positioned refiners to benefit from potential Venezuelan heavy sour crude supply given its Gulf Coast footprint, arguing that wider heavy-light differentials could support margins if sanctions ease and volumes rise.[2] That backdrop, combined with still-firm diesel and gasoline spreads, has helped keep investor attention on complex refiners as a way to play both global supply shifts and resilient U.S. demand.
The chart below situates the latest move against the past year of trading and a 60-day seasonal projection.
What should traders watch as this early-June window approaches?
First, the calendar: the 8-day midterm-year window begins on Jun 3, so any shift in tape behavior around that date will be watched closely against the historical pattern. A continuation of the recent uptrend through the window, similar to 2022, would mark only the second time in ten cycles that the short setup failed, while a stall or pullback would line up with the 9-for-10 track record for shorts.
Second, price levels matter. Traders will be watching how Valero behaves if it retests the 52-week high near $262.89 during or just before the window, and whether any rejection from that area comes with rising volume or widening crack spreads. A decisive break above that high with strong follow-through would signal that the current fundamental backdrop is overpowering the usual early-June softness.
Third, the policy and macro calendar could interact with this pattern. Any fresh headlines on Venezuelan supply, U.S. fuel demand data, or refinery utilization around the start of June could either reinforce the historical tendency toward short-term weakness or help extend the rally if they come in better than feared.[2] For traders who track seasonality, the key tell will be whether intraday swings and closing prices during the window resemble the typical slow bleed lower or instead show the kind of persistent bid that defined the outlier year.
Sources
About this seasonal analysis
Seasonal pattern data is sourced from TradeWave.ai, which analyzes historical price behavior across annual calendar windows going back up to 30 years. Read the full data methodology or the book The 100-Year Pattern by Afshin Moshrefi (2026 edition). Past performance of seasonal patterns does not guarantee future results. This article is for informational purposes only and does not constitute investment advice.