10-for-10 Losing Streak: Illinois Tool Works (ITW) Has Dropped Every Midterm Summer Since 1986
Illinois Tool Works is stepping into a 62-day midterm-year seasonal window that has delivered consistent downside in past cycles, even as the stock trades in the middle of its 52-week range.

What is the seasonal pattern for Illinois Tool Works (ITW)?
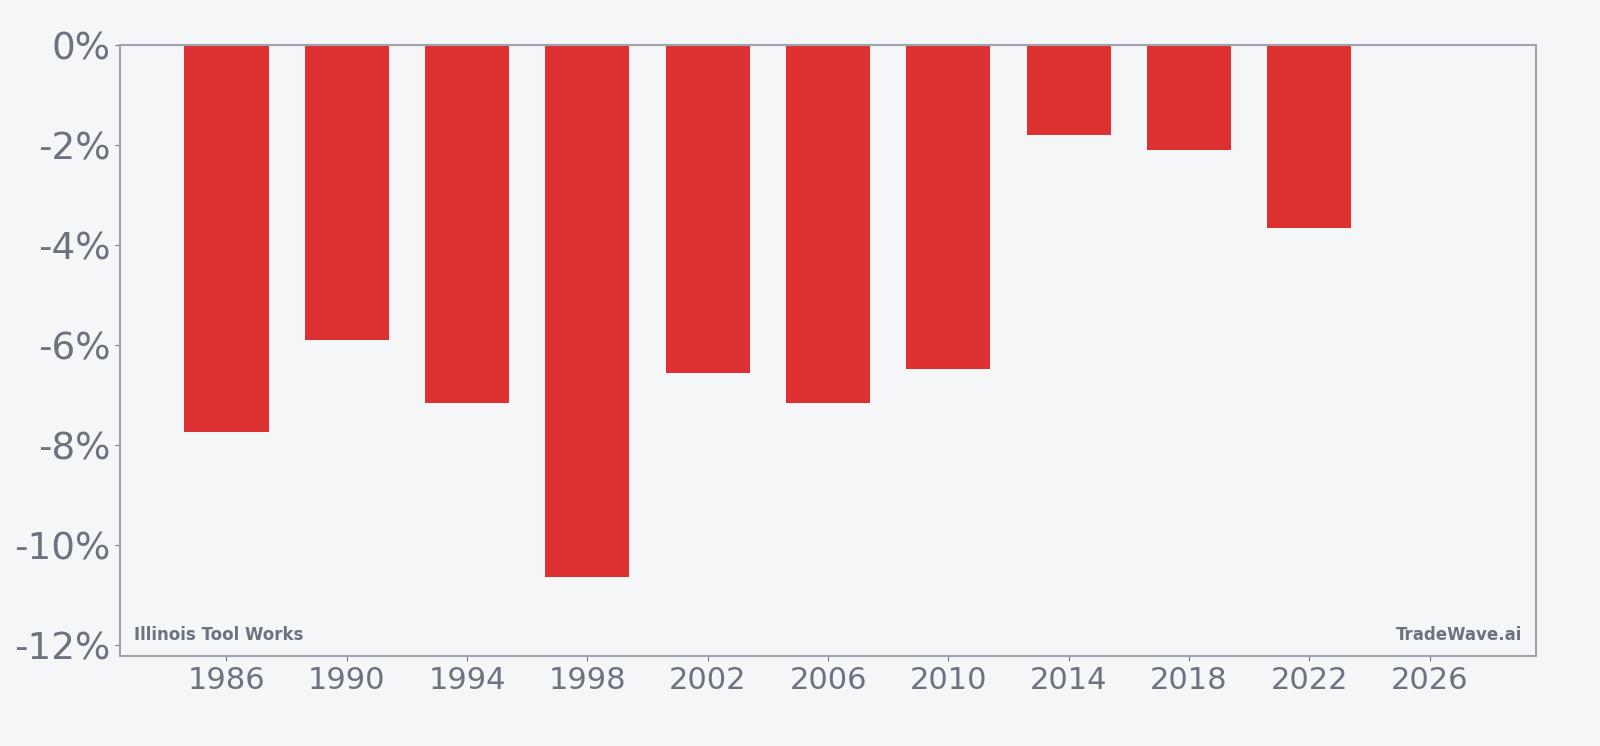
Illinois Tool Works has fallen in 10 of 10 midterm election years during this late-May 62-day window, with an average decline of 5.92% in those years.
- 10 for 10 in this window, with Illinois Tool Works posting average declines of 5.92% in each midterm-year stretch.
- Seasonal direction is bearish for shorts: Percent Profitable is 100%, with 10 winners and 0 losers for the short side.
- The window begins May 27 and runs for 62 trading days, covering much of the early summer in the midterm election year.
- Average winner decline of 5.92% comes with a Sharpe ratio of 1.94, indicating historically strong risk-adjusted results for the pattern.
- The TradeWave Ratio of 2.03 suggests price has typically traveled meaningfully in the trade direction within the window before closing.
- Individual years have seen adverse moves against the short, so intraperiod drawdowns can still be sharp even when the window finishes lower.
According to historical data from TradeWave.ai, this midterm-year stretch for Illinois Tool Works has behaved very differently from an average summer, with a clear directional bias that traders often overlook.
How has Illinois Tool Works (ITW) traded in this midterm-year summer window?
Illinois Tool Works has declined in all of the last 10 midterm election years during the 62 trading days starting May 27, making this one of its most consistently negative seasonal windows for shorts. Shares finished Monday at 251.70, up 0.5% on the day and sitting between a 52-week low near 227.88 and a high around 299.36, roughly 15.9% below the peak and 10.5% above the trough. That mix of a clean historical pattern and a mid-range price zone gives this year’s window extra weight for traders watching the industrials sector.
Because this analysis groups only midterm election years, it isolates a specific policy and liquidity backdrop rather than blending all cycles together. Midterm years often feature tighter financial conditions and more policy uncertainty, which can weigh on capital goods and industrial names like Illinois Tool Works as corporate customers reassess spending.
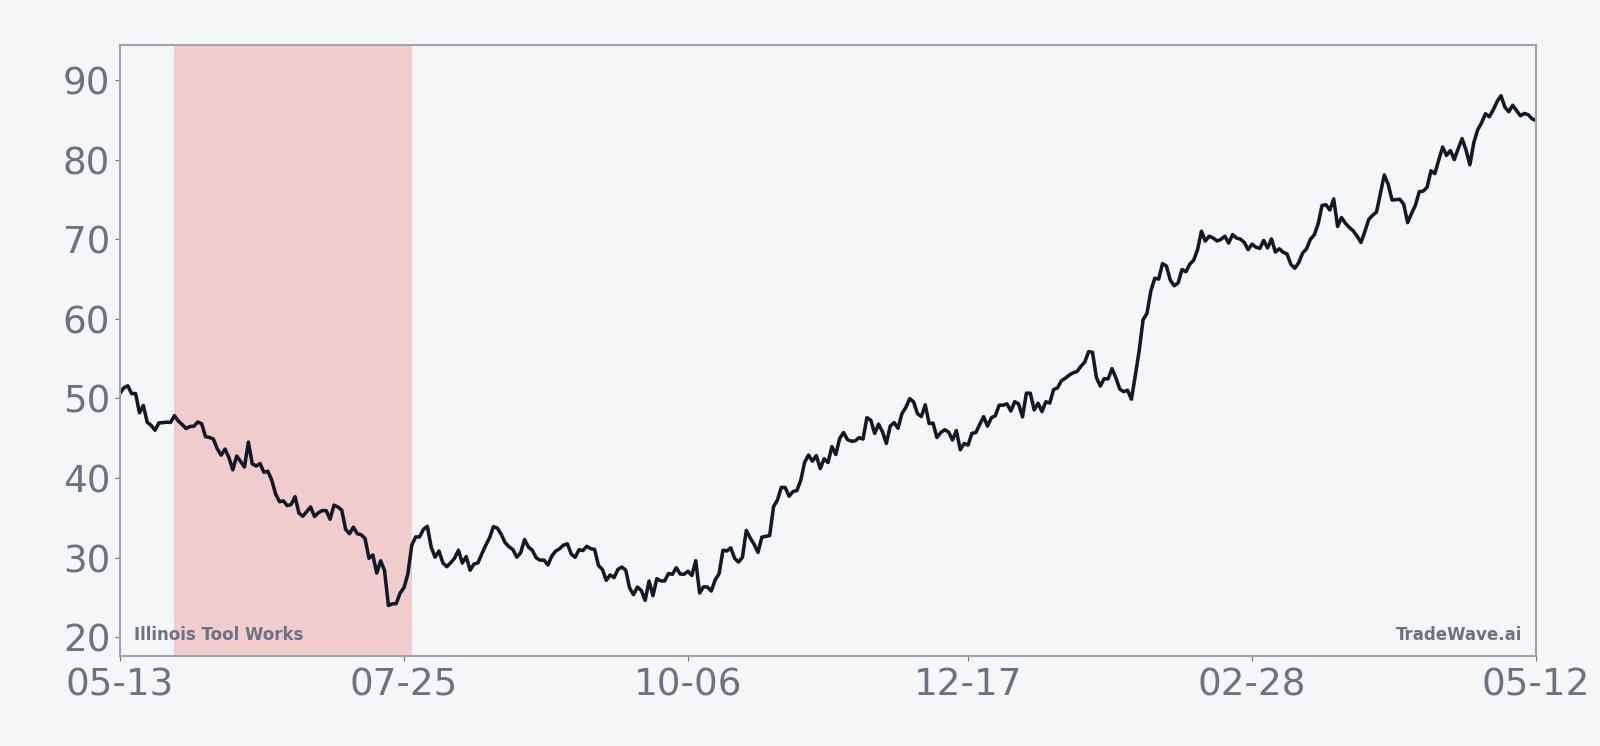
The historical seasonal trend line slopes steadily lower across most of the 62-day span, with only brief pauses where the stock has tended to consolidate before resuming its drift down. That fits a short-direction pattern where rallies have been short-lived and have not typically reversed the broader move lower within the window.
Stacked net, peak favorable, and worst adverse moves by year show how far Illinois Tool Works has tended to swing inside this window.
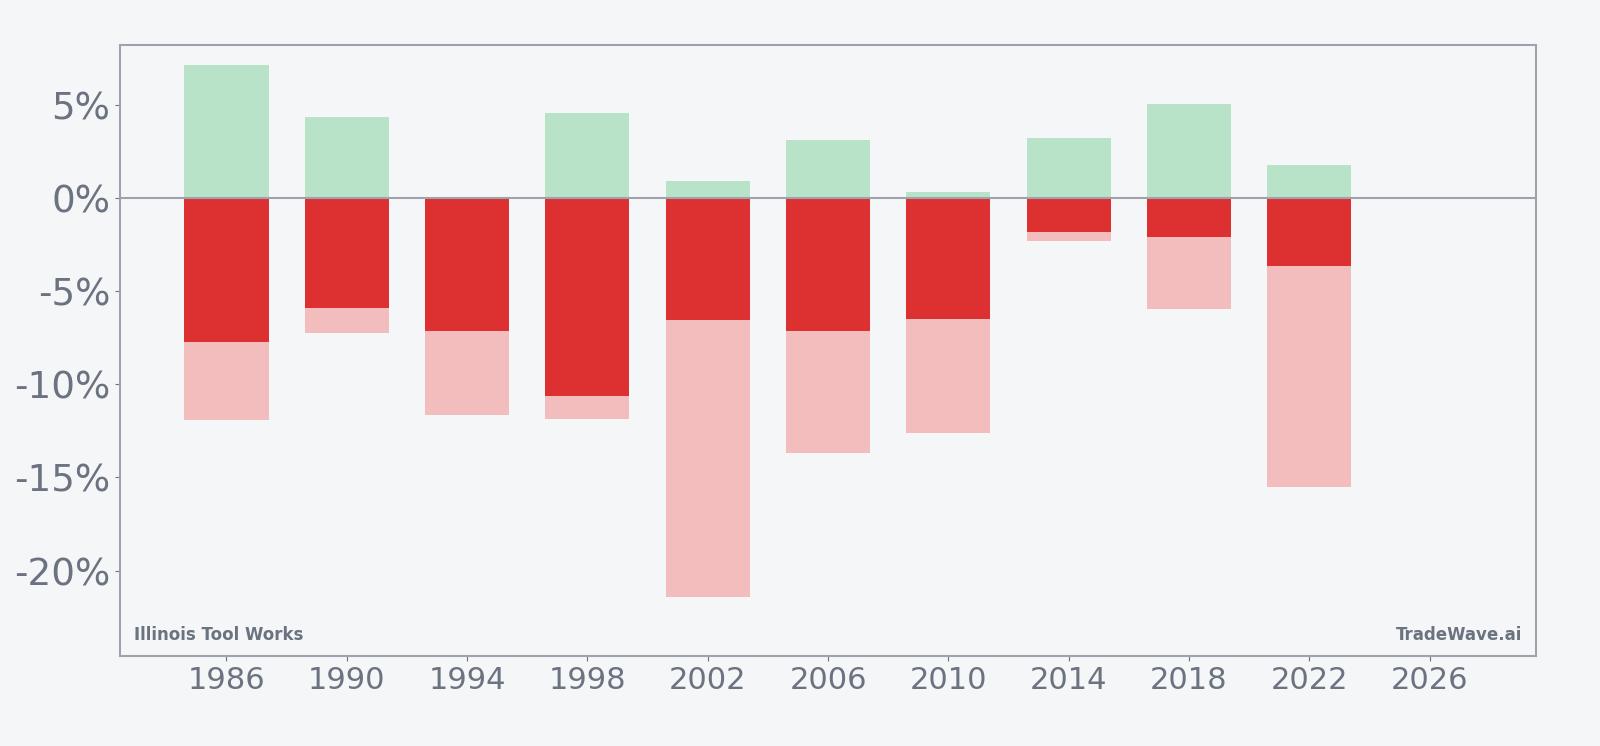
Across individual years, the best point-to-trough moves in favor of the short have often been larger than the final net decline, which is what the maximum favorable excursion captures. At the same time, the maximum adverse excursion shows that in several years the stock first moved meaningfully against the short before rolling over, so intraperiod drawdowns have been part of the playbook even in windows that ultimately finished lower.
History does not guarantee future results; adverse excursions can be large even in winning windows, and seasonal tendencies can break when fundamentals or macro conditions change.
Why does Illinois Tool Works (ITW) follow this seasonal pattern?
One likely driver is the way industrial spending and order books line up around the midyear period in midterm election cycles. Analysts often point to midyear budget resets, project deferrals and policy uncertainty in Washington during midterms, which can slow new equipment orders and weigh on diversified manufacturers. This pattern may also reflect institutional portfolio repositioning away from cyclicals in early summer when growth and policy signals are less clear.
What is driving Illinois Tool Works (ITW) today?
Illinois Tool Works shares closed at 251.70 on May 26, up 0.5% on light volume of 7,540 shares, compared with a 20-day average around 1.4 million, and sit about 3.3% below the 50-day moving average near 260.17.[1] The stock has pulled back roughly 7.17% over the past month, leaving it well off its 52-week high near 299.36 but still comfortably above the 52-week low around 227.88, a range that keeps it squarely in the middle of its recent trading band rather than at an obvious extreme.[1]
The chart below situates the latest move in its recent multi-month context alongside a 60-day seasonal projection.
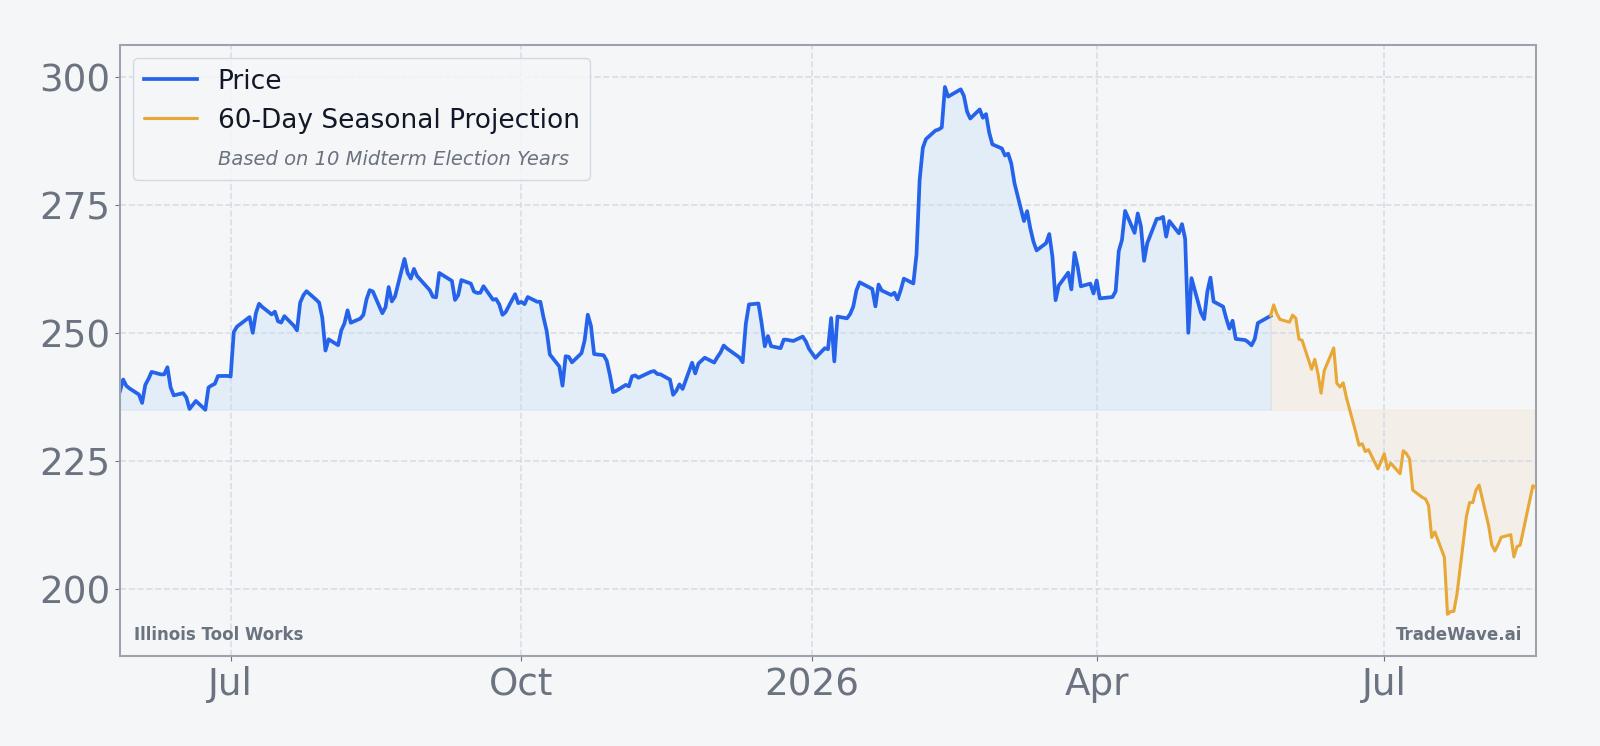
With no near-term earnings date or major company-specific catalyst on the calendar, trading in Illinois Tool Works is likely to be shaped by broader industrials sentiment, interest-rate expectations and macro data on manufacturing and capital spending. Against that backdrop, the historical midterm-year seasonal pattern adds a second layer of context for traders watching how the stock behaves through early summer.
What should traders watch in this Illinois Tool Works (ITW) window?
First, price behavior relative to the 50-day moving average around 260.17 will be important; repeated failures to reclaim that level during the window would be consistent with the historical pattern of midterm-year softness.[1] Second, watch how the stock reacts around any macro data that hits during this stretch, especially manufacturing surveys and capital spending indicators, since those have often coincided with swings in industrial names.
Third, intraperiod volatility matters as much as the final outcome. In prior years, Illinois Tool Works has sometimes rallied early in the window before rolling over, which shows up in the gap between maximum favorable and adverse excursions. Traders will be watching whether any early strength fades in similar fashion or whether a sustained break higher would contradict the historical seasonal trend.
Finally, because this window sits in the mid part of the midterm election year, any shift in expectations around fiscal policy, regulation or infrastructure spending could either reinforce or offset the usual pattern. If the stock holds firm or grinds higher through the bulk of the 62 days, that would mark a clear departure from the last 10 cycles and signal that fundamentals or the policy backdrop are overpowering the usual midterm-year seasonal drag.
Sources
About this seasonal analysis
Seasonal pattern data is sourced from TradeWave.ai, which analyzes historical price behavior across annual calendar windows going back up to 30 years. Read the full data methodology or the book The 100-Year Pattern by Afshin Moshrefi (2026 edition). Past performance of seasonal patterns does not guarantee future results. This article is for informational purposes only and does not constitute investment advice.