10 of 10 Midterm Summers: Illinois Tool Works (ITW) Has Favored 7.39% Short-Side Profits
Illinois Tool Works is edging higher into late May, but a midterm-year summer window that has been consistently profitable for short trades is about to open.

What is the seasonal pattern for Illinois Tool Works (ITW)?
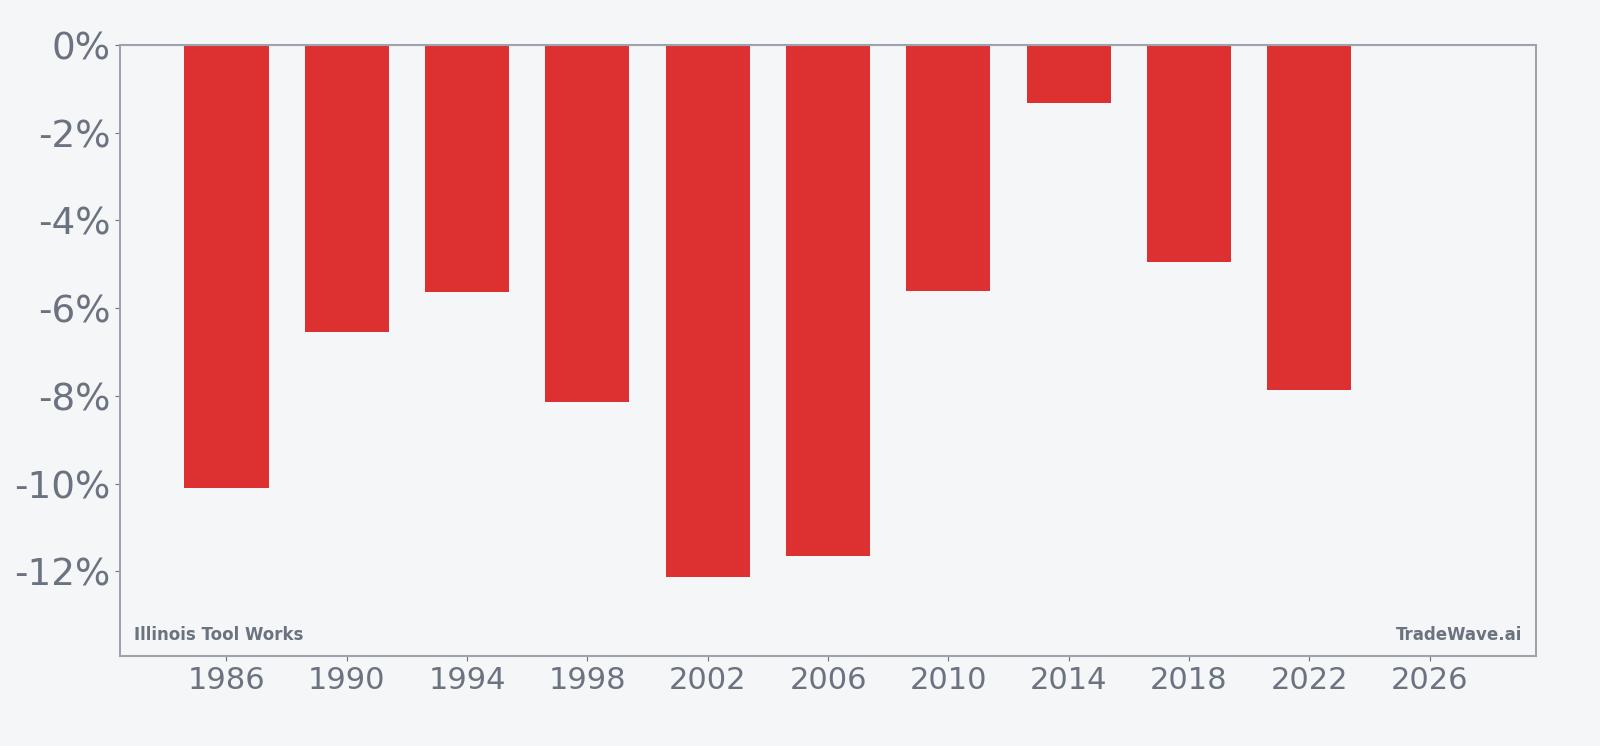
Illinois Tool Works has fallen in 10 of 10 midterm-year summer windows starting around Jun 2, with an average 7.39% gain for short trades in winning years.
- 10 for 10 in this window, with short trades averaging 7.39% profit in winning years across the last 10 midterm election cycles.
- The upcoming Illinois Tool Works trading window begins on Jun 2, 2026 and runs for 53 trading days in the heart of the midterm-year summer.
- Percent Profitable is 100%, with 10 winners and 0 losers for the short-side seasonal pattern in this specific election-cycle slice.
- Average profit across all years matches the winner average at 7.39%, reflecting a clean sweep of profitable short outcomes in the historical sample.
- Intraperiod swings have been meaningful, with past years showing sizable peak run-ups in favor of the short trade alongside double-digit worst drawdowns before the move completed.
- The pattern clusters around midterm election years, when policy uncertainty and industrial demand questions have often coincided with softer price action for ITW in early summer.
According to historical data from TradeWave.ai, this midterm-year summer stretch has behaved very differently from an average month on the calendar for Illinois Tool Works, and the next iteration is about to start.
How has Illinois Tool Works (ITW) traded in past midterm-year summers?
Illinois Tool Works has delivered a profitable short trade in every one of the last 10 midterm election years during the 53-day window that begins around Jun 2, with average gains of 7.39% for bears. Shares finished Friday at $252.43, up about 1% on the day and roughly 16.7% below the 52-week high near $303.16, leaving room on the chart if the historical summer softness shows up again.
Grouping the data by the presidential election cycle matters here because this pattern only shows up in midterm election years, when Washington is debating spending, regulation and tax priorities while the White House is not on the ballot. For industrials like Illinois Tool Works, that mix has often coincided with choppier demand expectations and more cautious positioning into the summer, which is exactly the slice this window captures.
A second view layers in the typical best and worst intraperiod swings alongside those net outcomes.
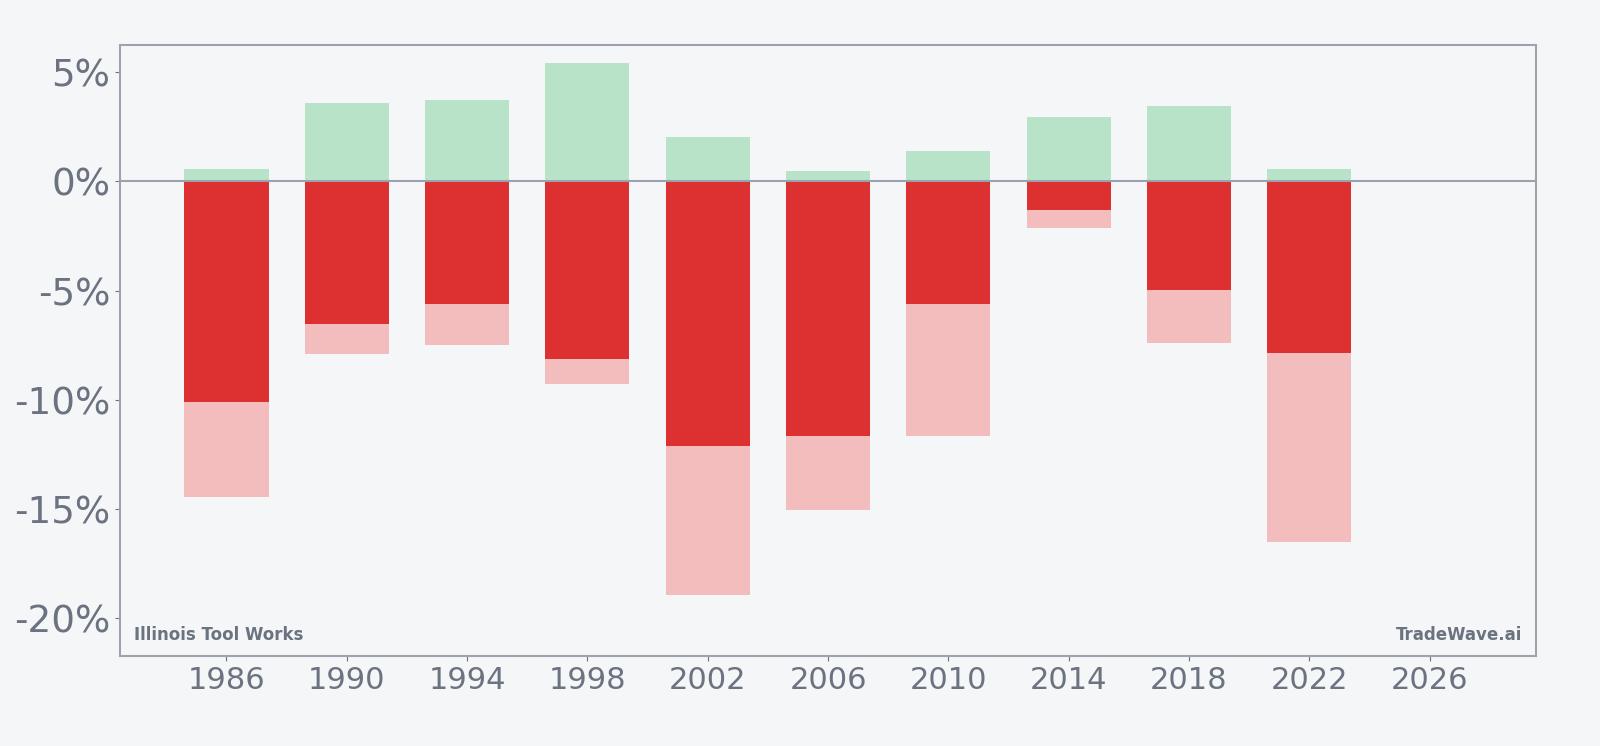
Across the 10-year sample, the short-side wins have not been small. Individual years such as 2002 and 2006 saw net declines of 12.12% and 11.64% respectively, while even the mildest outcome in 2014 still produced a 1.33% drop from entry to exit. The maximum favorable move inside the window has often been several percentage points beyond the final net, which is what the TradeWave Ratio of 2.04 is flagging: price has tended to travel meaningfully in the trade direction before the window closes.
At the same time, the maximum adverse move has not been trivial. In 2002, Illinois Tool Works experienced an intraperiod drawdown of 18.91% against the short before rolling over, and 2022 saw a 16.52% adverse swing even though the trade ultimately finished with a 7.87% profit. That combination of strong net results and sizable interim reversals paints this as a high-variance window where timing and risk limits have historically mattered as much as direction.
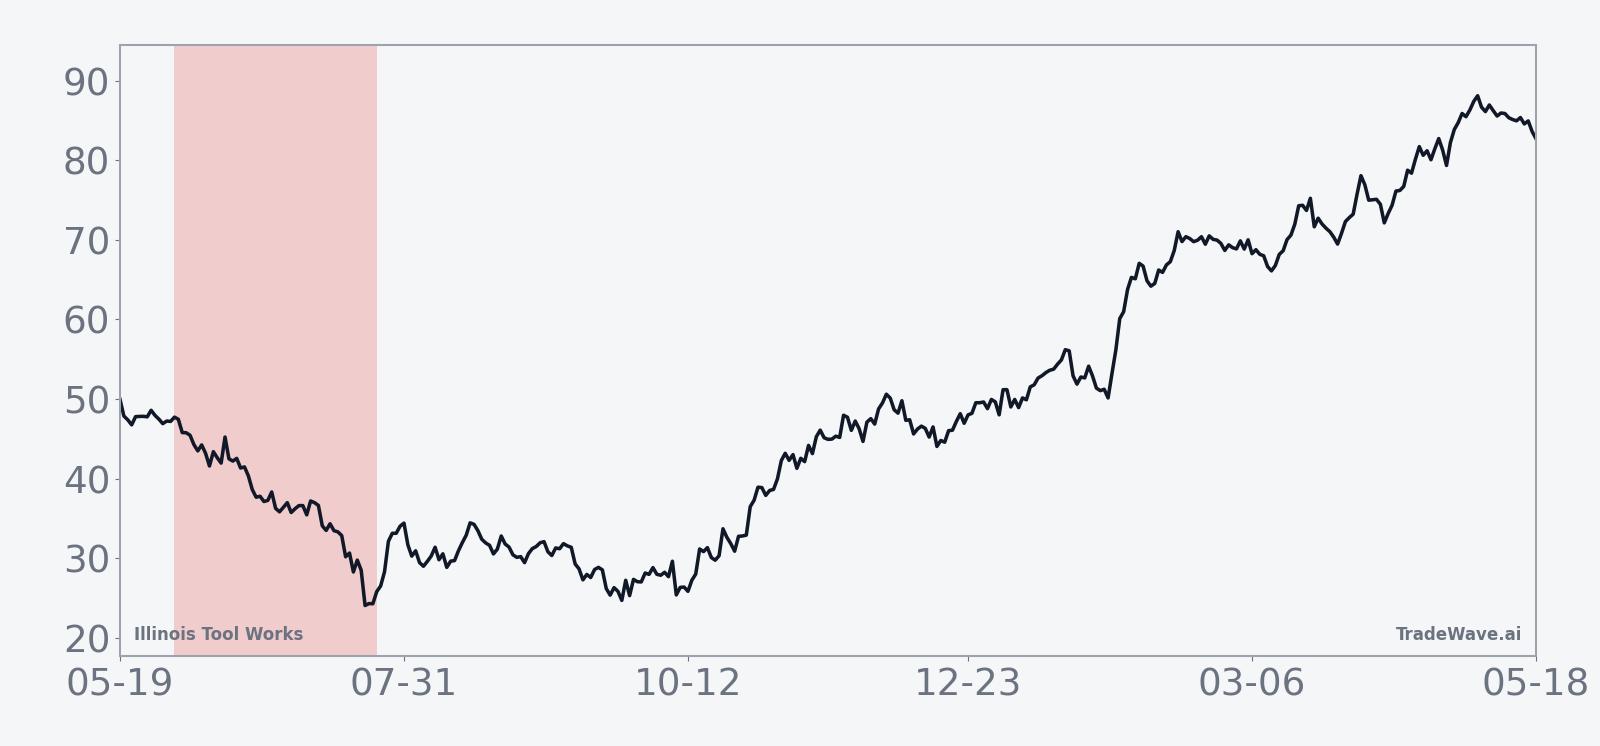
The trend profile inside the window tends to show pressure building rather than a single air pocket. The seasonal average drifts lower over the 53 days instead of collapsing in the first week, which suggests that in many years the stock has faded in stages as midterm-year headlines and macro data accumulate. The cumulative return curve reinforces that picture, with a steady step-down pattern rather than a jagged, mean-reverting line.
Add it up: 10 for 10 profitable short outcomes, mid-single to low-double-digit average declines, and a track record of sizable intraperiod swings make this one of the cleaner bearish seasonal stretches in Illinois Tool Works’ election-cycle history.
Why does Illinois Tool Works (ITW) follow this seasonal pattern?
One likely driver is the way industrial earnings and guidance cluster around late spring and early summer in midterm election years, when management teams are often more cautious about the back half of the year. Analysts have also pointed to portfolio repositioning as funds rebalance around shifting policy expectations and infrastructure or manufacturing bills that tend to stall or morph in the middle of the political cycle. For a diversified industrial like Illinois Tool Works, that mix of guidance risk and policy noise may translate into a seasonal tendency for investors to trim exposure into this specific midterm-year window.
History does not guarantee future results; adverse excursions can be large even in winning windows, and past seasonal behavior may not repeat.
What is driving Illinois Tool Works (ITW) today?
Illinois Tool Works closed at $252.43 on May 22, up 0.9983% on the session, as the stock continued to stabilize after a one-month slide of 6.35% from recent highs. That leaves shares about 16.7% below the 52-week peak of $303.16 and still comfortably above the 52-week low near $230.77, with trading volume of roughly 560,000 shares on Friday versus a 20-day average of about 1.2 million. The stock also sits modestly below its 50-day moving average around $261.23, a sign that the recent pullback has not yet fully reversed.
The chart below situates the latest move against the past year of trading and a 60-day seasonal projection.
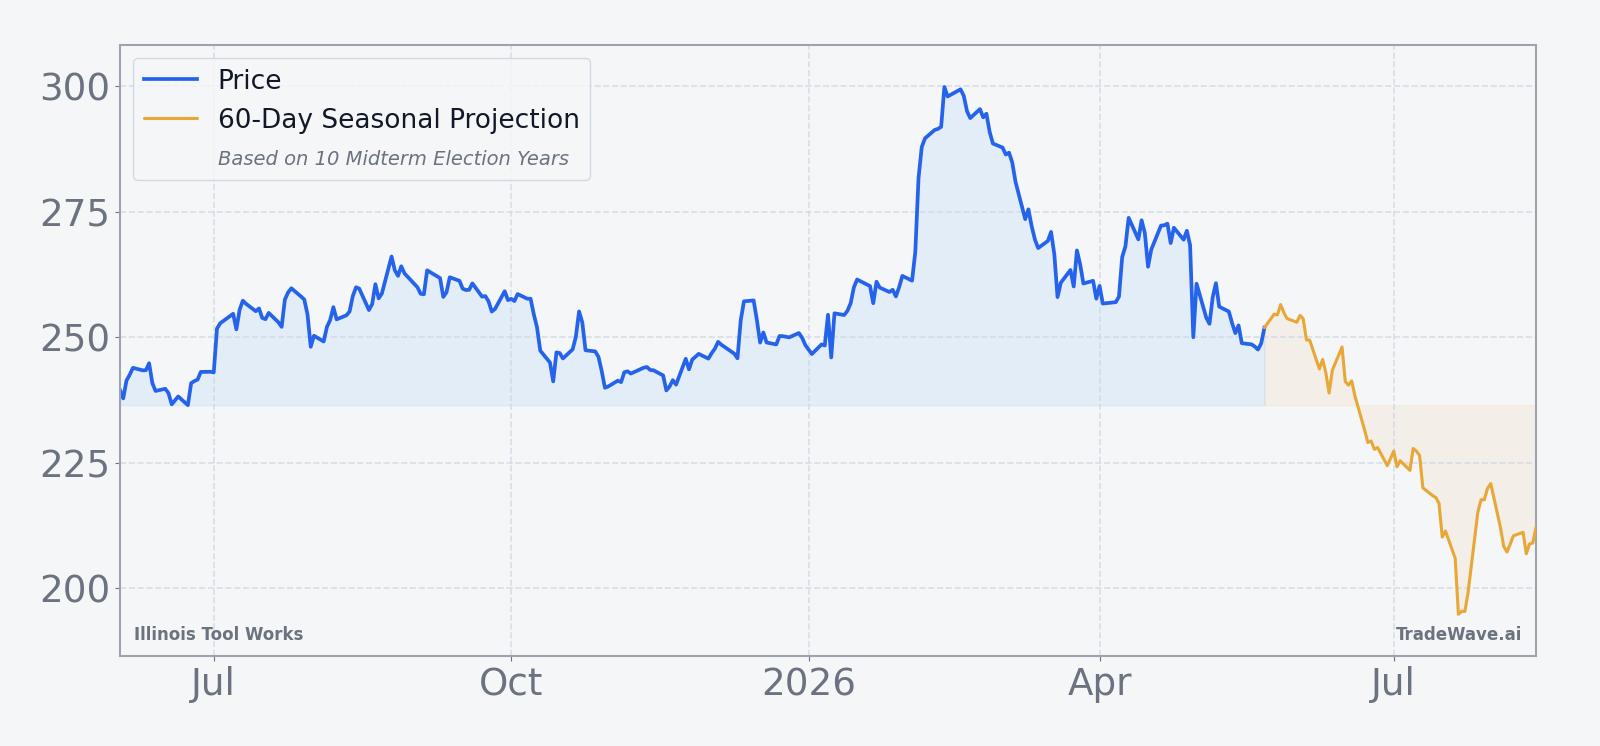
With no near-term earnings date or major company-specific catalyst on the calendar, trading in Illinois Tool Works has been driven more by broader industrial sentiment and interest-rate expectations than by stock-specific headlines. The pullback from the 52-week high has tracked a wider cooling in large-cap industrials as investors reassess how much late-cycle strength is left in manufacturing and construction demand. Against that backdrop, the fact that ITW is heading into a midterm-year summer window that has historically favored short positions adds a layer of calendar risk to an already delicate balance between softening momentum and still-elevated valuations.
What should traders watch as this Illinois Tool Works (ITW) window opens?
First, the calendar: the 53-day midterm-year summer window begins on Jun 2, 2026, so price action in the final days of May will shape the starting point for any seasonal move. A push back toward the 50-day moving average near $261 would give bears more room if the historical pattern repeats, while a break below the recent one-month lows would mean the window starts from a weaker base.
Second, watch how Illinois Tool Works trades around any macro data that hits during the window, especially manufacturing surveys and capital spending indicators. In prior midterm years, softer reads on industrial activity have often coincided with the down legs inside this pattern, while stronger data has tended to line up with the sharp but temporary rallies that show up as adverse excursions in the historical record.
Third, monitor volume and volatility as the window progresses. The historical profile shows that when this pattern moves, it can move quickly, with several years featuring double-digit intraperiod swings in both directions before the short ultimately paid off. If this summer’s tape stays unusually quiet or if rallies come on heavy volume and stick, that would be an early sign that the 10-for-10 record is facing a tougher test.
Finally, keep an eye on how Illinois Tool Works trades relative to the broader industrial sector and the S&P 500. In past midterm election years, weakness in key industrial names has sometimes dragged on cyclical sentiment more broadly, while a resilient tape in ITW during this historically soft window would argue that the election-cycle pattern is being overshadowed by a different macro or policy regime. The seasonal history is clear, but the next 53 trading days will show whether this midterm-year summer once again lines up with the script or breaks it.
Sources
About this seasonal analysis
Seasonal pattern data is sourced from TradeWave.ai, which analyzes historical price behavior across annual calendar windows going back up to 30 years. Read the full data methodology or the book The 100-Year Pattern by Afshin Moshrefi (2026 edition). Past performance of seasonal patterns does not guarantee future results. This article is for informational purposes only and does not constitute investment advice.