9-of-10 Midterm Slides: Parker Hannifin (PH) Nears a Weak 24-Day Window for Shorts
Parker Hannifin is heading into a late-May midterm-election-year seasonal window that has favored short setups historically, even as the stock trades well below its 52-week high after a strong multi-year run.

What is the seasonal pattern for Parker Hannifin (PH)?
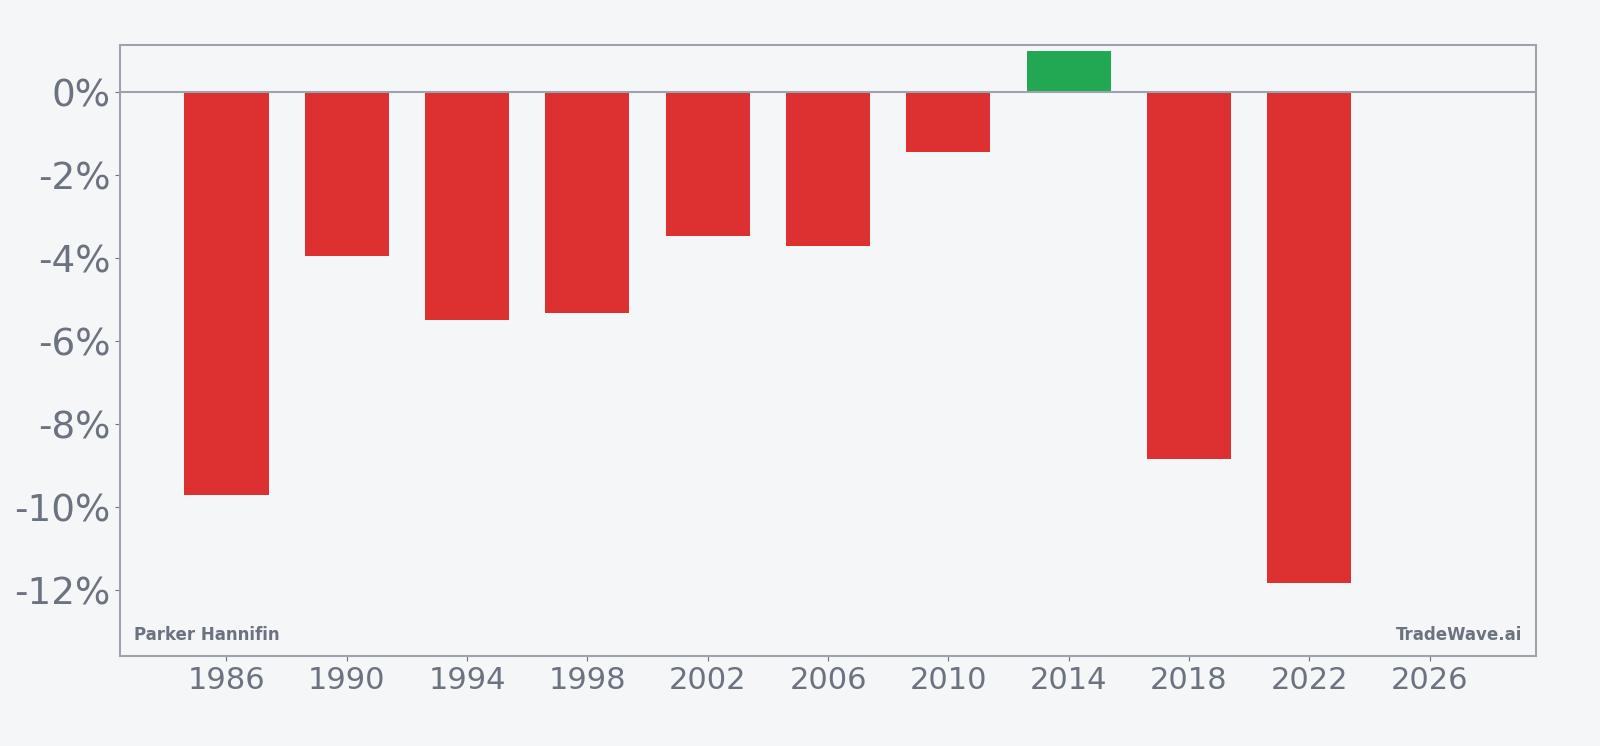
Parker Hannifin has fallen in 9 of 10 midterm-election-year windows starting May 31, with an average 5.99% gain for winning short trades.
- 9 for 10 in this window, with winning short years averaging 5.99% profit and a 5% average across all years.
- The 24-day Parker Hannifin trading window begins May 31 in midterm election years and has historically favored downside moves.
- Percent Profitable is 90%, with 9 winners and 1 loser for the short-side seasonal setup.
- Avg Profit reflects winners only at 5.99%, while Avg Profit - All, which includes the lone losing year, comes in at 5%.
- Historical intraperiod swings have been meaningful, with adverse moves at times exceeding 10% even in years that finished profitable for shorts.
- The PH seasonal trend in this slice of the calendar clusters around a steady grind lower rather than a single sharp break.
According to historical data from TradeWave.ai, this late-May midterm-year stretch has behaved very differently from an average month for Parker Hannifin, and the next iteration is about to open again.
How has Parker Hannifin (PH) traded in this late-May midterm-year window?
Parker Hannifin has delivered profitable short trades in 9 of the last 10 midterm-election-year windows that start on May 31 and run for 24 trading days, with winning years averaging 5.99% gains for bears. The next version of that window begins May 31, with the stock last changing hands at about $859 and sitting roughly 17.0% below its 52-week high of $1,034.96.[1]
Because this pattern is grouped by the presidential election cycle, it only looks at the last 10 midterm election years rather than every calendar year. That matters for an industrial name like Parker Hannifin, since midterm years often coincide with shifting fiscal priorities, infrastructure debates and portfolio repositioning across the machinery and aerospace complex.
The historical seasonal average shows a fairly steady downward drift across the 24-day span rather than a single air pocket. For a short-direction pattern, that means the typical winning year has not relied on catching one crash day but on a series of softer sessions that add up.
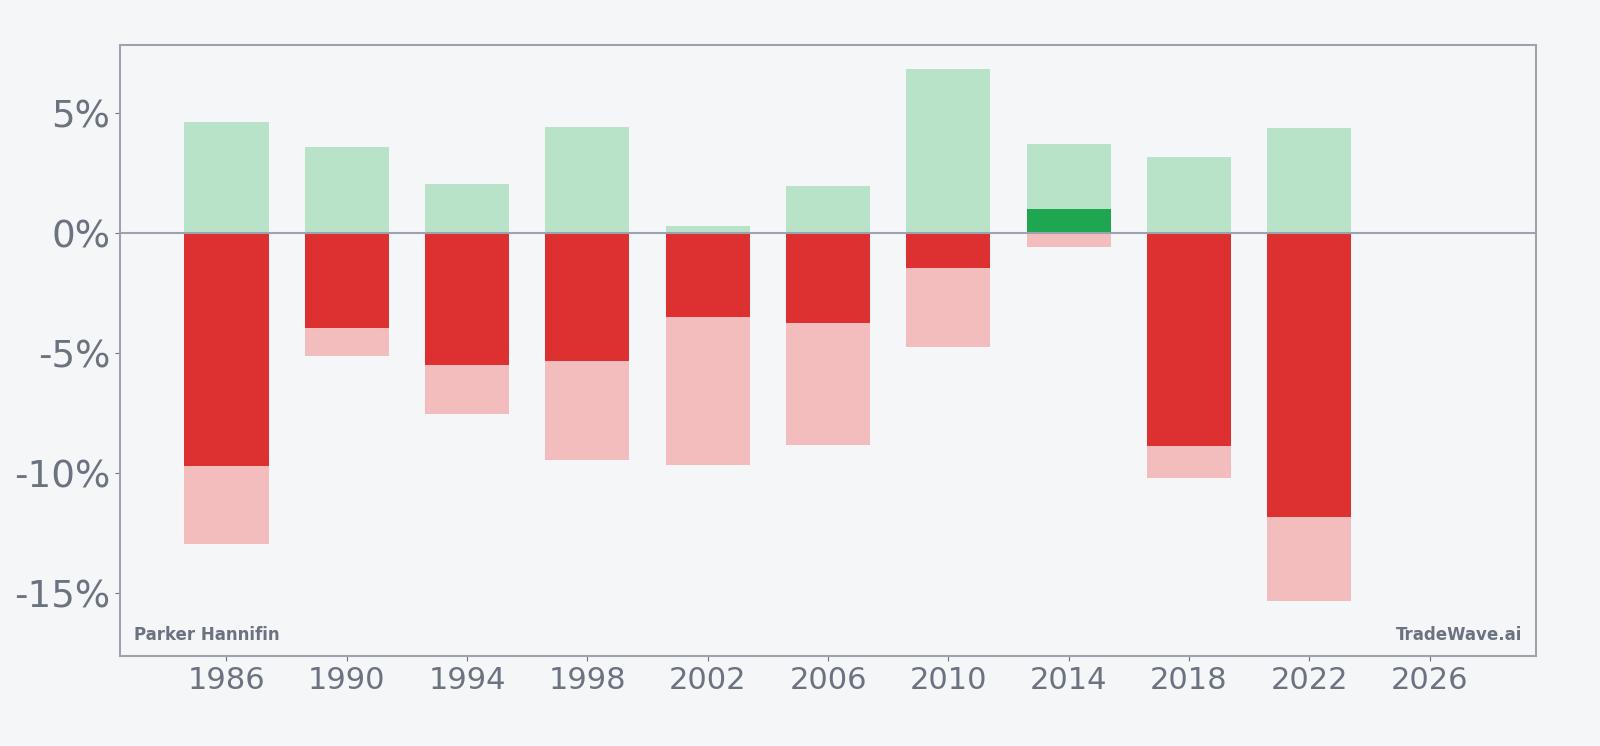
Across the per-year table, the strongest short year was 2022, when the pattern window captured an 11.83% decline from entry to exit, while 2018 and 1986 also delivered net drops of 8.86% and 9.72% respectively. The lone losing year for shorts was 2014, when Parker Hannifin rose 0.98% during the window, modestly squeezing anyone leaning into the seasonal bias.
Intraperiod swings have been meaningful. In 2022, the best point-to-trough move in favor of shorts, known as the maximum favorable excursion, reached 4.38%, while the worst drawdown from entry, or maximum adverse excursion, stretched to 15.33% before the trade finished profitable for bears. Several other years, including 1986 and 2018, saw adverse excursions of roughly 10% even though the final outcome still favored the short side.
The cumulative return chart for this Parker Hannifin seasonal pattern climbs steadily in the direction of the short trade, reflecting a 66% cumulative gain across the 10 midterm-year samples. Add it up and the pattern has delivered a consistent, if sometimes bumpy, tailwind for traders positioned for weakness in this specific slice of the calendar.
Yearly net and intraperiod swings help frame how much Parker Hannifin has tended to move in this window.
For traders, the key takeaway is simple: this has been a short-favored window with a 90% hit rate and a history of sizable intraperiod swings that can cut both ways. History does not guarantee a repeat, but the consistency across a decade of midterm cycles is hard to ignore.
History does not guarantee future results, and adverse excursions can be large even in years that ultimately finish profitable for the seasonal trade.
Why does Parker Hannifin (PH) follow this seasonal pattern?
One likely driver is the way industrial and aerospace suppliers get repriced in midterm election years as investors digest policy signals on infrastructure, defense and capital spending. Analysts have also pointed to midyear portfolio rebalancing, where institutions trim winners in cyclical sectors after strong runs into spring. For a stock like Parker Hannifin that often tracks global manufacturing sentiment, those crosscurrents can translate into a short-lived but repeatable pocket of weakness around this late-May window.
What is driving Parker Hannifin (PH) today?
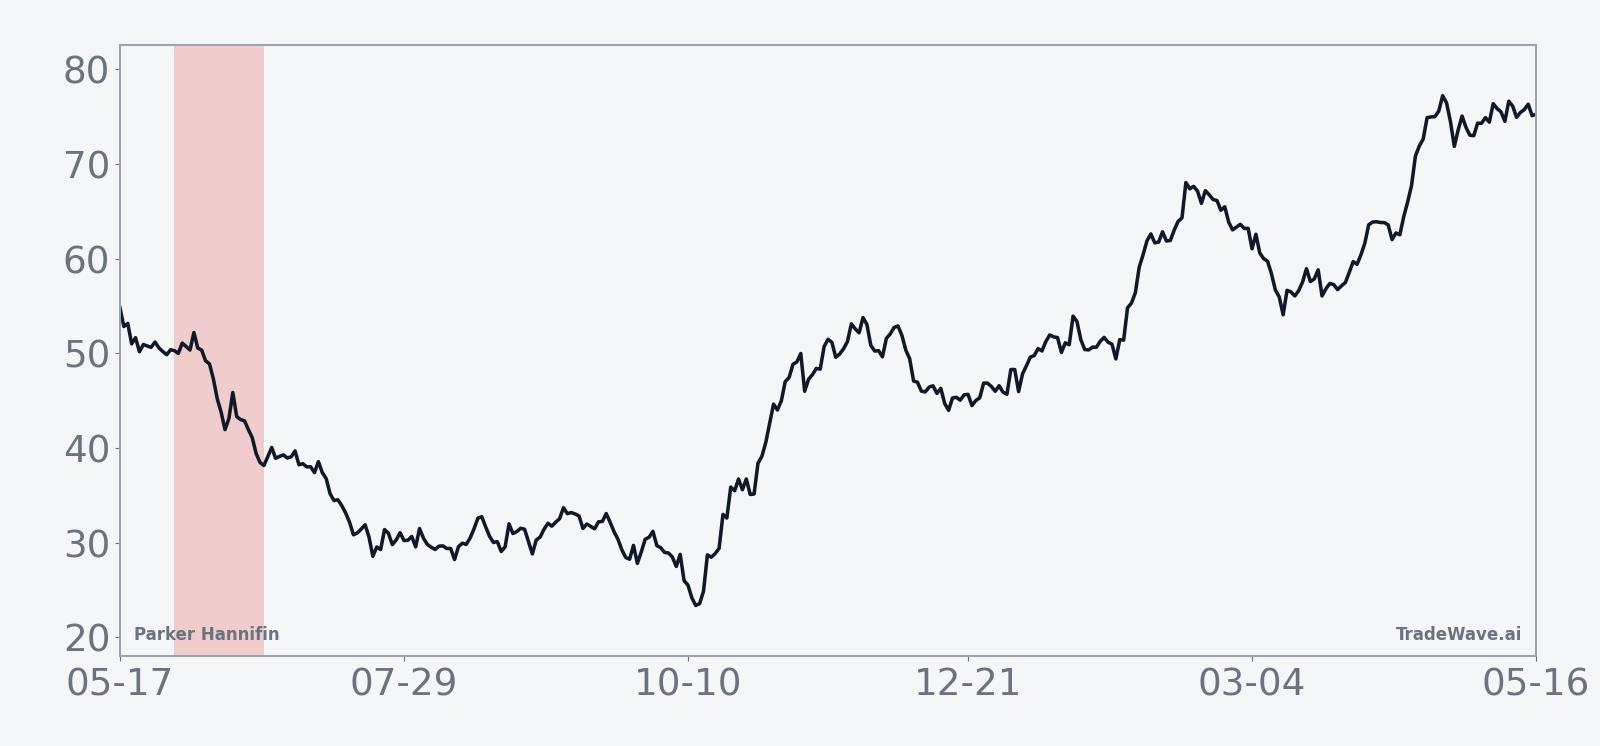
Parker Hannifin shares closed at $857.64 on May 21, up 0.6% on the day, with intraday trading between $847.46 and $863.10 on volume of about 479,000 shares, below the recent 20-day average of roughly 702,000.[1] The stock remains about 17.0% below its 52-week high of $1,034.96 and well above its 52-week low near $629.07, while also trading under its 50-day moving average around $918.11, a sign that the near-term trend has cooled after a powerful multi-quarter advance.[1]
The chart below situates the latest move in its recent multi-month context alongside a 60-day seasonal projection.
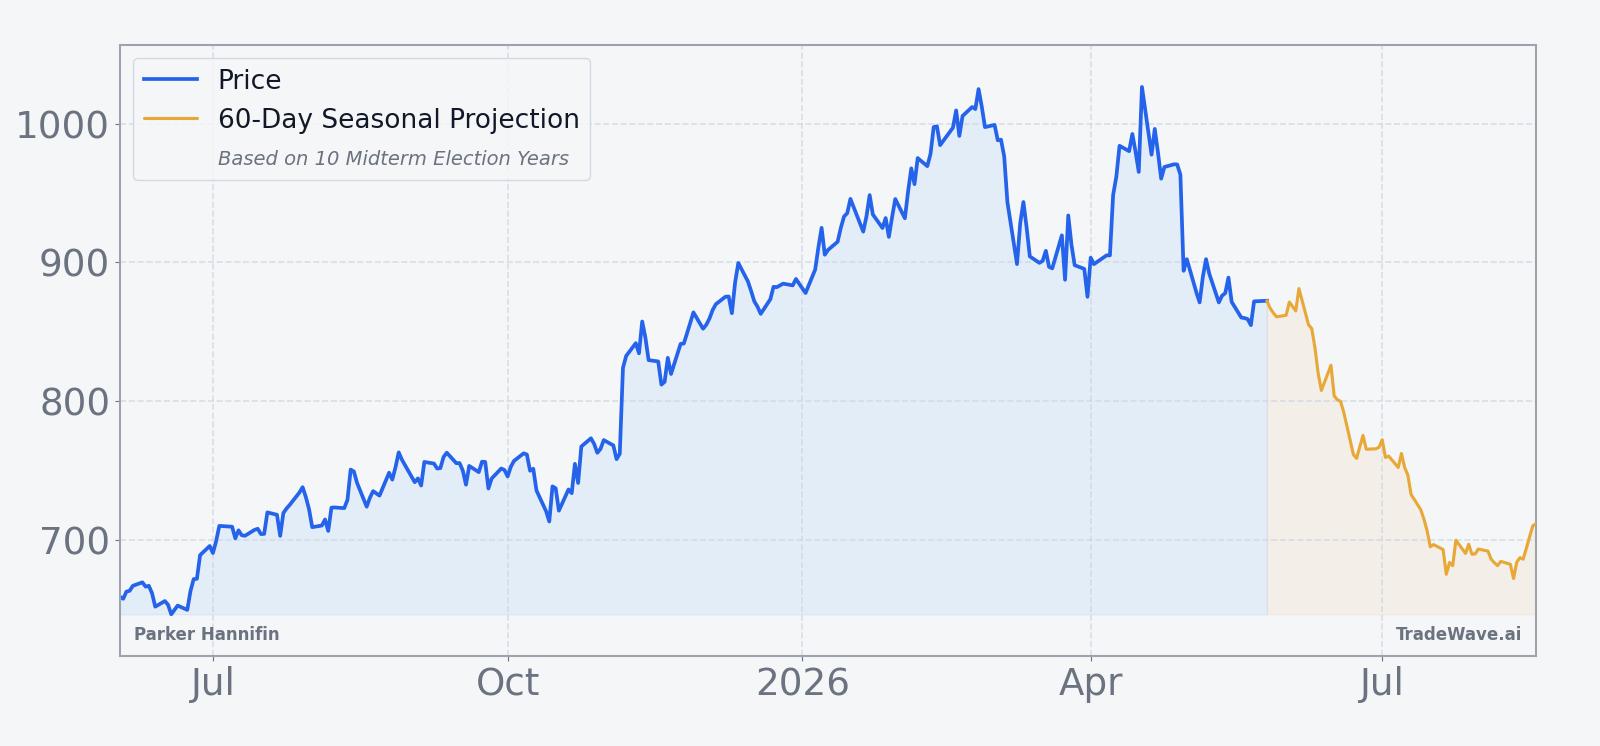
The combination of a stretched long-term chart, a pullback below the 50-day moving average and a historically short-favored seasonal window creates a different backdrop than the one investors faced earlier in the cycle. For a stock that has become a bellwether for high-end industrial demand, how Parker Hannifin behaves into and through this 24-day stretch will offer a clean test of whether the midterm-year seasonal pattern still has bite.
What should traders watch as this Parker Hannifin window opens?
First, the calendar: the seasonal window begins May 31 and runs for 24 trading days, so price action in the first week of June will be the initial tell on whether this midterm-year pattern is asserting itself again. Second, levels: traders will be watching how Parker Hannifin behaves around the 50-day moving average near $918 and the recent lows carved out during the latest pullback, since rallies back above the moving average would look very different from a renewed slide toward the 52-week low.[1]
Third, volatility inside the window will matter as much as direction. Historically, even winning short years have seen adverse moves of 5% to more than 10% before the trade finished in the money, so sharp intraday squeezes would not be out of character. Finally, behavior relative to the broader industrial and aerospace group will be important: if Parker Hannifin weakens while peers hold up, that would suggest stock-specific mean reversion after a big run, whereas a sector-wide wobble would point to a more macro midterm-year reset.
Sources
About this seasonal analysis
Seasonal pattern data is sourced from TradeWave.ai, which analyzes historical price behavior across annual calendar windows going back up to 30 years. Read the full data methodology or the book The 100-Year Pattern by Afshin Moshrefi (2026 edition). Past performance of seasonal patterns does not guarantee future results. This article is for informational purposes only and does not constitute investment advice.