Weyerhaeuser (WY) Has Dropped in All 10 Midterm Windows Starting May 31
Weyerhaeuser is approaching a 23-day midterm-year seasonal window that has delivered declines in every past cycle, even as the stock firms around the middle of its 52-week range.

What is the seasonal pattern for Weyerhaeuser (WY)?
Weyerhaeuser has fallen in 10 of 10 midterm-year windows starting May 31, with an average 5.66% gain for short positions in winning years.
- 10 for 10 in this window for shorts, with average winning-year profits of 5.66% over 23 trading days.
- The upcoming pattern runs from May 31 for 23 sessions and is based on the last 10 midterm election years.
- Percent Profitable is 100%, with 10 winners and 0 losers for the short-side seasonal setup.
- Cumulative return across those midterm-year windows is 71%, with an annualized return of 5.57% for the strategy.
- The TradeWave Ratio of 1.61 signals that price has typically moved meaningfully in the trade direction within the window.
- Intraperiod swings have included sharp adverse moves in some years, so short setups have faced real drawdown risk even when they finished profitable.
According to historical data from TradeWave.ai, this late-May stretch in midterm election years has behaved very differently from an average month for Weyerhaeuser, and the next iteration is about to open again.
How has Weyerhaeuser (WY) traded in this late-May midterm window?
Weyerhaeuser has declined in every one of the last 10 midterm election years during the 23 trading days starting May 31, a clean 10-for-10 record for short positions. Shares finished Thursday at about $24.47, up 2.7% on the day and sitting roughly in the middle of a 52-week range that runs from about $20.40 to $27.28.
The pattern sits inside the midterm election year, a phase that often brings policy uncertainty, shifting rate expectations and choppy risk appetite before the historically stronger pre-election year. Grouping Weyerhaeuser’s behavior by this presidential cycle lens isolates how the stock has traded when investors are digesting mid-cycle fiscal and regulatory signals rather than reacting to fresh election outcomes.
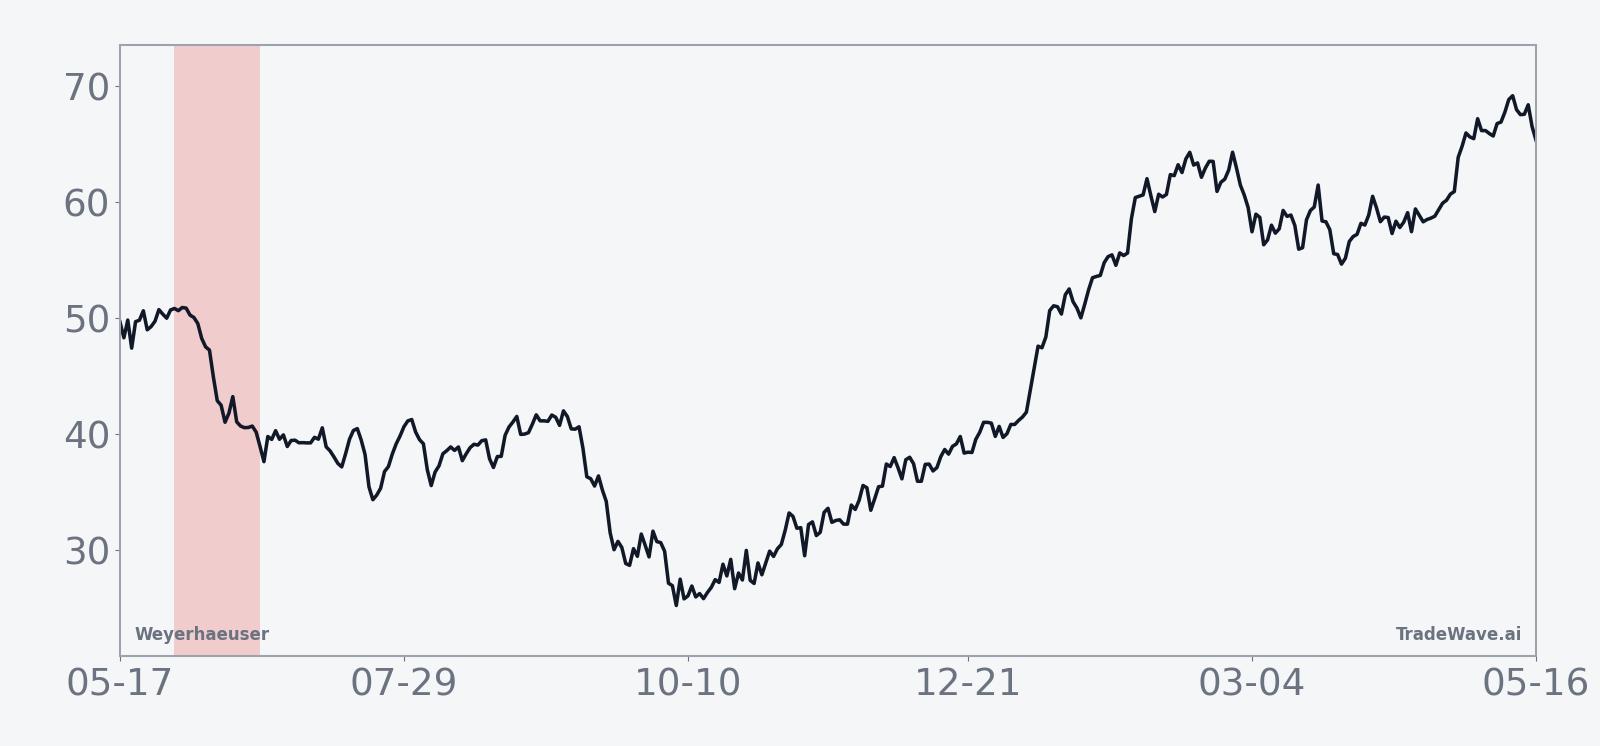
The historical seasonal average shows Weyerhaeuser typically softening fairly steadily through the window rather than snapping lower in a single air pocket. Trend statistics list 47 “Trend Long” days versus 5 “Trend Short” days across the composite path, which for a short strategy means the stock has often drifted lower in a relatively orderly fashion instead of collapsing in one burst.
Across the 10 midterm-year samples, the strategy’s cumulative return is 71%, with an annualized return of 5.57%. Average profit per trade is 5.66%, while the median outcome is close at 5.42%, a sign that results have clustered around the middle rather than being dominated by one outlier year. The Sharpe ratio of 1.17 points to a historically favorable risk-adjusted profile for this specific short window compared with a random 23-day stretch.
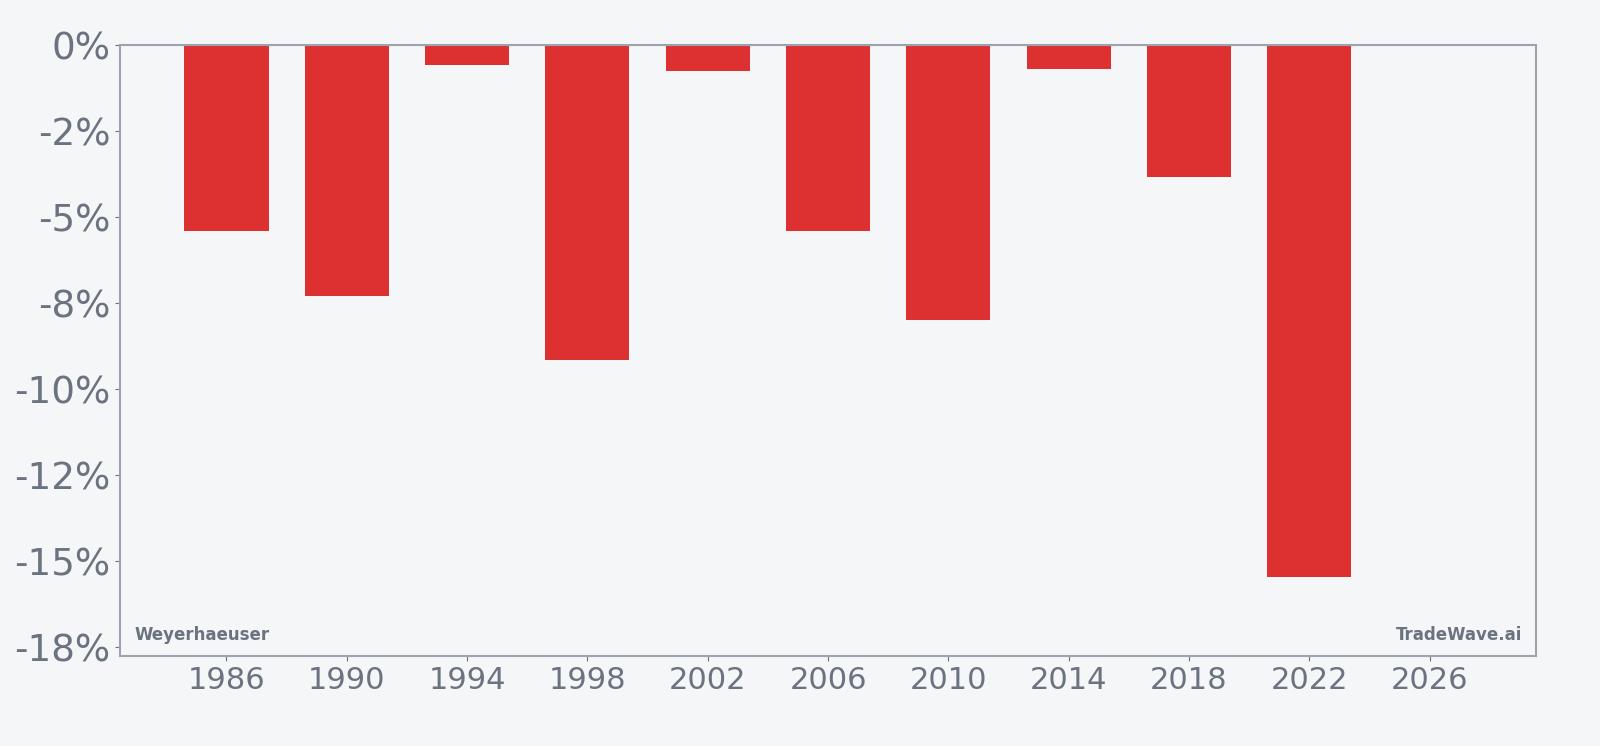
Individual years underline how consistently the pattern has favored shorts. In 2022, a midterm year marked by aggressive Federal Reserve tightening, a short entered at 34.44 and exited at 29.12 for a 15.45% gain, the strongest outcome in the sample. At the other end of the spectrum, 1994 and 2014 both delivered fractional profits of less than 1%, showing that not every iteration has been a big mover even though none finished in the red for the strategy.
Intraperiod swings have still been meaningful. In 1998, Weyerhaeuser’s net move for the window was a 9.15% decline, but the worst drawdown from the entry point reached 13.05% before the trade finished, illustrating how maximum adverse excursion can overshoot the final result. In 2006, the stock’s worst intraperiod move against the short was 11.46% even though the trade ultimately closed with a 5.41% profit, a reminder that path can be rough even when the destination lines up with the pattern.
On the favorable side, several years saw the stock move quickly in the trade direction. The maximum favorable excursion in 1998 reached 5.12%, and in 2010 it hit 3.36%, showing that when the pattern has worked, it has often started to pay off within the window rather than grinding sideways. Combined with a TradeWave Ratio of 1.61, that history suggests the stock has typically traveled a meaningful distance in the short direction before the 23 days are up.
Viewed together, the per-year bars and the smooth seasonal trend tell a simple story: in the last 10 midterm election years, this late-May to late-June window has been a persistent headwind for Weyerhaeuser’s share price, with every sample favoring short exposure on a net basis.
Why does Weyerhaeuser (WY) follow this seasonal pattern?
This midterm-year pattern may reflect a mix of sector rotation and macro timing. One likely driver is that late spring often brings a pause in housing and construction sentiment as investors reassess interest-rate paths and lumber demand heading into the slower summer months. For a timber and real-estate name like Weyerhaeuser, that combination of rate uncertainty and softer building expectations can translate into a short-lived pocket of relative weakness that has repeated across multiple midterm cycles.
History does not guarantee future results, and even in a 10-for-10 window, adverse excursions within the trade can be large enough to challenge risk limits.
What is driving Weyerhaeuser (WY) today?
Weyerhaeuser shares closed Thursday at $24.47, up 2.7% on the session, with the stock trading between a 52-week low of about $20.40 and a high near $27.28. That leaves WY roughly in the middle of its one-year range, with the 50-day moving average around $24.02 and 20-day average volume near 5.4 million shares, a backdrop that suggests liquidity is ample heading into the seasonal window.
The chart below situates the latest move against the past year of trading and overlays a 60-day seasonal projection.
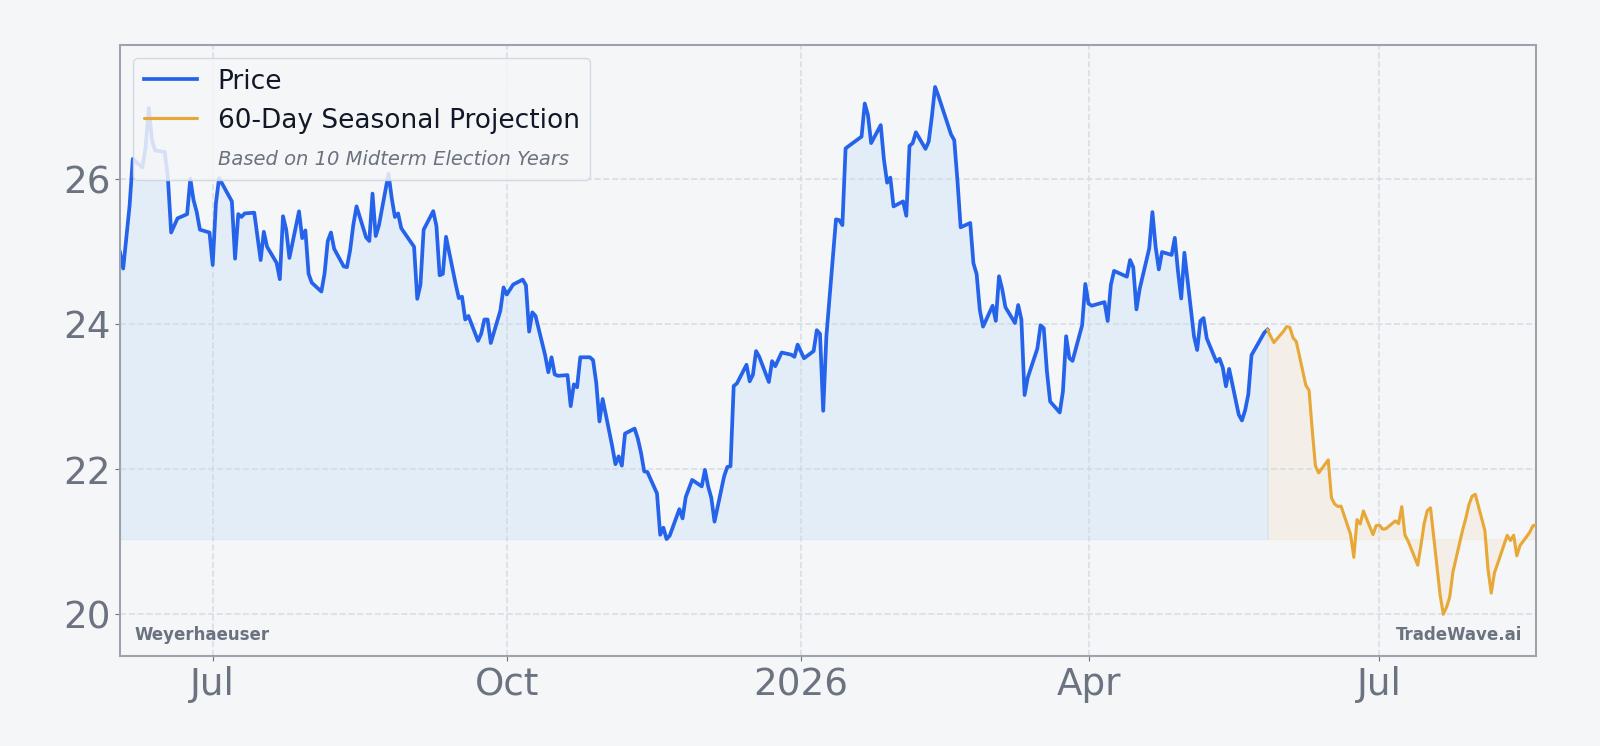
Fundamentally, the setup drops Weyerhaeuser into a familiar tug-of-war between rates and real assets. Higher long-term yields can pressure timber REIT valuations by lifting discount rates, yet they also track economic resilience that supports lumber demand. With the company’s next earnings date not yet on the calendar and no major company-specific catalysts flagged, the near-term story is likely to be driven by macro data, housing indicators and how investors position around the broader midterm-year policy backdrop.
What should traders watch as this Weyerhaeuser window opens?
First, the calendar: the 23-day window begins on May 31 and runs into late June, so price action in the first week will be important for gauging whether this midterm-year pattern is asserting itself again. A quick fade from current levels would rhyme with several past cycles where the stock started to drift lower almost immediately after the window opened.
Second, levels: on the upside, the 52-week high near $27.28 marks the top of the recent range, while the 50-day moving average around $24.02 is a nearby reference point for short-term momentum. Sustained trading above the 50-day line with rising volume would argue that buyers are willing to lean into the stock despite the historical seasonality, while a break back toward the low-$20s would be more in line with the midterm-year pattern.
Third, macro and sector cues: housing starts, building permits and mortgage-rate moves over the next few weeks will shape the broader timber and construction narrative. If those data points soften while policy headlines keep rate volatility elevated, Weyerhaeuser could again behave like a cyclical proxy that struggles in this slice of the calendar. Stronger-than-expected housing data, by contrast, would test how much weight traders are willing to put on the historical pattern versus current fundamentals.
Finally, volatility itself is a signal. In prior years, some of the biggest short-side wins came with sizable intraperiod swings, including double-digit drawdowns before trades finished in the green. If this window opens with choppy, two-way action rather than a clean trend, the way Weyerhaeuser behaves around those swings will help show whether the 10-for-10 record is meeting a genuine challenge or simply facing another midterm-year replay.
Sources
About this seasonal analysis
Seasonal pattern data is sourced from TradeWave.ai, which analyzes historical price behavior across annual calendar windows going back up to 30 years. Read the full data methodology or the book The 100-Year Pattern by Afshin Moshrefi (2026 edition). Past performance of seasonal patterns does not guarantee future results. This article is for informational purposes only and does not constitute investment advice.