Stanley Black & Decker (SWK) Sells $1.8B Aero Unit But Faces a Fresh 44-Day Midterm Slide Window
Stanley Black & Decker is heading into a historically bearish 44-day midterm-year seasonal window just as the stock trades below its recent highs and remains negative for 2026.

What is the seasonal pattern for Stanley Black & Decker (SWK)?
Stanley Black & Decker has fallen in 9 of the last 10 midterm-year summer windows during this 44-day stretch, with an average 7.28% gain for short positions in winning years.
- 9 for 10 in this window, with short trades averaging 7.28% gains in winning years across the last 10 midterm election cycles.
- Percent Profitable is 90%, with 9 winners and 1 loser for the short-side seasonal setup.
- Including every year, Avg Profit - All comes in at 7%, showing that the lone losing year has not erased the pattern’s edge.
- The window runs for 44 trading days starting Jun 2, clustering in the mid-year portion of midterm election years.
- Maximum favorable moves for shorts have reached double digits in several years, while adverse moves have typically been smaller but still meaningful.
- Sharpe ratio of 1.07 and a TradeWave Ratio of 1.67 point to a historically attractive risk-reward profile for this specific SWK seasonal trend.
According to historical data from TradeWave.ai, this midterm-year stretch for Stanley Black & Decker has behaved very differently from an average summer on the calendar, and the next iteration is about to open.
How has Stanley Black & Decker (SWK) traded in this midterm-year summer window?
Stanley Black & Decker has delivered profitable short setups in 9 of the last 10 midterm election years during the 44 trading days starting Jun 2, with average gains of 7.28% in winning years. Shares finished Thursday at 79.53, up 0.76% on the day, leaving the stock about 12.9% below its 52-week high and down 5% year to date.[1] That combination of a historically weak midterm-year summer window and a stock still trading well off its highs gives this upcoming Stanley Black & Decker trading window unusual weight for both bulls and bears.
Grouping the data by the presidential election cycle matters here because midterm election years often feature shifting policy expectations, budget debates and trade headlines that hit industrials differently than in election or pre-election years. For a cyclical name like Stanley Black & Decker, that mid-cycle policy noise has historically lined up with a softer patch in this early-summer slice of the calendar.
This seasonal window begins on Jun 2 and spans 44 trading days. Historically, during this period, Stanley Black & Decker has tended to drift lower, which is favorable for the short trade direction embedded in this pattern. Percent Profitable sits at 90%, with 9 winning short years against just 1 losing year, so the SWK seasonal trend in this midterm-year window has been unusually consistent.
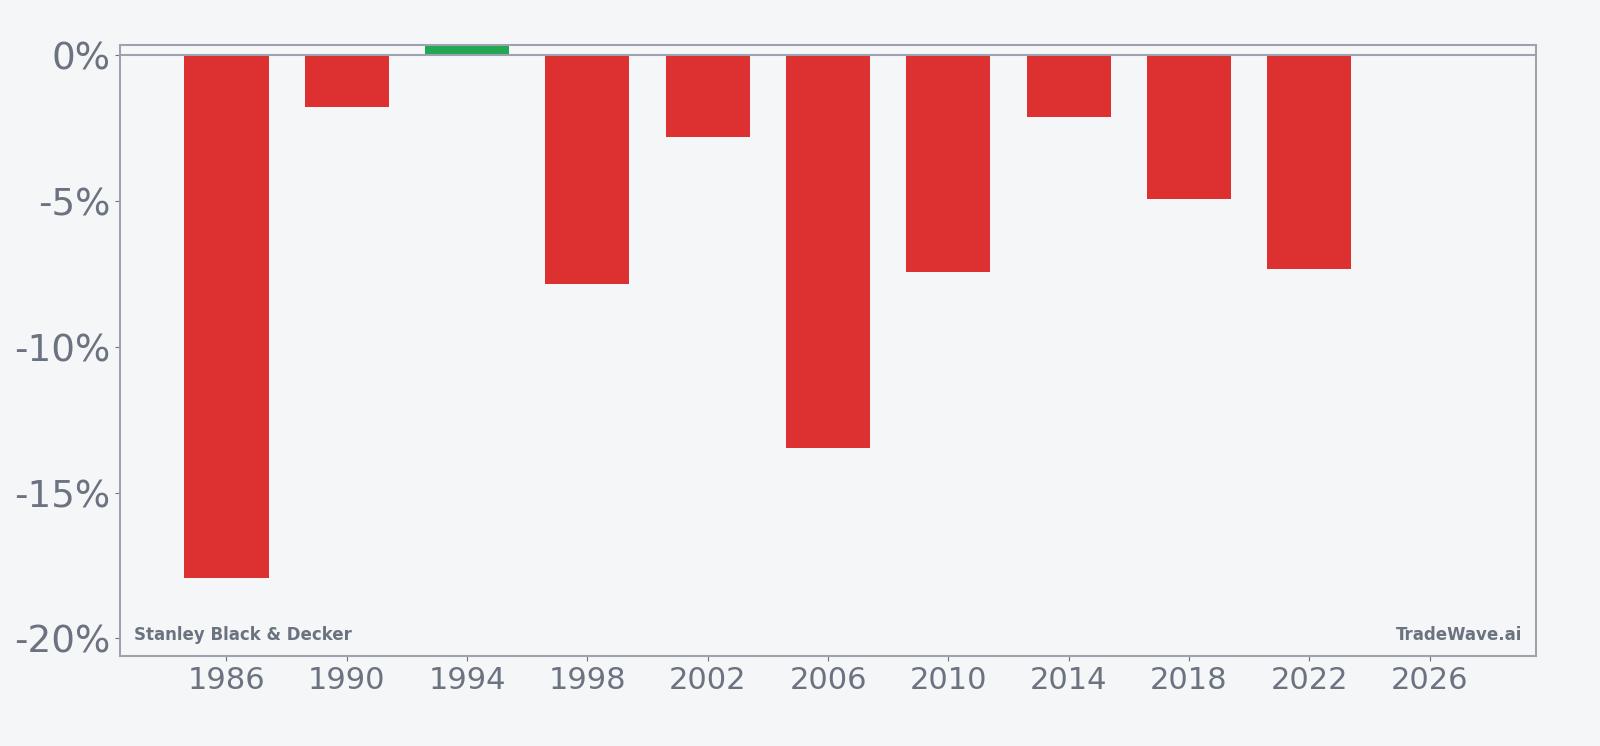
Average profit in the winning years is 7.28%, while the all-years average, which includes the lone losing outcome, is still 7%. That gap is small, which tells you the one bad year did not involve a major squeeze against shorts. The weakest year for the pattern came in 1994, when the stock finished the window up 0.32%, a modest loss for shorts despite an intraperiod rally of 7.91% from the entry level.
The strongest short year in the sample was 1986, when Stanley Black & Decker fell 17.93% across the window. In that case, the maximum favorable move for shorts matched the final result, and the worst intraperiod drawdown from entry was only 1.4%, meaning the trade moved in the intended direction almost from the start. Several other years, including 2006 and 2010, also show double-digit net declines that rewarded patient short positioning.
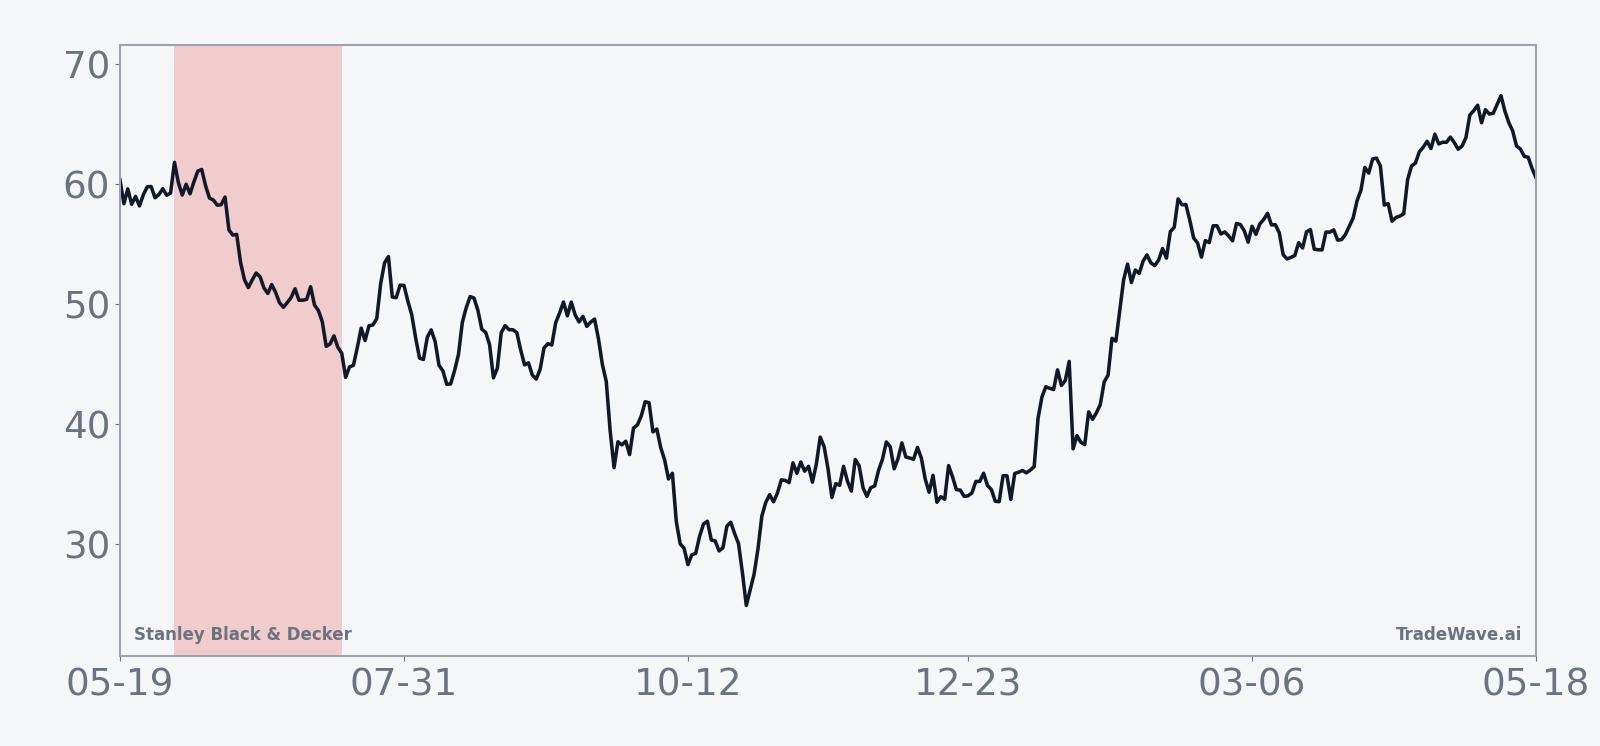
The historical seasonal average trend line slopes steadily lower through most of the 44-day span, with the bulk of the move accruing in the middle third of the window. Early days have sometimes been choppy, but the typical pattern shows weakness building as the window progresses rather than a one-day air pocket.
Year-by-year bars that combine net results with best and worst intraperiod moves show how much room SWK has historically given both shorts and longs inside this window.
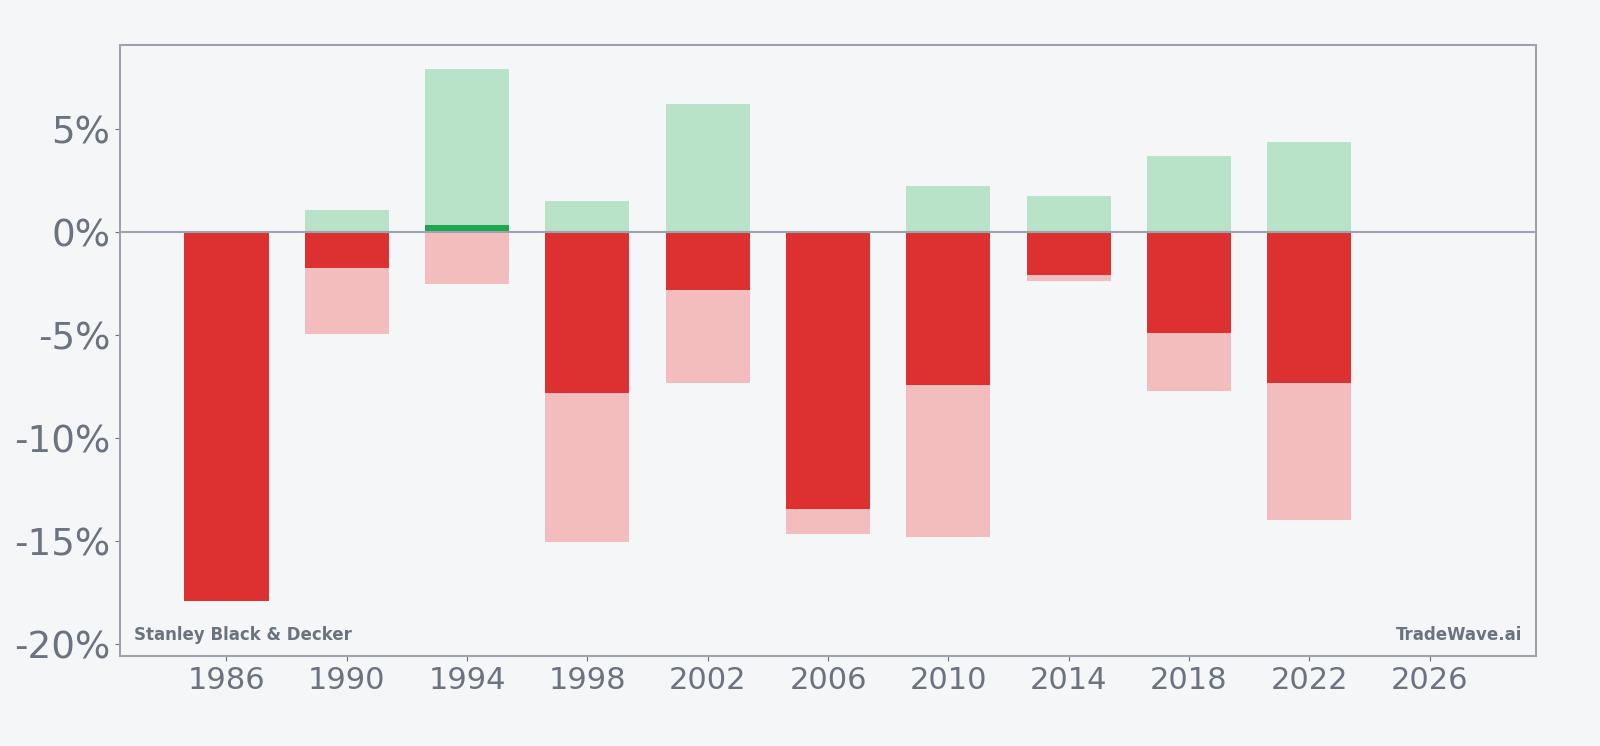
The combined net, maximum favorable move and maximum adverse move bars show that in most years shorts have enjoyed sizable downside excursions, often larger than the final net gain, while adverse spikes against the trade have usually been contained to mid-single digits. The exception is 1994, where a strong intraperiod rally ultimately faded, leaving only a small net loss for shorts by the end of the window.
History does not guarantee future results, and even in winning windows the worst intraperiod drawdown can be large enough to challenge risk limits.
Why does Stanley Black & Decker (SWK) follow this seasonal pattern?
One likely driver is the way industrial and tools companies line up their earnings and guidance updates around midyear, which can expose midterm-year policy uncertainty on trade, tariffs and infrastructure spending. Analysts have also pointed to portfolio rebalancing and sector rotation in the middle of the presidential cycle, when investors often trim cyclical exposure after early-year rallies. For Stanley Black & Decker, that mix of earnings timing and macro noise may help explain why this specific midterm-year summer window has so often favored short positions.
What is driving Stanley Black & Decker (SWK) today?
Stanley Black & Decker closed Thursday at 79.53, up 0.60 points or 0.76% on the session, after trading between 79.07 and 81.15 on volume of about 727,000 shares, below its 20-day average of roughly 1.85 million.[1] The stock sits about 12.9% below its 52-week high of 91.33 and roughly 38.4% above its 52-week low near 57.45, leaving it down 5% for 2026 even after a 1.44% gain over the past month.[1] That backdrop suggests a name that has stabilized above last year’s lows but has not yet convinced investors it deserves to trade back toward the top of its recent range.
Recent trading has been shaped by policy headlines more than company-specific earnings. On Apr 20, CNBC highlighted Stanley Black & Decker among stocks making notable intraday moves after the company said changes to Section 232 tariffs were not expected to have a material impact on its full-year forecast, a comment that helped shares jump more than 4% during the session.[3] The message was that trade policy noise remains a risk factor for industrials, but management does not see the latest tweaks as thesis-changing for 2026.
In the background, Stanley Black & Decker is still reshaping its portfolio. In Dec 2025, the company agreed to sell its Consolidated Aerospace Manufacturing unit to Howmet Aerospace for $1.8 billion in cash, with plans to use the proceeds to reduce debt while the aerospace fasteners business continues to operate under new ownership.[2] That deal, which triggered a sharp intraday rally in the stock at the time, underlined management’s push to streamline the portfolio and focus on core tools and industrial franchises rather than more specialized aerospace exposure.
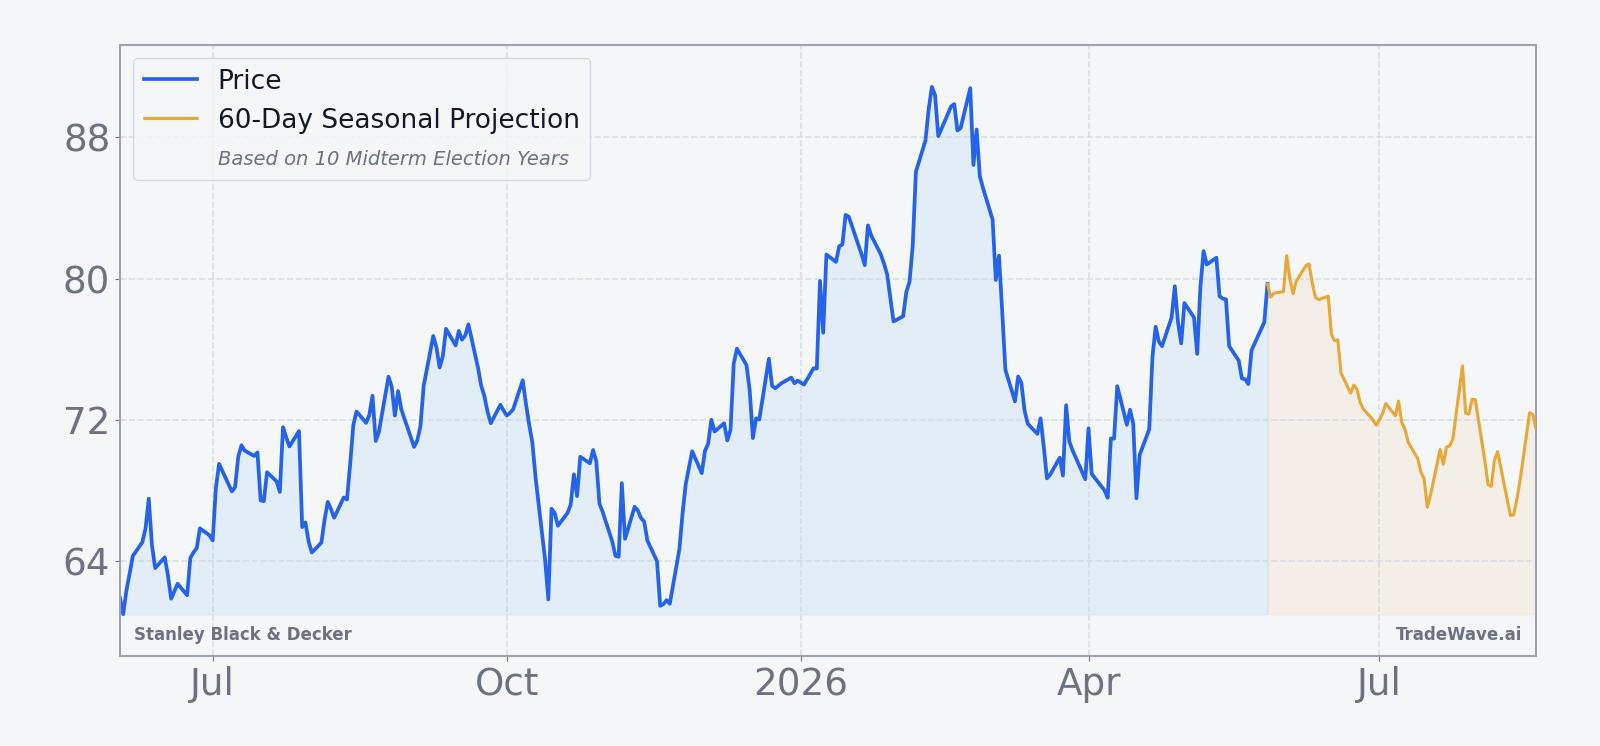
The chart below situates the latest move in its recent multi-month context, alongside a 60-day seasonal projection for the upcoming window.
What should traders watch as this Stanley Black & Decker seasonal window opens?
First, watch how SWK behaves as the Jun 2 window kicks in relative to its 50-day moving average around 74.01 and the 80 level that has acted as a near-term pivot.[1] A quick rejection from the low 80s and a slide back toward the mid-70s would be in line with the historical pattern, while a decisive breakout above the recent range would look more like the rare losing year for shorts.
Second, keep an eye on macro and policy headlines tied to trade and tariffs, which have been key swing factors for the stock in recent months.[3] Any fresh guidance from management or Washington on Section 232 or related measures during this 44-day stretch could either reinforce the historical midterm-year weakness or blunt it if the news is unexpectedly positive for industrial margins.
Third, monitor volume and intraday volatility against the historical playbook. The seasonal record shows that maximum favorable moves for shorts have often unfolded in the middle of the window, with adverse spikes usually capped in the mid-single digits. If this year’s pattern starts with a sharp rally but then stalls, that would echo 1994’s path, where an early squeeze ultimately faded into only a small net loss for shorts by the close of the window.
Finally, watch how the stock trades around any updates on the Howmet aerospace deal closing and broader portfolio moves, which could influence how investors value Stanley Black & Decker’s balance sheet and cyclicality.[2] If the stock shrugs off positive corporate news and still struggles during this midterm-year summer stretch, it would reinforce the idea that the historical seasonality and election-cycle backdrop are exerting real pressure on the name.
Sources
About this seasonal analysis
Seasonal pattern data is sourced from TradeWave.ai, which analyzes historical price behavior across annual calendar windows going back up to 30 years. Read the full data methodology or the book The 100-Year Pattern by Afshin Moshrefi (2026 edition). Past performance of seasonal patterns does not guarantee future results. This article is for informational purposes only and does not constitute investment advice.