L3Harris (LHX) Faces 9-of-10 Losing Midterm Summers as 33-Day Weak Window Opens June 1
L3Harris is heading into a historically weak 33-day midterm-year window starting Jun 1, even as the stock trades well below its 52-week high after a choppy stretch for defense names.

What is the seasonal pattern for L3Harris (LHX)?
L3Harris has fallen in 9 of 10 midterm-year summer windows starting around Jun 1, with an average 4.91% gain in winning years for the short side.
- 9 for 10 in this window, with the short side averaging 4.91% gains in winning years and a 4% average move across all years.
- The 33-day trading window begins on Jun 1 and is grouped across the last 10 midterm election years, not consecutive calendar years.
- Percent Profitable is 90%, with 9 winners and 1 loser for the short direction in this LHX seasonal trend.
- Avg Profit reflects winners only at 4.91%, while Avg Profit - All, which includes the lone losing year, comes in at 4%.
- Historical intraperiod swings have been meaningful, with years like 1998 and 2010 showing double-digit peak moves and sizable drawdowns for shorts.
- Add it up: a 50% cumulative return for the short side across these ten midterm-year windows, paired with a TradeWave Ratio of 2.13 and a Sharpe ratio of 1.13.
According to historical data from TradeWave.ai, this upcoming stretch for L3Harris behaves very differently from an average month on the calendar. The next section walks through how that midterm-year pattern has played out in prior cycles and what it implies for the approaching June window.
How has L3Harris (LHX) traded in this midterm-year June window?
L3Harris has fallen in 9 of the last 10 midterm election years during the 33 trading days starting Jun 1, with the short side posting a 50% cumulative gain across those windows. Shares finished Friday at $311.93, up 1.8% on the day and sitting about 17.7% below their 52-week high of $379.23.[1] That combination of a historically weak early-summer stretch and a stock already well off its highs gives this year’s window extra weight for traders watching the defense sector’s seasonal outlook.
Because this pattern is grouped by the presidential election cycle, it only looks at midterm election years, which often feature shifting defense budgets and policy debates that can jolt contractors. In this specific L3Harris trading window, the historical bias has favored shorts, with 90% of the sampled years delivering a net decline over the 33-day span.
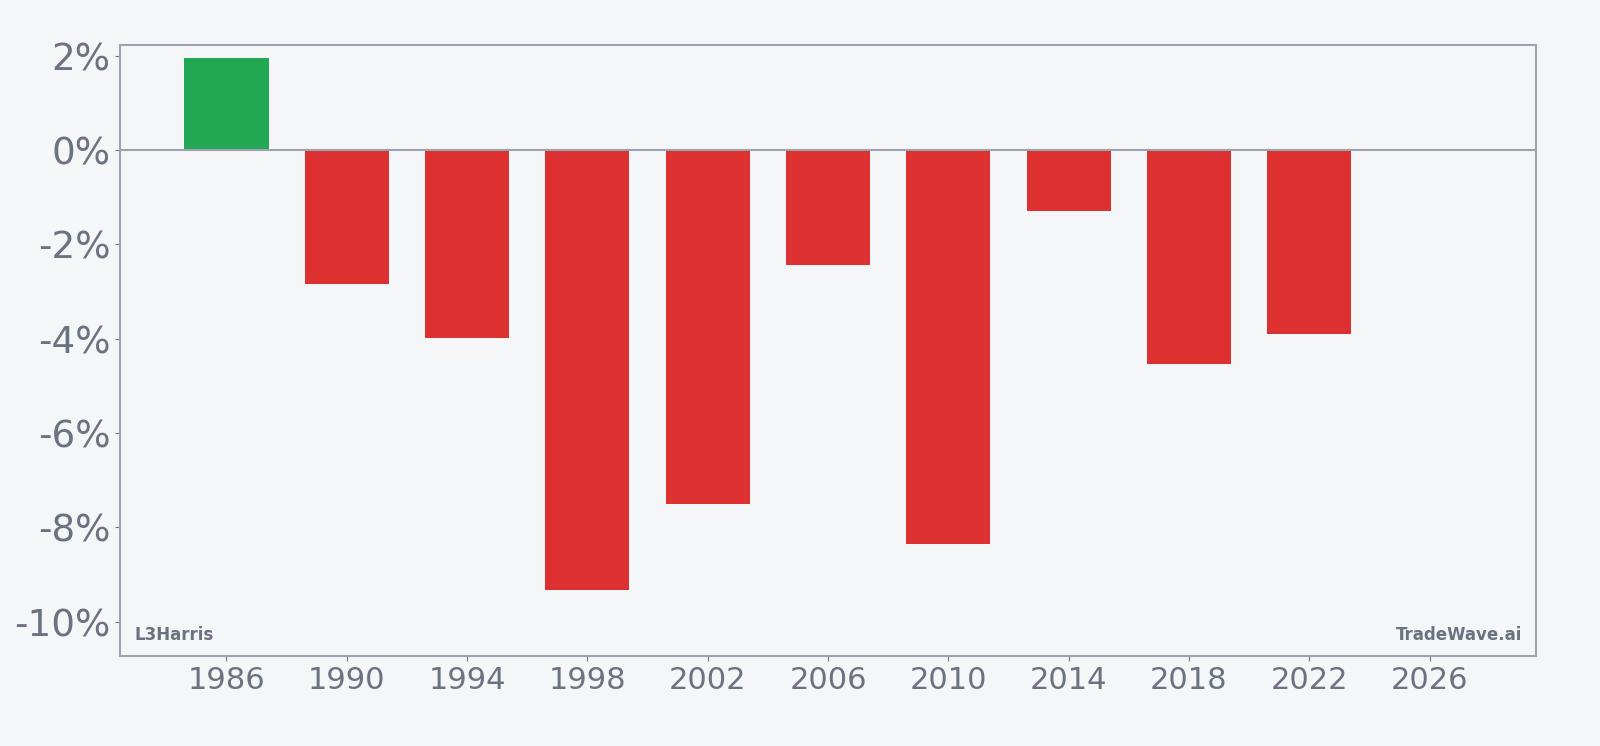
Across those ten midterm-year windows, the short side’s Avg Profit is 4.91%, while the all-years average including the lone losing year is 4%. That gap shows how one unfavorable year can dent results but has not erased the broader tendency for LHX to drift lower in this slice of the calendar. Median Profit of 3.94% lines up with that story of steady, if not spectacular, downside follow-through.
The per-year table shows how that has played out in practice. In 1998, for example, the short side booked a 9.34% gain as L3Harris slid over the window, with a maximum favorable move of 1.69% and a maximum adverse move of 16.21% from the entry. In 2010, shorts captured an 8.36% net return, but the stock still staged an 8.54% intraperiod rally at one point before rolling over, underscoring how choppy the path can be even in winning years.
On the flip side, 1986 stands out as the lone losing year for shorts, with a 1.94% net loss despite a 5.82% best favorable move and a 6.2% worst adverse move. That mix of outcomes helps explain why the Sharpe ratio sits at 1.13: the pattern has been consistently profitable for the short direction, but the ride has not been smooth.
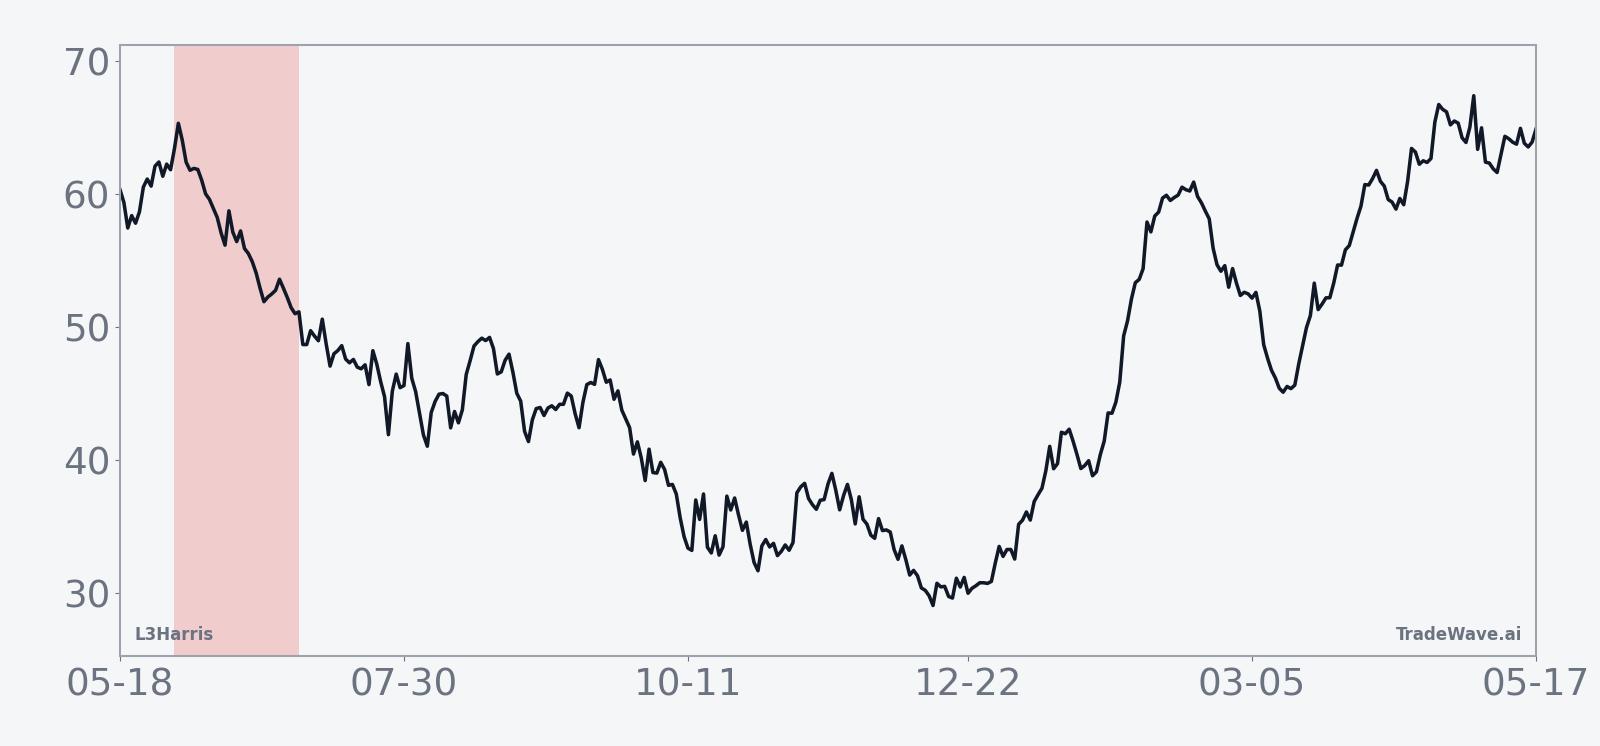
The historical seasonal average trend for this L3Harris trading window slopes lower rather than collapsing in a straight line. The typical pattern shows modest early weakness, a mid-window bounce, and then renewed pressure into the back half of the 33 days, which is where many of the larger short-side gains have tended to accrue.
A second view that layers in best and worst intraperiod swings helps frame the risk around that average path.
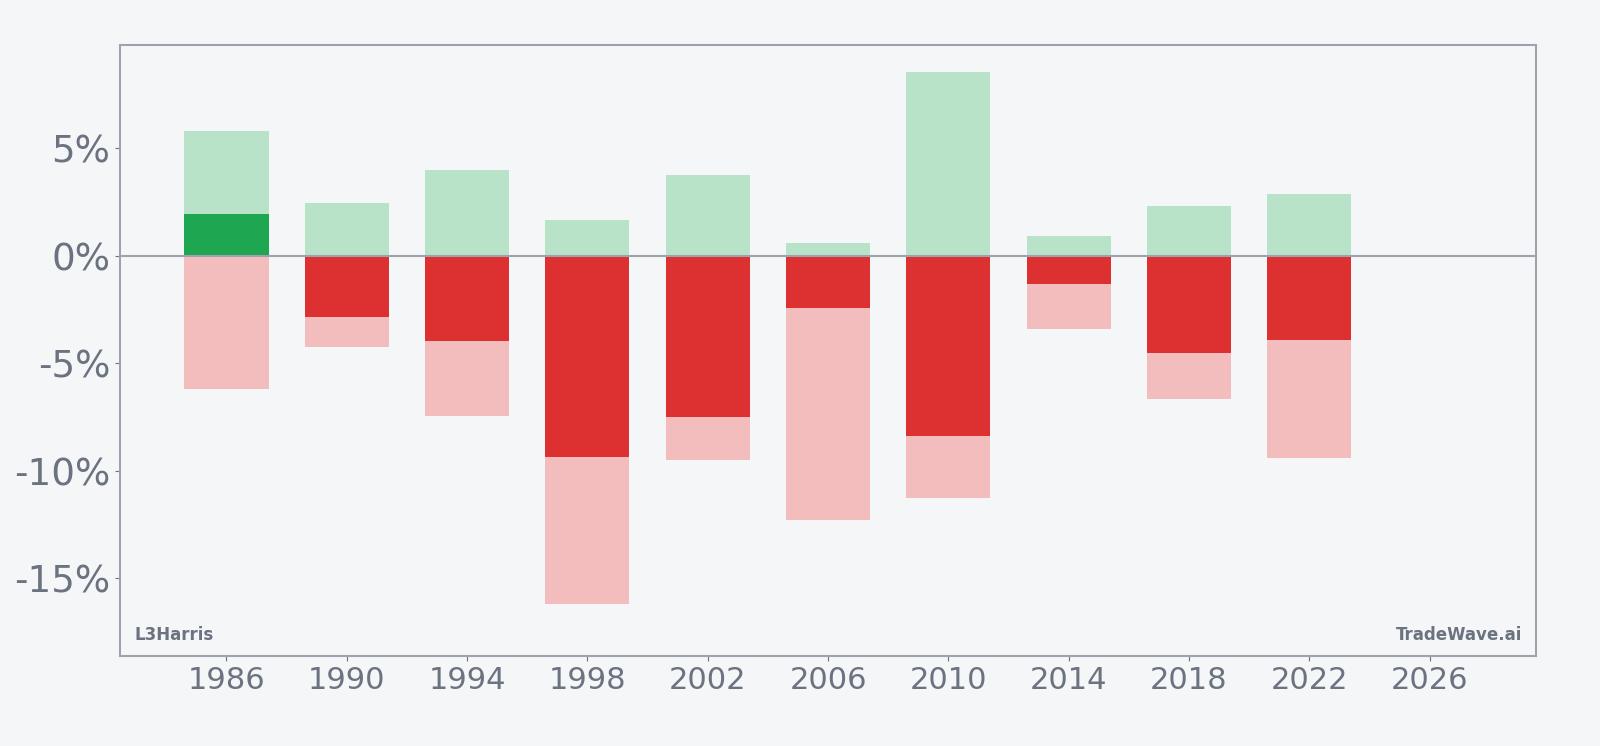
The combined net, peak favorable move and worst drawdown bars show a window where shorts have often seen sizable intraperiod rallies before the trade worked. Large maximum adverse moves in years like 1998, 2006 and 2010 highlight that even a historically bearish seasonal pattern can involve sharp squeezes against the trade before the prevailing midterm-year trend reasserts itself.
History does not guarantee future results; adverse excursions (MAE) can be large even in winning windows.
Why does L3Harris (LHX) follow this seasonal pattern?
One likely driver is the way defense spending debates and appropriations bills cluster in midterm election years, which can delay contract awards and unsettle contractor stocks. Analysts have also pointed to institutional portfolio repositioning around the fiscal year and shifting risk appetite as investors reassess exposure to politically sensitive sectors. For L3Harris, that mix of policy uncertainty and portfolio shuffling may help explain why this early-summer midterm window has so often leaned bearish.
What is driving L3Harris (LHX) today?
L3Harris closed at $311.93 on May 22, up 1.8% on the day, after a rough month that left the stock down 10.73% over the past 30 days and well below its 50-day moving average of $339.04.[1] The stock is trading about 17.7% under its 52-week high of $379.23 and comfortably above its 52-week low near $220.43, putting it in the middle of its one-year range as investors weigh a shifting mix of contract wins, divestitures and policy moves.[1]
In January 2026, L3Harris reported fourth-quarter revenue of $5.65 billion, a 2% year-on-year increase that nonetheless missed the $5.78 billion consensus estimate after a 43-day U.S. government shutdown delayed contract awards and procurement.[1] In January 2026, the company also closed the sale of a 60% stake in its space propulsion business for $845 million, part of a broader push to focus on core defense and missile systems.[6] In January 2026, the Pentagon agreed to invest $1 billion in L3Harris’s rocket motor business through a convertible structure that could give the government a pre-IPO stake in the Missile Solutions unit, underscoring Washington’s urgency to shore up domestic missile supply chains.[7]
Earlier in the cycle, in July 2025, L3Harris raised its 2025 revenue outlook to $21.75 billion after posting second-quarter adjusted earnings per share of $2.78, ahead of the $2.50 consensus, as steady demand for defense electronics and communications gear offset cost pressures.[2] In November 2025, the company announced a $400 million investment to expand solid rocket motor production in Arkansas six-fold, citing sustained demand tied to the Russia-Ukraine war and conflicts in the Middle East.[3] In August 2025, L3Harris also partnered with Joby Aviation to develop a military variant of Joby’s electric vertical take-off and landing aircraft, with flight testing targeted for fall 2025 and demonstrations in 2026, a move that could open a new niche in advanced air mobility for defense customers.[4]
Those moves sit against a broader backdrop where defense contractors supplying solid rocket motors for systems such as Patriot, THAAD, Tomahawk and Javelin have faced both surging demand and supply chain strains, including tariff-related cost pressures.[7] The company’s 2026 revenue guidance of $23 billion to $23.5 billion, which incorporates the partial sale of the space business, signals management’s confidence that elevated geopolitical tensions and the Pentagon’s push to rebuild munitions stockpiles will keep the order book healthy even as budget debates in Washington remain contentious.[1]
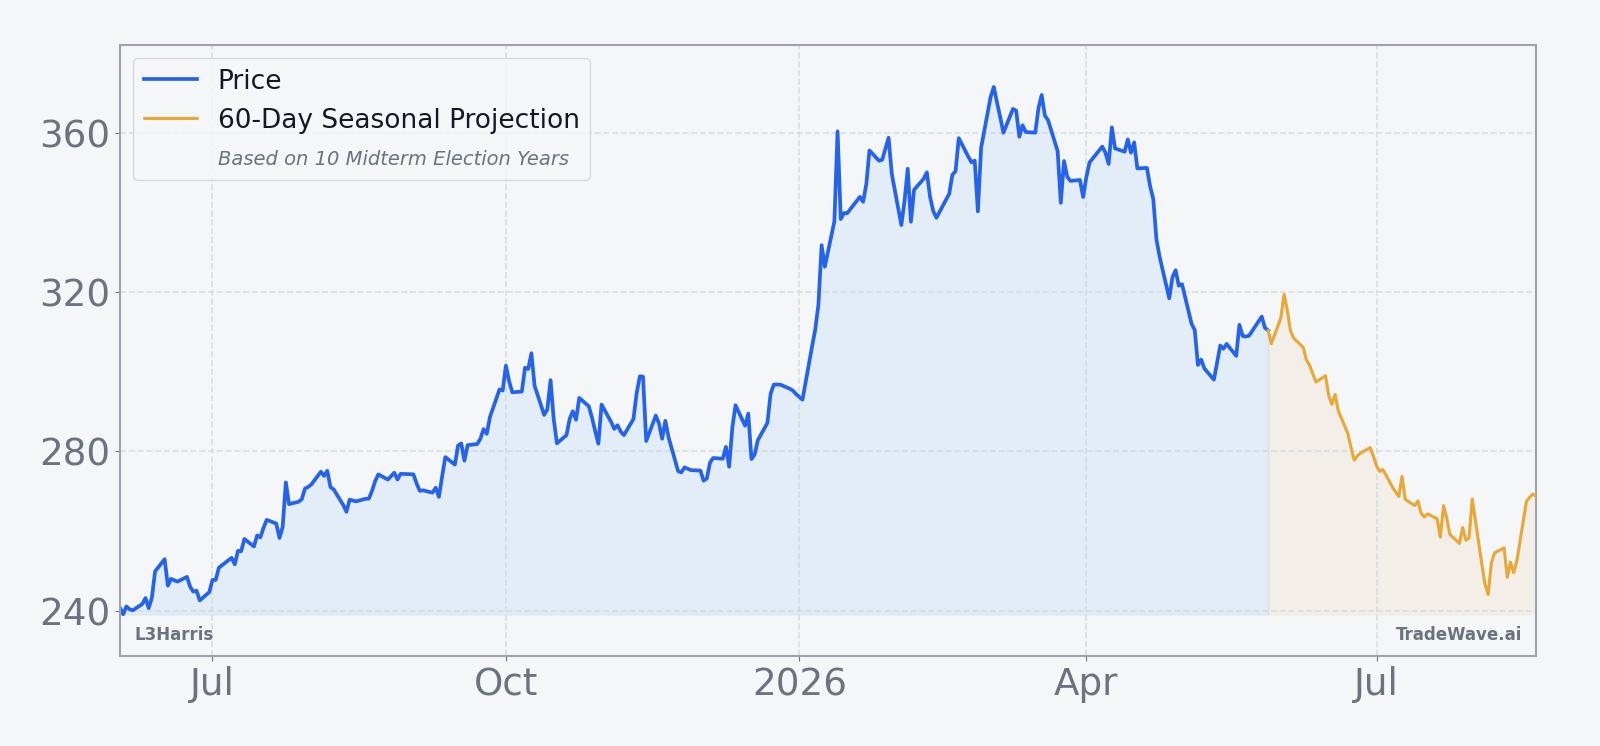
The chart below situates the latest move in its recent multi-month context and overlays the upcoming seasonal projection.
What should traders watch in this L3Harris seasonal window?
For the 33 trading days starting Jun 1, the historical LHX seasonal trend suggests that mid-window bounces have often given way to renewed pressure later in the stretch. Traders watching this year’s iteration will be focused on whether any early June strength fades into that familiar pattern of late-window weakness or whether a stronger fundamental backdrop breaks the midterm-year script.
Key levels to watch include the 50-day moving average near $339, which has acted as a ceiling in recent weeks, and the 52-week high around $379, which would mark a decisive break from the historical midterm-year pattern if reclaimed quickly.[1] On the downside, the $300 area and then the low-$280s, where prior pullbacks have stalled, will be important markers for whether this window again tilts in favor of the short direction.
Policy and budget headlines will matter as well. Any fresh signals on U.S. defense appropriations, missile stockpile replenishment or export approvals could either reinforce the typical midterm-year softness if delays emerge or blunt it if funding flows faster than in past cycles. Traders will also be watching execution on the Arkansas rocket motor expansion and the Pentagon’s $1 billion investment structure for signs of how quickly L3Harris can translate policy support into revenue and margin traction.[3][7]
Ultimately, the test for this window is straightforward: if L3Harris spends most of June and early July grinding lower from current levels, it would mark the tenth time in eleven midterm-year cycles that the short side has been rewarded in this specific slice of the calendar. A sustained rally through resistance, by contrast, would be a clear break from a pattern that has held up across four decades of midterm election years.
Sources
- Reuters: L3Harris quarterly revenue misses estimates on government shutdown pressures (Jan 29, 2026)
- Reuters: Defense contractor L3Harris raises 2025 outlook on steady demand (Jul 24, 2025)
- Reuters: L3Harris to invest $400 million to expand solid rocket motor production in Arkansas (Nov 18, 2025)
- Reuters: L3Harris, Joby Aviation partner to develop military aircraft (Aug 1, 2025)
- Reuters: L3Harris sells 60% stake in space propulsion business for $845 million (Jan 5, 2026)
- Reuters: Pentagon to invest $1 billion in L3Harris rocket motor business (Jan 13, 2026)
About this seasonal analysis
Seasonal pattern data is sourced from TradeWave.ai, which analyzes historical price behavior across annual calendar windows going back up to 30 years. Read the full data methodology or the book The 100-Year Pattern by Afshin Moshrefi (2026 edition). Past performance of seasonal patterns does not guarantee future results. This article is for informational purposes only and does not constitute investment advice.