L3Harris (LHX) Has Dropped in 9 of 10 Midterm Summers as a 33-Day Weak Window Opens
L3Harris is heading into a 33-day midterm-year seasonal window that has historically favored downside, even as the stock trades well below its 52-week high.

What is the seasonal pattern for L3Harris (LHX)?
L3Harris has fallen in 9 of 10 midterm-year summer windows starting around Jun 1, with an average gain of 4.91% in winning years for the short setup.
- 9 for 10 in this window, with the short trade profitable in 90% of midterm-year cycles.
- The 33-day window begins on Jun 1 and has historically been a bearish seasonal stretch for L3Harris.
- Percent Profitable is 90%, with 9 winners and 1 loser for the short direction across the last 10 midterm election years.
- Average profit in winning years is 4.91%, while Avg Profit - All, including the lone losing year, is 4%.
- Intraperiod swings have been meaningful, with sizable best-case rallies in the trade direction and notable adverse drawdowns in several years.
- The pattern clusters specifically in midterm election years, tying the LHX seasonal trend to the U.S. policy and defense spending calendar.
According to historical data from TradeWave.ai, this early-summer stretch in midterm election years has behaved very differently from an average month for L3Harris, and the next iteration is about to open again.
How has L3Harris (LHX) traded in this midterm-year summer window?
L3Harris has fallen in 9 of the last 10 midterm election years during this 33-day window starting Jun 1, with the pattern designed as a short setup. Shares finished Thursday at 313.85, leaving the stock about 16.7% below its 52-week high of 376.60 and roughly 35.3% above the 52-week low of 231.91. That combination of a historically weak early-summer window and a stock sitting in the middle of its one-year range gives traders a clean seasonal line in the sand for the weeks ahead.
The pattern is grouped by the presidential election cycle, focusing on the last 10 midterm election years rather than consecutive calendar years. That matters for a defense contractor like L3Harris because midterm years often coincide with budget fights, continuing resolutions and shifting procurement priorities in Washington, all of which can affect order timing and investor positioning in the aerospace and defense sector.[2]
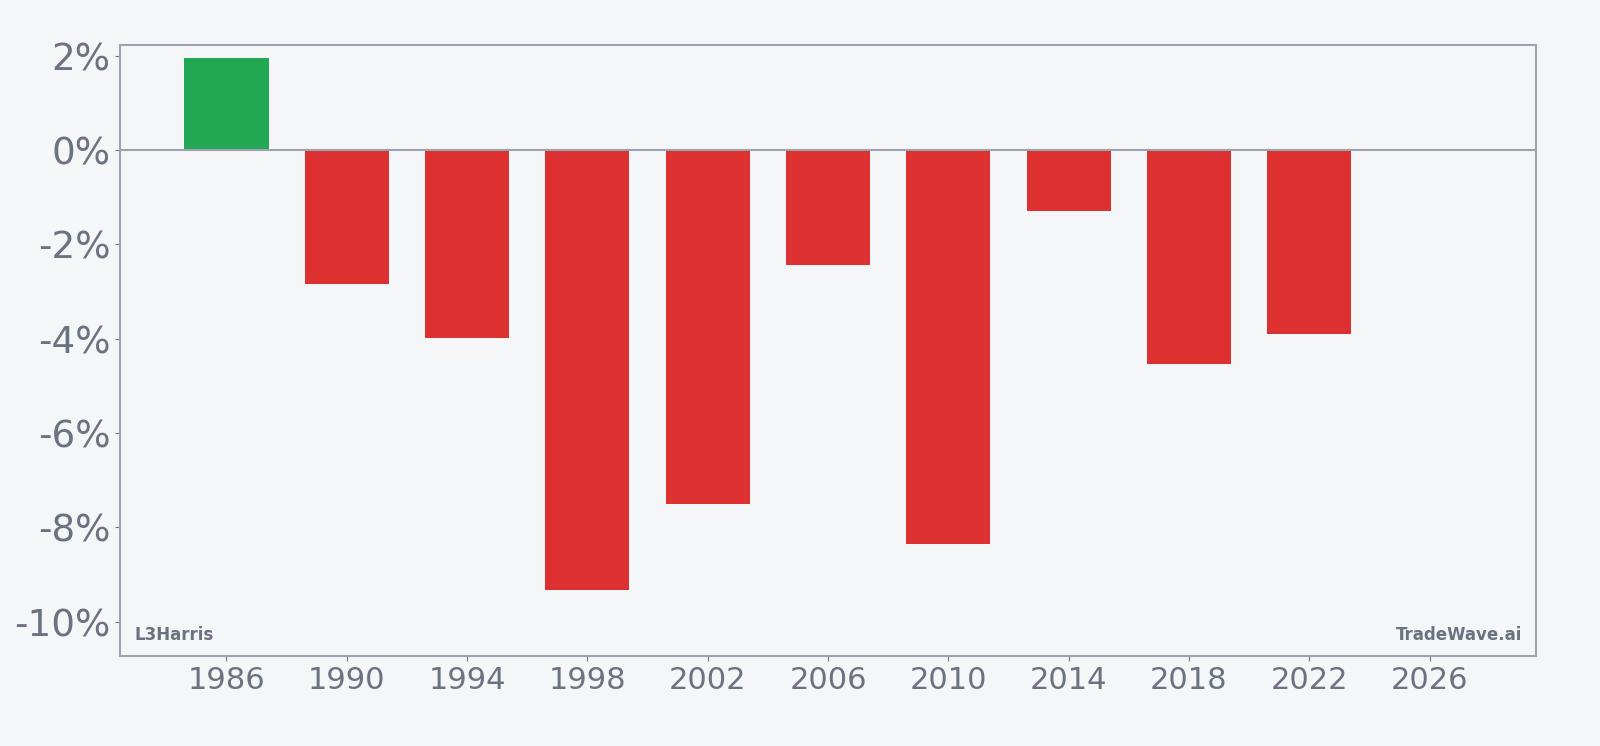
Across those 10 midterm-year samples, the short trade has been profitable 90% of the time, with 9 winners and just 1 losing year. Average profit in the winning years is 4.91%, while the all-years average, including the one loss, is still a solid 4%. The median outcome is a 3.94% gain for the short, which lines up with the idea that this is a consistently soft stretch for the stock rather than a pattern driven by one or two outliers.
The per-year table shows that the strongest short years, such as 1998 and 2010, delivered net declines of 9.34% and 8.36% respectively, measured from entry to exit over the 33 trading days. The weakest outcome for the short was 1986, when L3Harris rose 1.94% during the window and the trade lost money. Even in that year, the stock still moved meaningfully intraperiod, with a best point-to-peak move in the trade direction of 5.81% before reversing.
The historical seasonal average trend line slopes lower through most of the 33-day span, with the bulk of the downside accruing in the middle of the window rather than at the open or close. That suggests the typical pattern is not an immediate gap lower but a grind that builds over several weeks, punctuated by short-lived countertrend rallies.
A second view of yearly net returns alongside best and worst intraperiod swings shows how much room LHX has historically had to move inside this window.
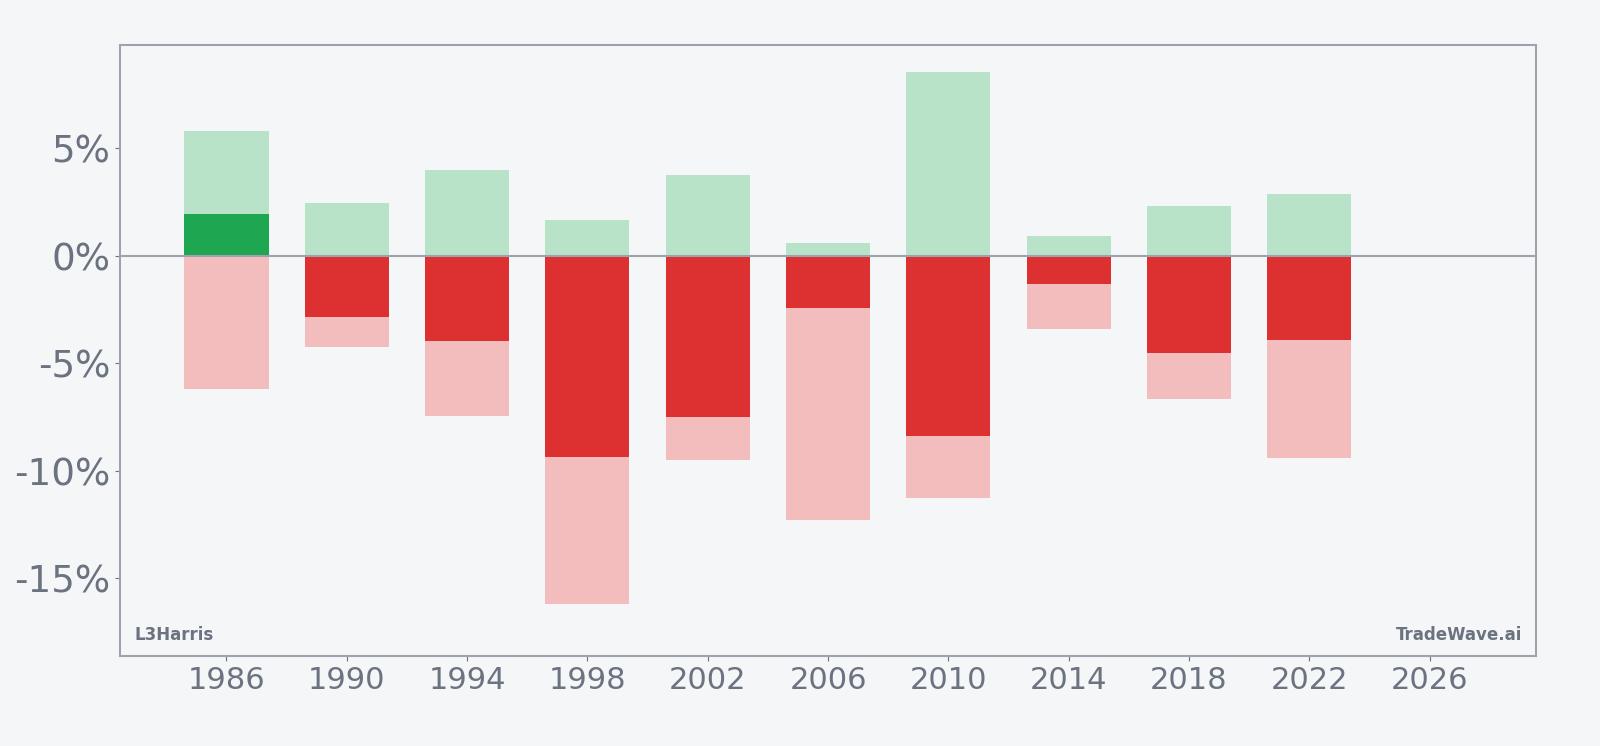
The stacked net, maximum favorable excursion and maximum adverse excursion bars show that even in winning short years, L3Harris has often experienced sizable rallies against the trade before rolling over. In 2006, for example, the worst intraperiod drawdown from entry was about 12.31% against the short, while the best move in the trade direction was only 0.58%, underscoring how choppy this window can be even when it ultimately finishes lower. The TradeWave Ratio of 2.13 indicates that price has typically traveled meaningfully in the trade direction within the window, independent of the final close.
Put together, the message from the seasonal stats is straightforward: in midterm election years, this early-summer 33-day stretch has historically favored short exposure in L3Harris, with a high hit rate and enough intraperiod volatility to matter for risk management. Nine for ten is a strong record for any stock pattern analysis, especially when the all-years average still points in the same direction.
Why does L3Harris (LHX) follow this seasonal pattern?
One likely driver is the way U.S. defense budgets and procurement decisions cluster around the midyear fiscal and political calendar, especially in midterm election years when Congress often wrangles over spending levels and program priorities.[2] Analysts have pointed to government shutdowns and contract delays as recurring headwinds for L3Harris, which can weigh on sentiment and orders around this time of year.[2] The pattern may also reflect institutional portfolio repositioning in aerospace and defense as investors react to evolving geopolitical risk and shifting expectations for Pentagon outlays.[4]
History does not guarantee future results; adverse excursions can be large even in winning windows, and traders should treat this seasonal tendency as context rather than a forecast.
What is driving L3Harris (LHX) today?
L3Harris closed Thursday at 313.85, up 1.6% on the day, with roughly 655,000 shares changing hands against a 20-day average volume of about 1.39 million. The stock sits below its 50-day moving average of 331.51, underscoring how it has cooled off after a strong run that took it to a 52-week high near 376.60 before pulling back about 16.7%.
In Jan 2026, L3Harris reported Q4 revenue of $5.65 billion, missing Street estimates after a prolonged U.S. government shutdown delayed contract awards and procurement activity.[2] The company still guided 2026 revenue to a range of $23.0 billion to $23.5 billion, signaling confidence in underlying demand even as timing noise from Washington clouds quarter-to-quarter results.[2] Earlier, in Jul 2025, L3Harris had raised its 2025 outlook after beating Q2 estimates, citing steady demand for defense products tied to heightened geopolitical tensions.[1]
Strategically, L3Harris has been reshaping its portfolio. In Jan 2026 it agreed to sell about a 60% stake in its space propulsion and power systems business to AE Industrial Partners for $845 million including debt, part of a broader realignment toward higher-priority platforms.[5] Around the same time, the Pentagon said it would invest $1 billion via a convertible security into L3Harris’ rocket motor business, with a planned IPO in the second half of 2026, a move that both supports growth and raises questions about competitive dynamics and potential conflicts of interest in the defense industrial base.[4]
Those corporate moves sit against a macro backdrop of elevated demand for arms and military equipment amid the Russia-Ukraine war and Middle East tensions, which has boosted sales and backlog for L3Harris and its peers.[1] At the same time, the company’s Q4 experience shows how vulnerable quarterly revenue can be to U.S. government procurement policy and shutdown risk, a theme that lines up with the midterm-year seasonal pattern flagged by the data.[2]
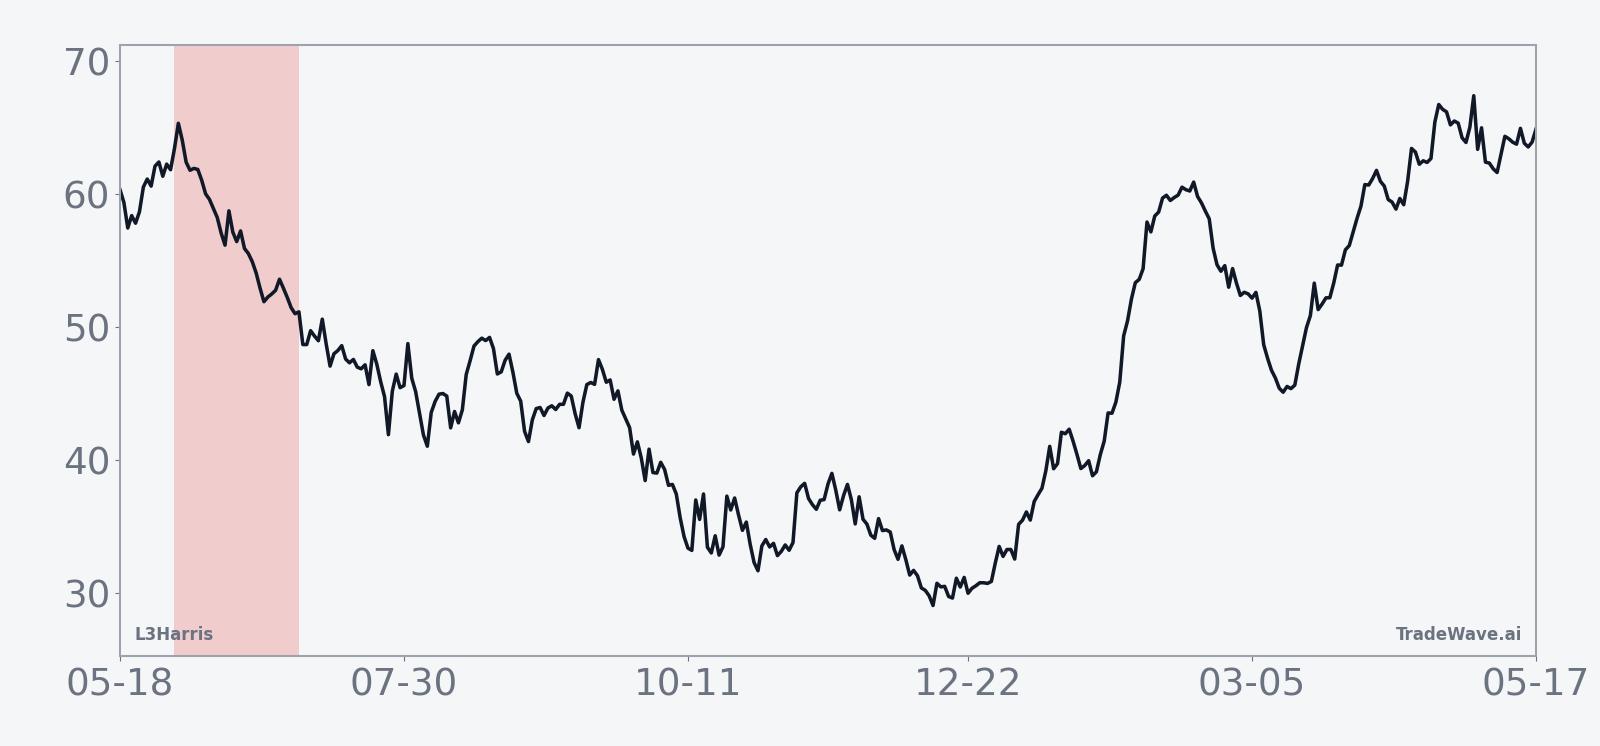
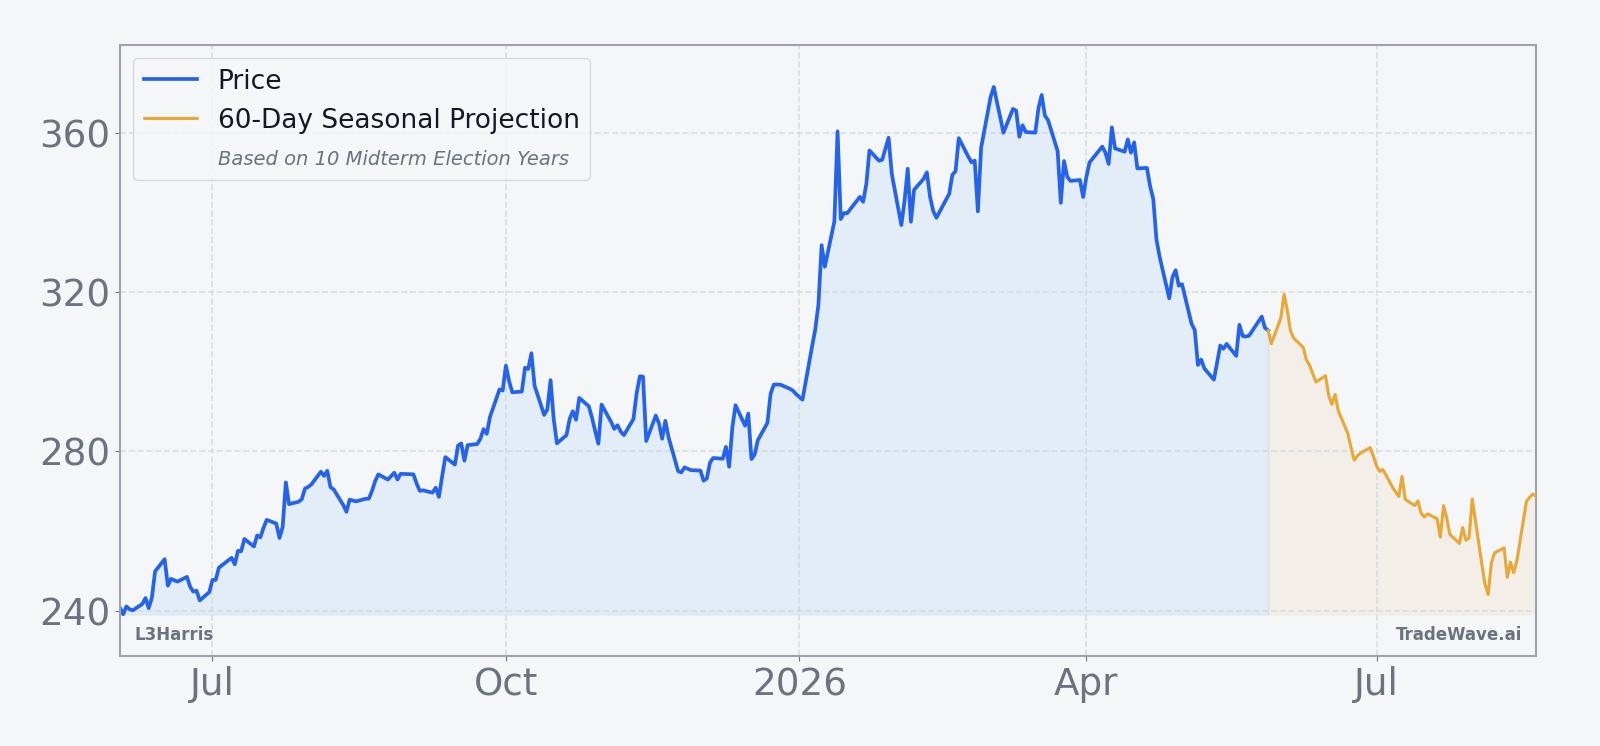
The chart below situates the latest move in its recent multi-month context and overlays the upcoming seasonal projection.
What should traders watch in this L3Harris seasonal window?
For this 33-day midterm-year window starting Jun 1, the first watchpoint is how L3Harris trades around its 50-day moving average near 331.51. A failure to reclaim that level, or a quick rejection after a test, would be consistent with the historical pattern of mid-window weakness, while a decisive break above it would look more like the rare losing year for the short setup.
Policy and budget headlines out of Washington will matter as well. Any renewed noise around continuing resolutions, shutdown risk or shifts in Pentagon procurement priorities could revive the kind of contract timing uncertainty that weighed on Q4 revenue and has historically lined up with softer stretches for the stock.[2] Traders should also track news flow around the planned rocket motor business IPO and the Pentagon’s $1 billion investment, since changes in that timeline or structure could alter how investors value L3Harris’ growth pipeline.[4]
Inside the window, behavior relative to the historical intraperiod swings will be telling. If LHX sees an early rally of several percent followed by a grind lower, that would echo the pattern of sizable adverse moves against the short before the trade ultimately works. A clean, low-volatility drift higher through the entire span, by contrast, would be a clear break from the last 10 midterm election years and a sign that the current macro and policy mix is overpowering the usual seasonal script.
Sources
- [1] Reuters, "Defense contractor L3Harris raises 2025 outlook on steady demand", Jul 24, 2025.
- [2] Reuters, "L3Harris quarterly revenue misses estimates on government shutdown pressures", Jan 29, 2026.
- [4] Reuters, "Pentagon to invest $1 billion in L3Harris rocket motor business", Jan 13, 2026.
- [5] Reuters, "L3Harris sells 60% stake in space propulsion business for $845 million", Jan 5, 2026.
- [9] Reuters, "L3Harris, Joby Aviation partner to develop military aircraft", Aug 1, 2025.
About this seasonal analysis
Seasonal pattern data is sourced from TradeWave.ai, which analyzes historical price behavior across annual calendar windows going back up to 30 years. Read the full data methodology or the book The 100-Year Pattern by Afshin Moshrefi (2026 edition). Past performance of seasonal patterns does not guarantee future results. This article is for informational purposes only and does not constitute investment advice.