From Record Highs to a Weak June: Parker Hannifin (PH) Faces Fresh Downside Risk
Parker Hannifin is stepping into a historically weak 24-day June trading window just as its stock pulls back from record territory, raising the stakes for short-term traders.

What is the seasonal pattern for Parker Hannifin (PH)?
Parker Hannifin has fallen in 9 of 10 midterm-election-year June windows during this 24-day stretch, with an average 5.33% gain for the short side in winning years.
- 9 for 10 in this window, with short trades averaging 5.33% profit in winning years.
- The 24-day pattern starts on Jun 2 and runs through late June in midterm election years.
- Percent Profitable is 90%, with 9 winning short years and just 1 losing year across the sample.
- Including all years, Avg Profit - All is 5%, showing that losers have been relatively small versus winners.
- Trade Direction is short, and the TradeWave Ratio of 2.0 signals meaningful travel in the trade direction inside the window.
- Intraperiod swings have been sizable, with adverse moves that can be deep even in years that finish profitable for shorts.
According to historical data from TradeWave.ai, this specific June stretch in midterm election years has behaved very differently from an average month for Parker Hannifin, and the next iteration is now underway.
How has Parker Hannifin (PH) traded in this midterm-year June window?
Parker Hannifin has delivered profitable short setups in 9 of the last 10 midterm-election-year June windows, with average winning trades of 5.33% over 24 trading days. The latest window begins Jun 2, 2026, with the stock last changing hands at about 823.3, roughly 20.1% below its 52-week high near 1,030.3 and still well above its 52-week low around 635.4. That combination of a stretched multi-year run and a historically soft midterm-year June pattern gives traders a clean calendar line to watch for potential mean reversion.
Grouping the data by the presidential election cycle matters here because midterm years often feature policy uncertainty, spending debates and shifting rate expectations that can hit industrial cyclicals harder than the broad market. This Parker Hannifin trading window looks only at the last 10 midterm election years, so the pattern reflects how the stock has behaved in that specific macro and policy backdrop rather than across a generic decade of calendar Junes.
Across those 10 midterm-year samples, the PH seasonal trend is strikingly one-sided for a short bias. Percent Profitable sits at 90%, with 9 winners and just 1 loser, and even when you include that losing year the Avg Profit - All still comes in at 5%. For traders who focus on stock pattern analysis, that combination of a high hit rate and only modest dilution from the lone losing year is unusual for a single-name industrial stock.
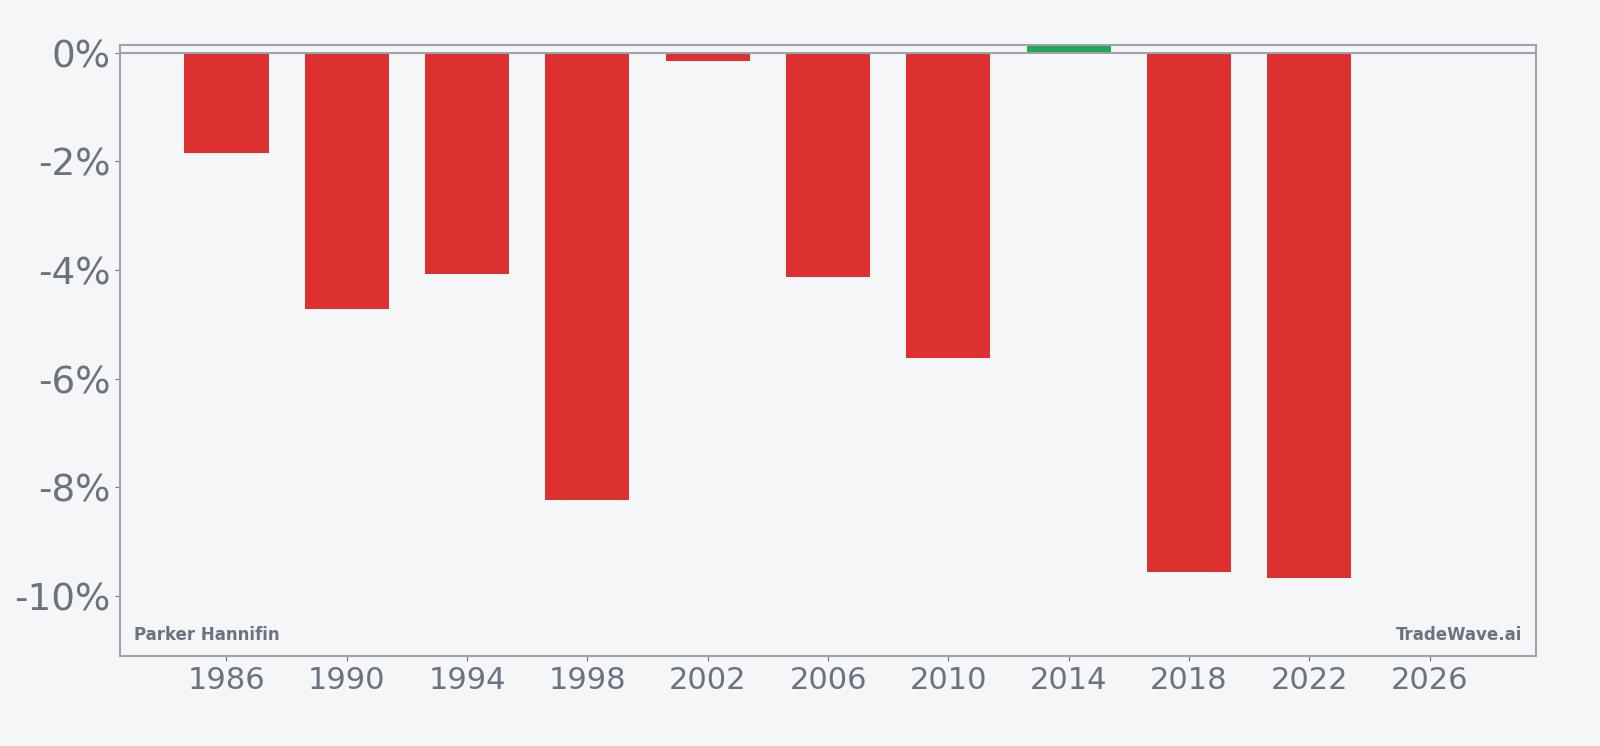
Because the Trade Direction is short, negative net returns in the per-year table represent favorable outcomes for the pattern. Years like 2018 and 2022, which show net returns of -9.56% and -9.67% respectively, would have delivered strong gains for traders positioned short at the start of the window. The only clear miss for the pattern is 2014, when the stock finished the window slightly higher, with a 0.13% net return that would have been a small loss for shorts.
The historical seasonal average curve for this Parker Hannifin window slopes steadily in favor of the short side rather than whipping back and forth. The typical path shows weakness building through the middle of the window, with little evidence of a late-window squeeze that would routinely trap shorts. That kind of smooth seasonal drift is rare in a single-stock pattern and helps explain the relatively strong Sharpe ratio of 1.27 for this setup.
To understand how much the stock has tended to move inside the window, it helps to look at both peak run-ups and worst drawdowns year by year.
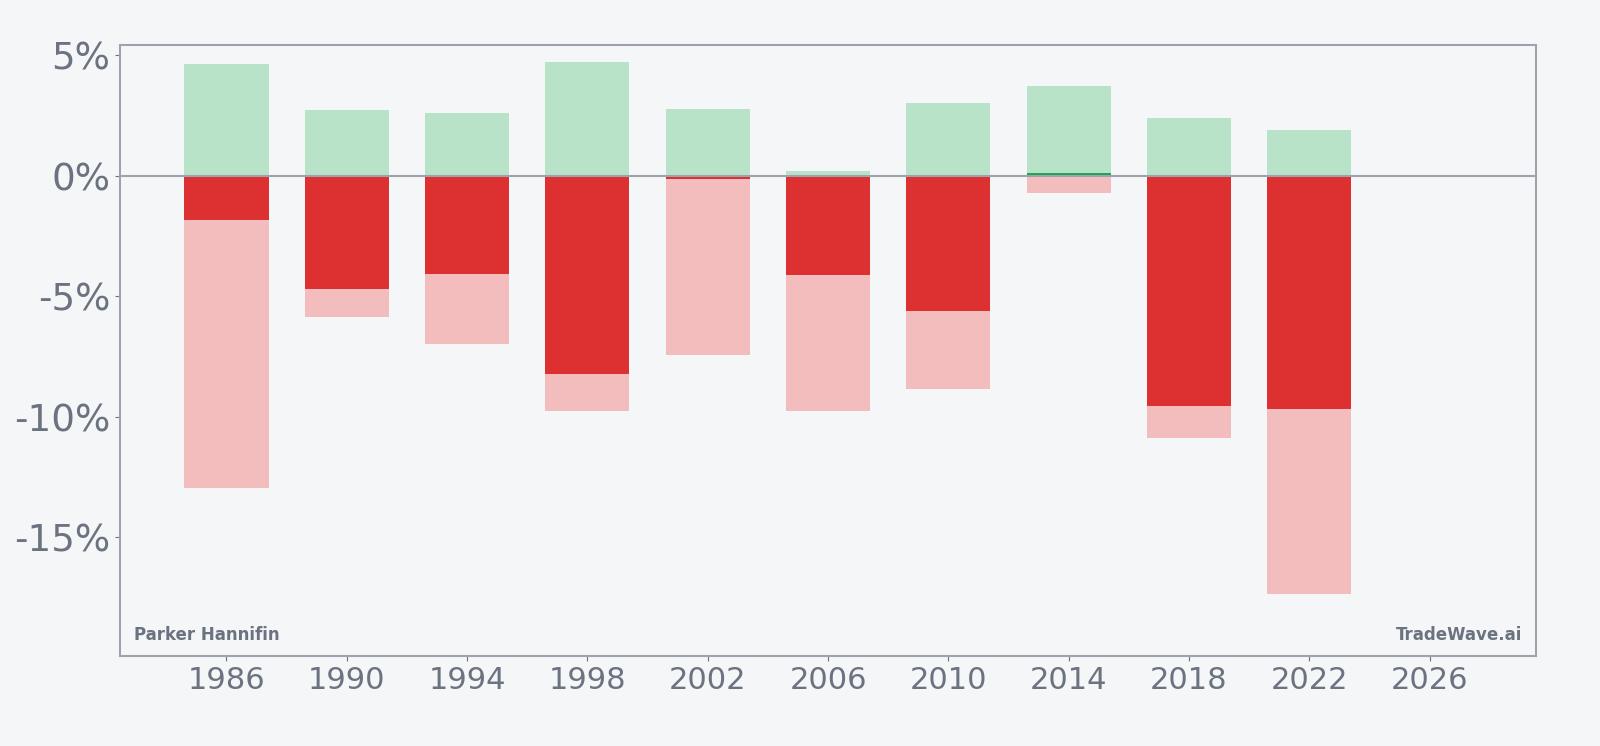
The stacked net, maximum favorable excursion and maximum adverse excursion bars show that when this PH seasonal pattern works, it often works with conviction. In 2022, for example, the best intraperiod move in the trade direction reached -17.35% from entry, while the worst countertrend move was limited relative to that downside travel. At the same time, several years feature adverse excursions in the high single digits, which means shorts have historically had to sit through meaningful rallies even in windows that ultimately finished profitable.
History does not guarantee future results; adverse excursions can be large even in winning windows, so traders using this pattern still face meaningful drawdown risk.
Why does Parker Hannifin (PH) follow this seasonal pattern?
This midterm-year June pattern for Parker Hannifin may reflect a mix of sector rotation and policy-driven risk-off behavior in industrials. One likely driver is that midyear in midterm election cycles often coincides with budget wrangling and uncertainty around infrastructure and defense spending, which can weigh on an industrial supplier’s order expectations. The window also sits between earnings seasons, when guidance updates are scarce and portfolio managers have more freedom to trim cyclical exposure without headline risk.
What is driving Parker Hannifin (PH) today?
Parker Hannifin shares closed at 825.33 on Jun 1, down 2.3% on the day, and they are about 6.6% below the 50-day moving average near 908.13 after a one-month slide of 6.26%. That pullback comes after a powerful run that carried the stock to a 52-week high around 1,030.30, leaving it still well above its 52-week low near 635.38 and keeping the broader uptrend intact despite the latest wobble.
The chart below situates the latest move in its recent multi-month context and overlays a 60-day seasonal projection for this midterm-year phase.
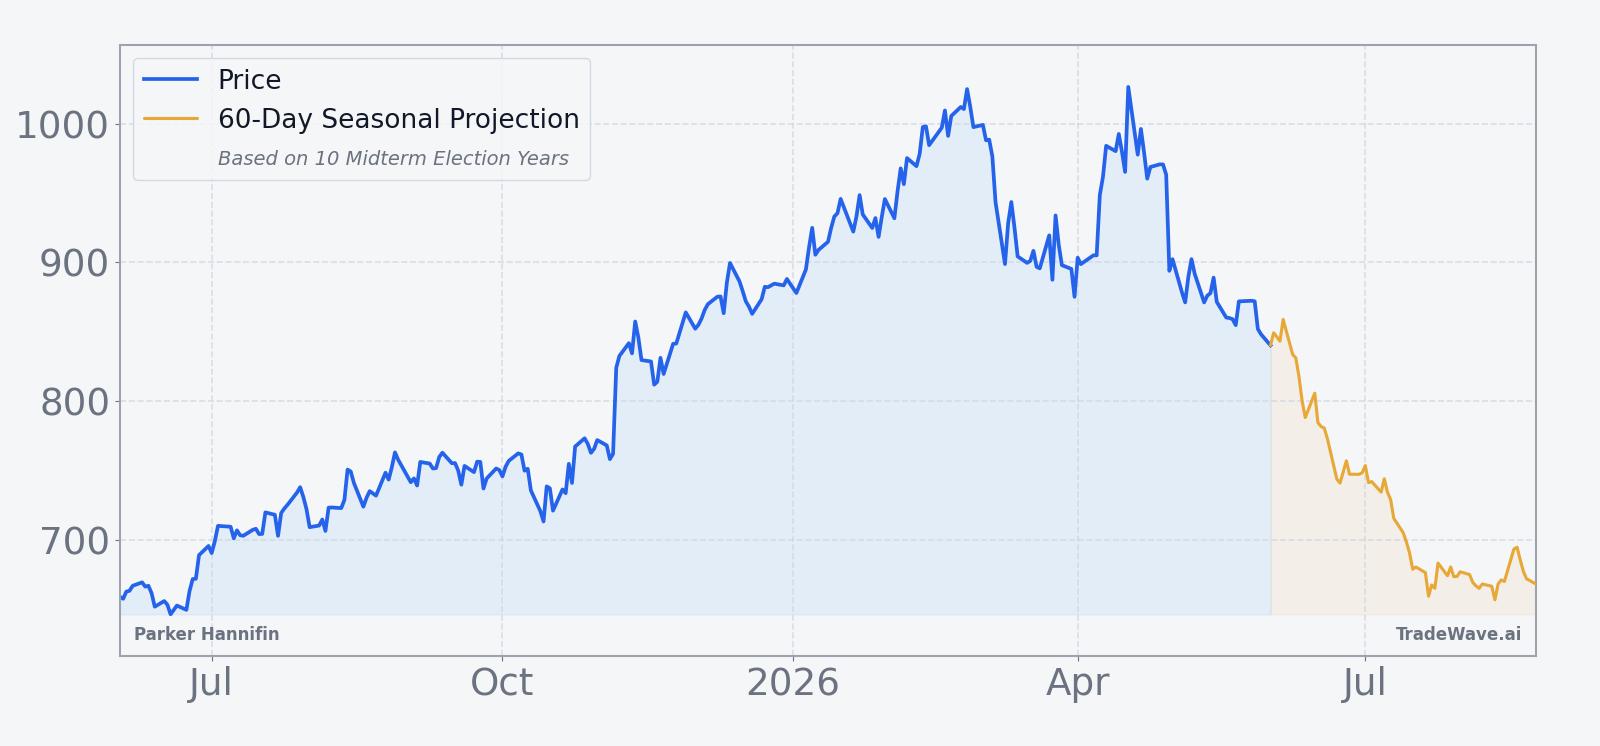
For a stock that has been a quiet leader in the industrial sector, the timing of this cooling phase is notable. PH remains in a long-term bullish trend, but it is entering a calendar stretch that has repeatedly favored the short side in midterm election years. For traders who watch historical seasonality alongside fundamentals, that clash between a strong multi-year uptrend and a short-friendly Parker Hannifin seasonal trend is what makes this particular June window stand out.
What should traders watch in this Parker Hannifin seasonal window?
Into late June, the first thing to watch is how PH behaves around the 50-day moving average and the recent swing low near 815. A decisive break below that band early in the window would be consistent with the historical pattern of weakness building in the middle of the 24-day stretch. Conversely, a fast reclaim of the 900 area with limited intraperiod downside would be an early sign that this midterm-year sample might diverge from the usual PH seasonal trend.
Macro and policy headlines also matter in this election cycle context. Any fresh noise around fiscal spending, industrial policy or rate expectations could amplify volatility in this Parker Hannifin trading window, especially if it hits just as the historical pattern tends to lean lower. Traders who lean on this kind of stock pattern analysis will be watching whether intraday swings start to resemble prior years, where maximum favorable moves for shorts often expanded quickly once selling pressure took hold.
Finally, monitor how realized volatility evolves relative to the historical maximum adverse excursions. If rallies inside the window stay shallow compared with past MAE readings, it would suggest that the downside bias is asserting itself again. If instead PH repeatedly squeezes higher with deep countertrend spikes, that would signal a break from the usual June seasonal pattern and could force short-term traders to rethink how much weight to give this midterm-year window in their playbook.
Sources
About this seasonal analysis
Seasonal pattern data is sourced from TradeWave.ai, which analyzes historical price behavior across annual calendar windows going back up to 30 years. Read the full data methodology or the book The 100-Year Pattern by Afshin Moshrefi (2026 edition). Past performance of seasonal patterns does not guarantee future results. This article is for informational purposes only and does not constitute investment advice.