HP Inc. (HPQ) Has Dropped in 9 of 10 Midterm June Windows, Averaging 4% Short-Side Profits
HP Inc. is heading toward a historically weak 13-day June trading window just as the stock surges to a fresh 52-week high after an earnings-fueled rally.
What is the seasonal pattern for HP Inc. (HPQ)?
HP Inc. has fallen in 9 of the last 10 midterm-year June windows for this 13-day setup, with average winning-year gains of 4.83% for the short side.
- 9 for 10 in this window, with the short side averaging 4.83% gains in winning years.
- Percent Profitable is 90%, with 9 winners and 1 loser for the short trade direction.
- The all-years average outcome, including the lone losing year, is a 4% move in favor of the short side.
- The window runs for 13 trading days starting Jun 20, grouped across the last 10 midterm election years.
- Intraperiod swings have been meaningful, with several years showing deep adverse moves before finishing as profitable shorts.
- For traders, this HPQ seasonal trend flags a tight early-summer stretch where downside has historically dominated despite occasional sharp rallies.
According to historical data from TradeWave.ai, this upcoming midterm-year June stretch for HP Inc. has behaved very differently from an average month on the calendar. The next section walks through how that pattern has played out in prior cycles and what it means for the weeks ahead.
How has HP Inc. (HPQ) traded in this midterm-year June window?
HP Inc. has fallen in 9 of the last 10 midterm election years during this 13-day June window, with the short side posting an average 4.83% gain in winning years. The next iteration begins on Jun 20, with HPQ trading at 29.38, up 8.6% on the day and sitting about 0.6% below its 52-week high of 29.54.[1]
Because this pattern is grouped by the presidential election cycle, it only looks at the last 10 midterm election years rather than consecutive calendar years. That matters in 2026, which is itself a midterm election year, since policy uncertainty, rate expectations and fiscal debates often cluster in this phase and can shape how hardware and PC stocks trade around the summer.
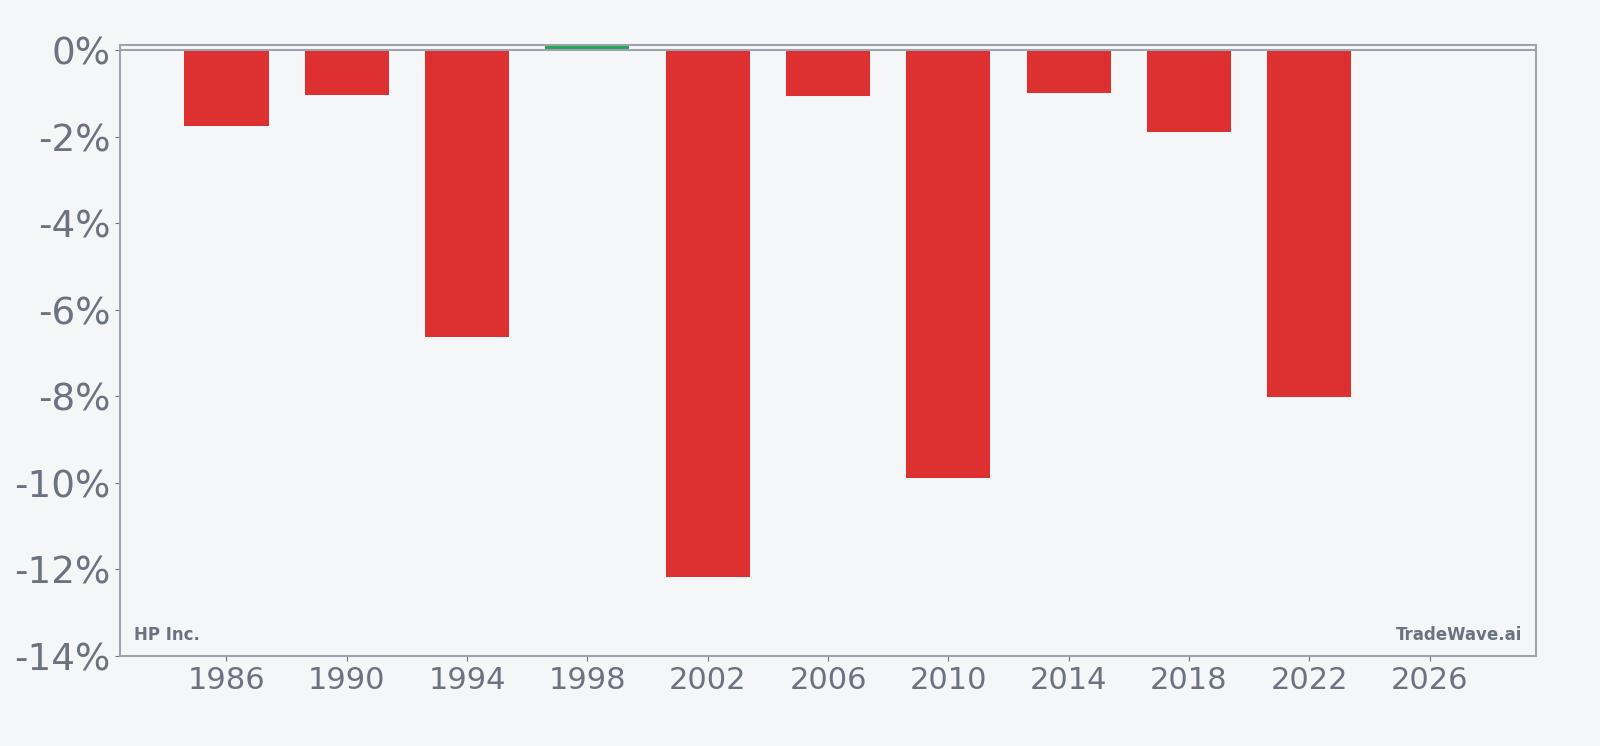
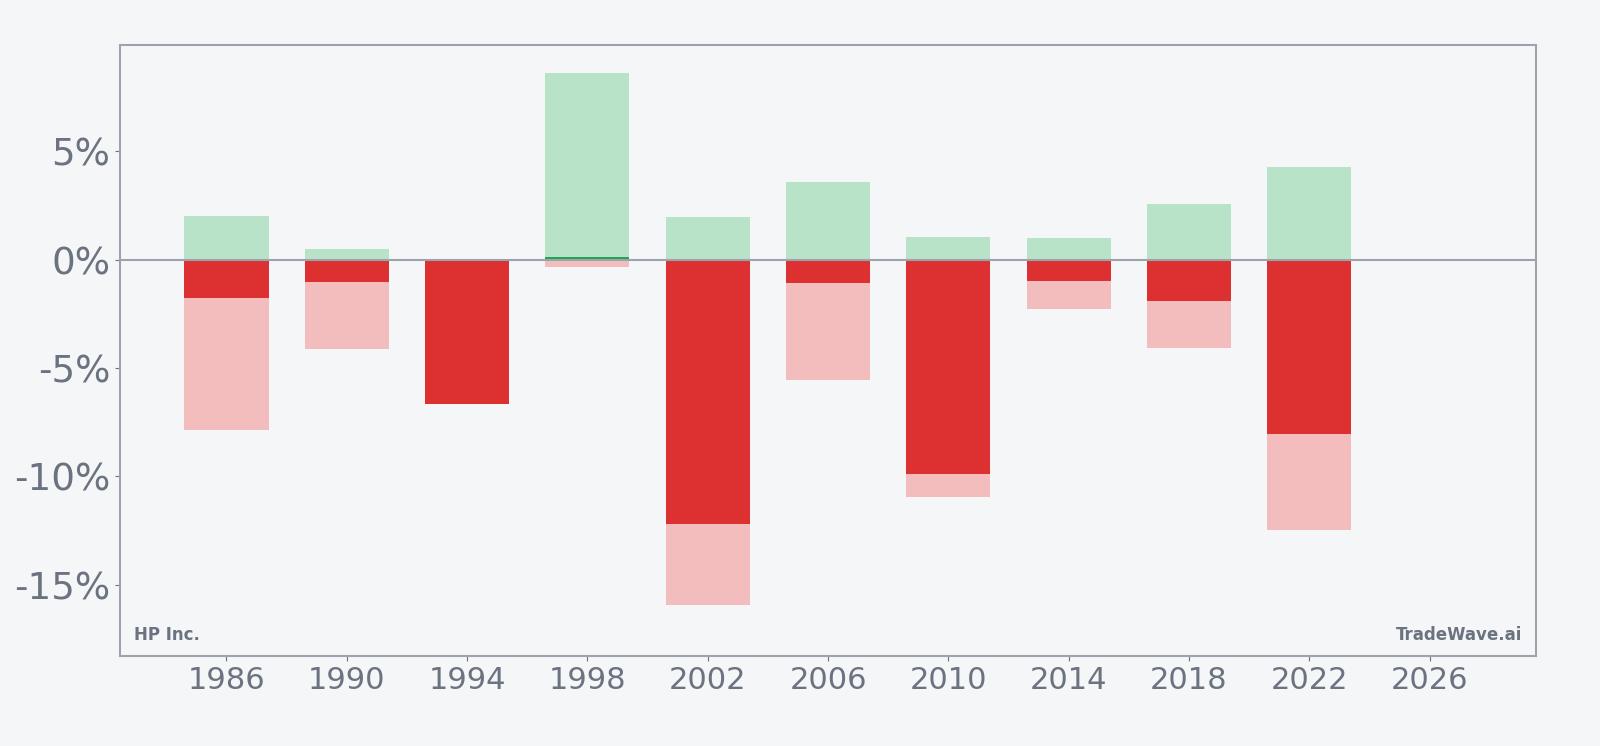
A second view layers in the typical best and worst intraperiod swings alongside the net result.
Historically this has been a short-biased setup. Percent Profitable sits at 90%, with 9 winning short years and just 1 losing year, and the all-years average move is a 4% gain for the short side. The strongest short year in the sample was 2002, when HPQ dropped 12.19% over the window, while 1998 stands out as the lone losing year for shorts with a small 0.11% net gain for longs.
The average winning-year profit of 4.83% for shorts comes with meaningful volatility inside the window. Maximum favorable excursions, the best point-to-peak moves in the trade direction, have reached as high as 8.63% in 1998 and 4.26% in 2022, showing that when the pattern works it can move quickly. Maximum adverse excursions, the worst drawdowns from entry, have also been sizable, with years like 2002 and 2010 seeing intraperiod rallies of 10% or more against the short before prices rolled back over.
The historical seasonal trend line suggests that weakness often builds gradually rather than in a single air pocket. In several midterm years HPQ has chopped sideways or even ticked higher in the first few days of the window before sliding lower into the back half, which fits with the elevated MAE readings in otherwise profitable short years. The cumulative return profile across all 10 cycles climbs steadily in favor of the short side, reinforcing that the bias has been persistent rather than driven by one or two outlier episodes.
Add it up: this is a short-directed window with a 9-for-10 record and a history of meaningful intraperiod swings that can punish mistimed entries even when the final outcome favors the bears.
Why does HP Inc. (HPQ) follow this seasonal pattern?
One likely driver is the way HP’s fiscal calendar and the broader PC upgrade cycle intersect with midyear positioning in midterm election years. Analysts have pointed to Windows 11 refresh demand and AI PC adoption as key themes for HP, which can front-load optimism into the spring and leave June as a period where investors trim exposure or fade rallies ahead of the next earnings update.[1] This pattern may also reflect institutional portfolio rebalancing and sector rotation as funds adjust hardware weightings around midyear while macro and policy headlines intensify in the midterm cycle.
History does not guarantee future results; adverse excursions can be large even in winning windows, so traders using this pattern should size and manage risk accordingly.
What is driving HP Inc. (HPQ) today?
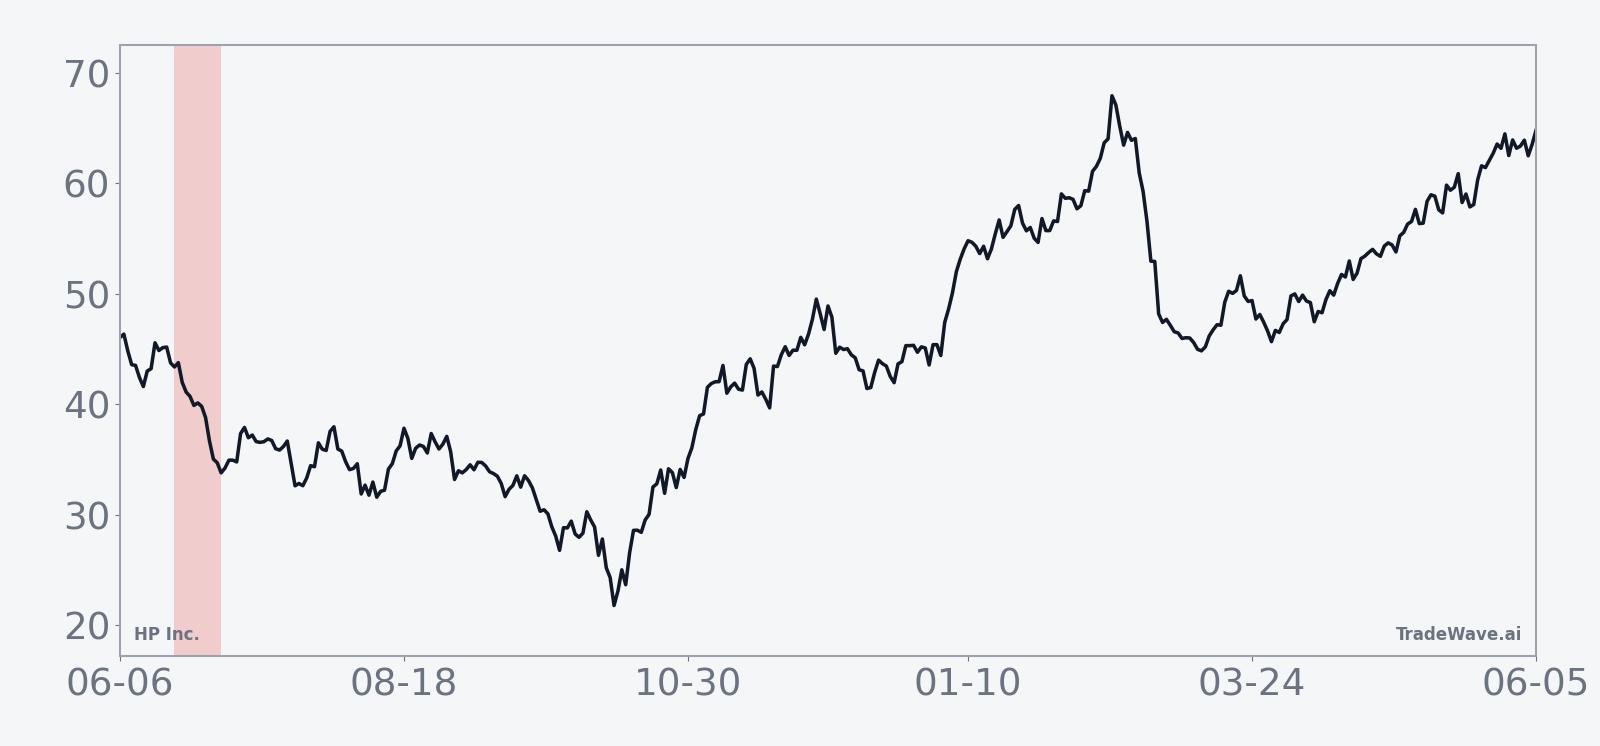
HPQ jumped 8.6% to 29.38 on Monday, trading in a wide intraday band between 27.31 and a new 52-week high of 29.54, with volume of 33.4 million shares versus a 20-day average of about 23.7 million.[1] The move extends a powerful one-month run of 40.85% and leaves the stock only about 0.6% below that fresh high, putting the upcoming seasonal window in sharp contrast with a strong current uptrend.[1]
Part of the backdrop is a string of upbeat headlines around HP’s core PC and printing franchise. In Aug 2025, HP reported third-quarter revenue of $13.93 billion, topping LSEG estimates and highlighting 6% growth in Personal Systems revenue on the back of AI PC adoption and the Windows 11 upgrade cycle, even as Printing revenue slipped 4%.[1] On May 27, 2026, a CNBC video report detailed how HP shares surged by double digits after the company beat both earnings and revenue expectations, underscoring investor enthusiasm for the turnaround in PC demand and cost discipline.[3]
Speculation has also swirled around potential strategic moves. On Apr 13, 2026, Bloomberg reported that shares of HP Inc. and Dell jumped on acquisition speculation tied to the PC and AI space, fueling talk that large hardware players could use deals to bulk up in higher-margin or AI-adjacent segments.[13] That kind of M&A chatter, layered on top of a cyclical PC refresh and AI hardware demand, has helped pull HPQ sharply higher into early June.
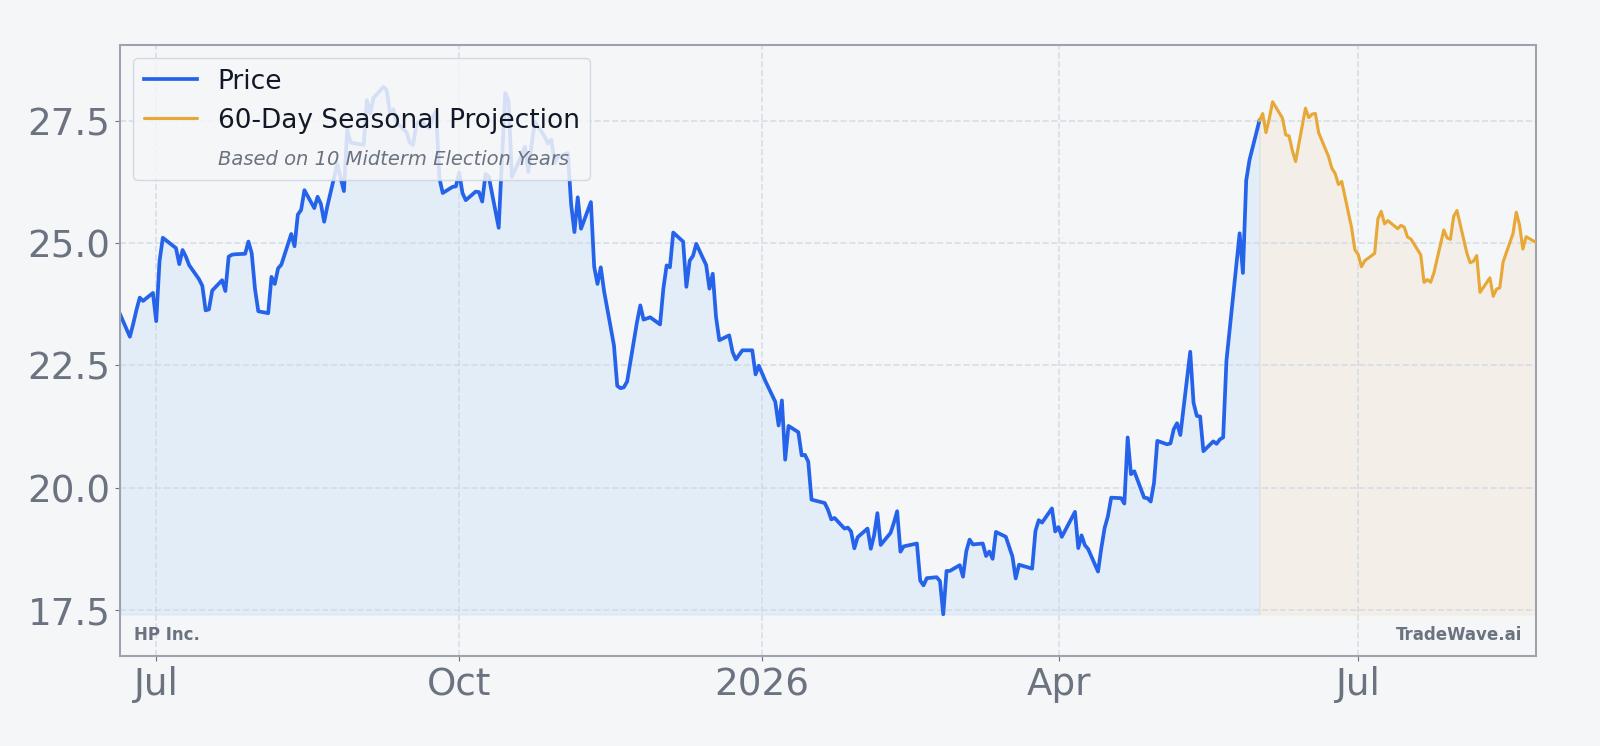
The chart below situates the latest surge against HPQ’s past year of trading and a 60-day seasonal projection.
How does the election cycle and macro backdrop shape this HPQ window?
2026 is a midterm election year in the United States, a phase that often brings a mix of policy uncertainty and shifting expectations for fiscal and regulatory priorities. For a hardware and PC name like HP Inc., that backdrop intersects with company-specific drivers such as AI PC demand and the Windows 11 end-of-support timeline, which have been cited as key supports for ongoing PC refresh cycles.[1] The seasonal pattern for HPQ in this June window is built specifically from the last 10 midterm election years, so it captures how investors have historically repositioned around these macro and policy crosscurrents.
Sector-wise, the PC and enterprise hardware complex has been trading as a leveraged play on AI infrastructure and corporate tech budgets. Stronger-than-expected revenue results and positive market reactions across the group have reinforced the idea that AI-enabled PCs and related hardware are in a multi-quarter upgrade cycle rather than a one-off spike.[3] That makes the upcoming historically weak HPQ seasonal window notable: it arrives at a time when the fundamental narrative is bullish and the stock is extended, which in prior midterm years has often been the setup for short-term mean reversion rather than a trend change.
What should traders watch as this HPQ seasonal window approaches?
First, the calendar. The 13-day window starting Jun 20 is short, so price action in the days immediately before and after the start date will matter more than distant macro headlines. If HPQ continues to hug or break above its 52-week high into the window, any failure to hold those levels could be an early tell that the historical midterm-year pattern is reasserting itself.
Second, watch volume and reaction to any incremental news on AI PCs, Windows 11 migration or potential strategic deals. In prior cycles, this window has seen sharp intraperiod rallies against the short side before rolling over, so a spike in volume on strength that quickly fades would be consistent with the historical pattern of adverse excursions followed by profitable short outcomes. Conversely, a clean breakout that holds above the recent range through the full 13-day stretch would mark a clear departure from the last 10 midterm years.
Third, keep an eye on the broader PC and hardware sector. If peers that have also benefited from AI and PC refresh themes start to stall or give back gains into late June, that would add weight to the idea that investors are using this part of the midterm year to rebalance exposure. If instead the group powers higher on strong demand data or new product cycles, HPQ could find more support than its own historical seasonality would suggest.
Finally, traders should monitor how HPQ behaves relative to the intraperiod swings seen in past windows. A move that quickly matches or exceeds the typical maximum favorable excursion for shorts, without a large countertrend rally, would signal that this cycle is tracking the more decisive downside years like 2002 or 2010. A choppy, sideways pattern with shallow pullbacks would argue that the 9-for-10 record is facing a tougher test this time around.
Sources
About this seasonal analysis
Seasonal pattern data is sourced from TradeWave.ai, which analyzes historical price behavior across annual calendar windows going back up to 30 years. Read the full data methodology or the book The 100-Year Pattern by Afshin Moshrefi (2026 edition). Past performance of seasonal patterns does not guarantee future results. This article is for informational purposes only and does not constitute investment advice.