Nvidia (NVDA) Has Dropped in 6 of 6 Midterm June Windows, Shorts Averaged 12.95%
Nvidia is trading below its recent peak as it heads toward a 22-day midterm-year window that has historically favored downside moves in the stock.

What is the seasonal pattern for Nvidia (NVDA)?
Nvidia has fallen in 6 of 6 midterm-election-year windows starting around Jun 2, with an average 12.95% gain for short positions in winning years.
- 6 for 6 in this window for shorts, with an average 12.95% profit in winning years across the last six midterm election cycles.
- Seasonal window runs 22 trading days from Jun 2, targeting the mid part of the midterm election year.
- Percent Profitable is 100%, with 6 winners and 0 losers for the short-side pattern in this Nvidia trading window.
- Average winner profit of 12.95% comes alongside a TradeWave Ratio of 1.64, indicating meaningful travel in the trade direction within the window.
- The Sharpe ratio of 1.45 reflects strong risk-adjusted returns for the pattern, even with intraperiod drawdowns.
- Maximum adverse excursions in some years have exceeded 20%, so shorts have historically faced sharp squeezes before the pattern paid off.
According to historical data from TradeWave.ai, this midterm-year stretch has behaved very differently from an average month for Nvidia, with a clear short-side bias emerging across past cycles.
How has Nvidia (NVDA) traded in this midterm-year June window?
Nvidia has fallen in all six midterm-election-year windows that begin around Jun 2 and last 22 trading days, delivering a cumulative 104% gain for short positions across those cycles. Shares last closed at 220.22, leaving the stock about 6.9% below its 52-week high of 236.54 and up roughly 19% year to date.[6]
Grouping by the presidential election cycle matters here because Nvidia’s heaviest AI spending cycles have increasingly lined up with policy and fiscal shifts around midterm years, when Washington often debates budgets, industrial policy and regulation that affect hyperscaler capex. In this midterm-election-year slice, the pattern phase labeled “pe2-6” captures the last six midterm years, isolating how Nvidia has behaved in this specific political and liquidity backdrop rather than averaging across calmer pre-election or post-election years.
Across those six midterm years, the short-side pattern shows an average profit of 12.95%, with a median profit of 12.25% and no losing years. For a short setup, that means Nvidia has tended to drift or break lower during this 22-day stretch, even when the broader AI trade was strong. The annualized return of 12.67% and Sharpe ratio of 1.45 point to a historically consistent edge for traders positioned with the trend of this window rather than against it.
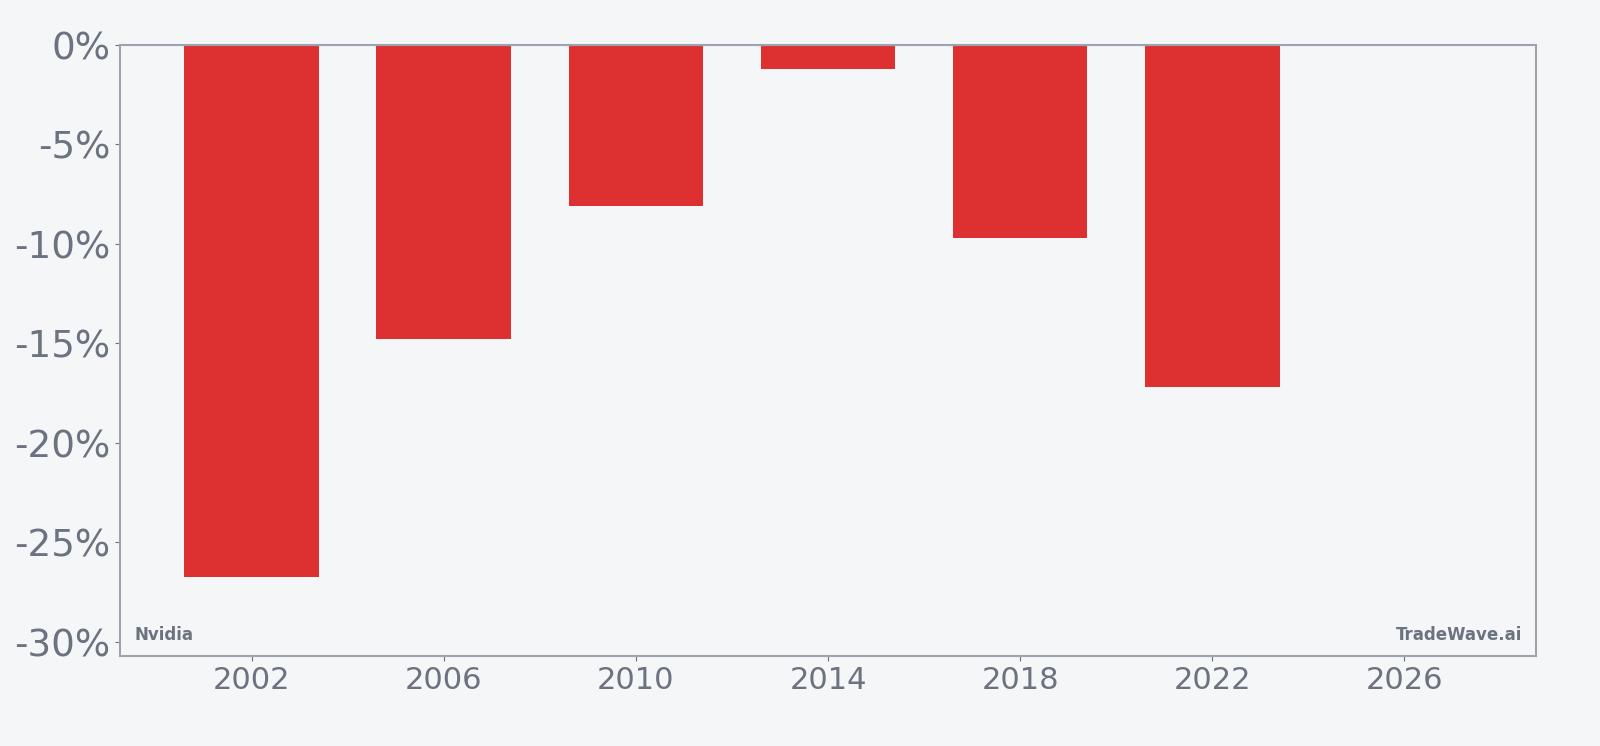
The per-year table shows how that has played out in practice. In 2002, short positions in this window captured a net return of 26.72%, with the stock’s best intraperiod rally topping out at 6.85% before a maximum adverse move of 32.06% in favor of the short. In 2022, a more recent midterm year, the pattern still worked for shorts with a 17.17% net gain, but the worst drawdown from entry reached 21.75%, underscoring how volatile this Nvidia trading window can be even when the final outcome favors the downside.
The MFE/MAE profile across years shows a clear message. Maximum favorable excursions have often been in the mid-teens or higher for shorts, while maximum adverse excursions have also been double-digit in several cycles. That combination means this midterm-year June seasonal pattern has historically been a high-variance stretch where Nvidia can squeeze sharply higher before rolling over, or sell off quickly with only modest countertrend rallies.
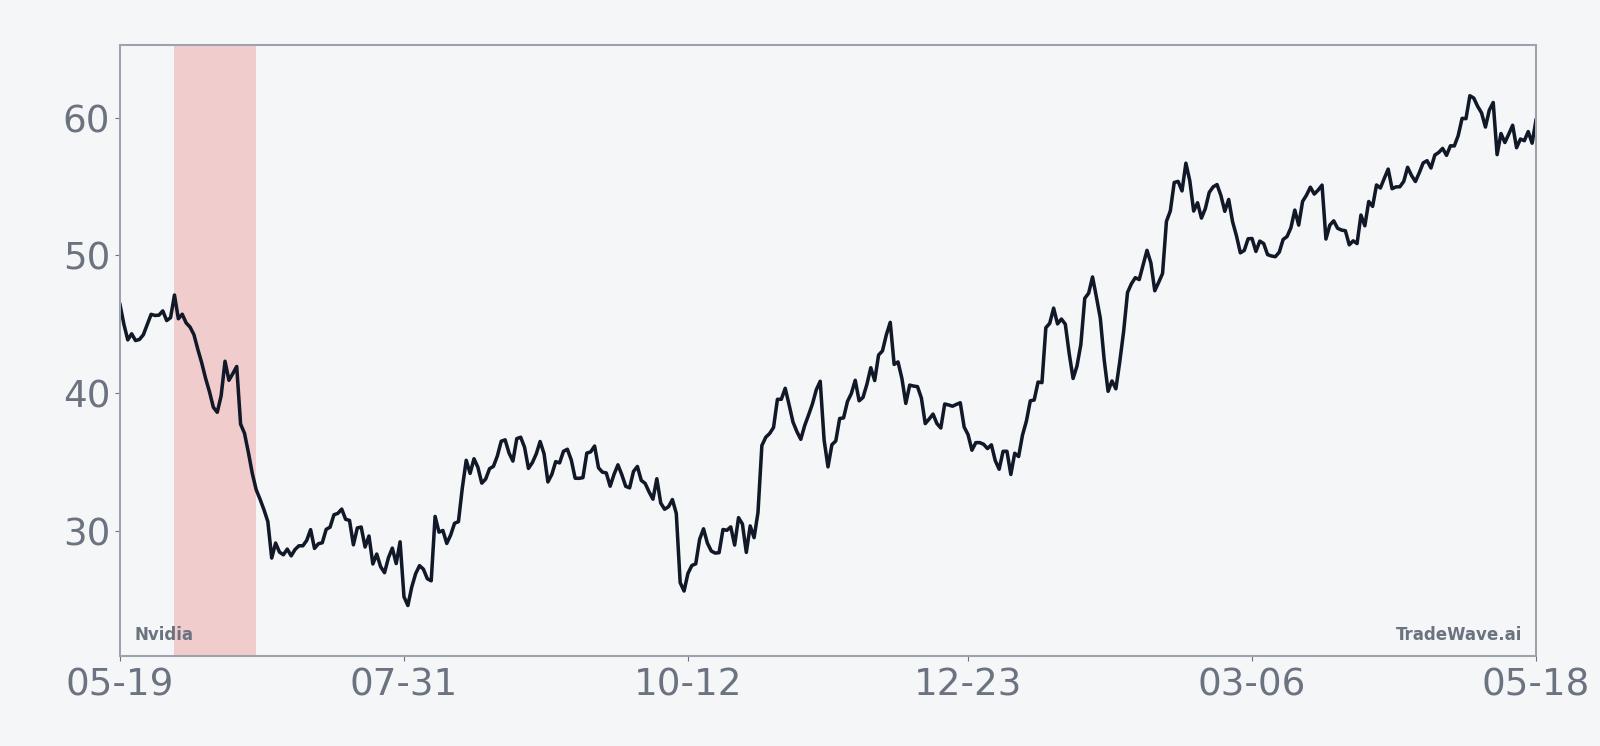
The historical seasonal average sets the backdrop; the next chart shows how far Nvidia has swung inside the window.
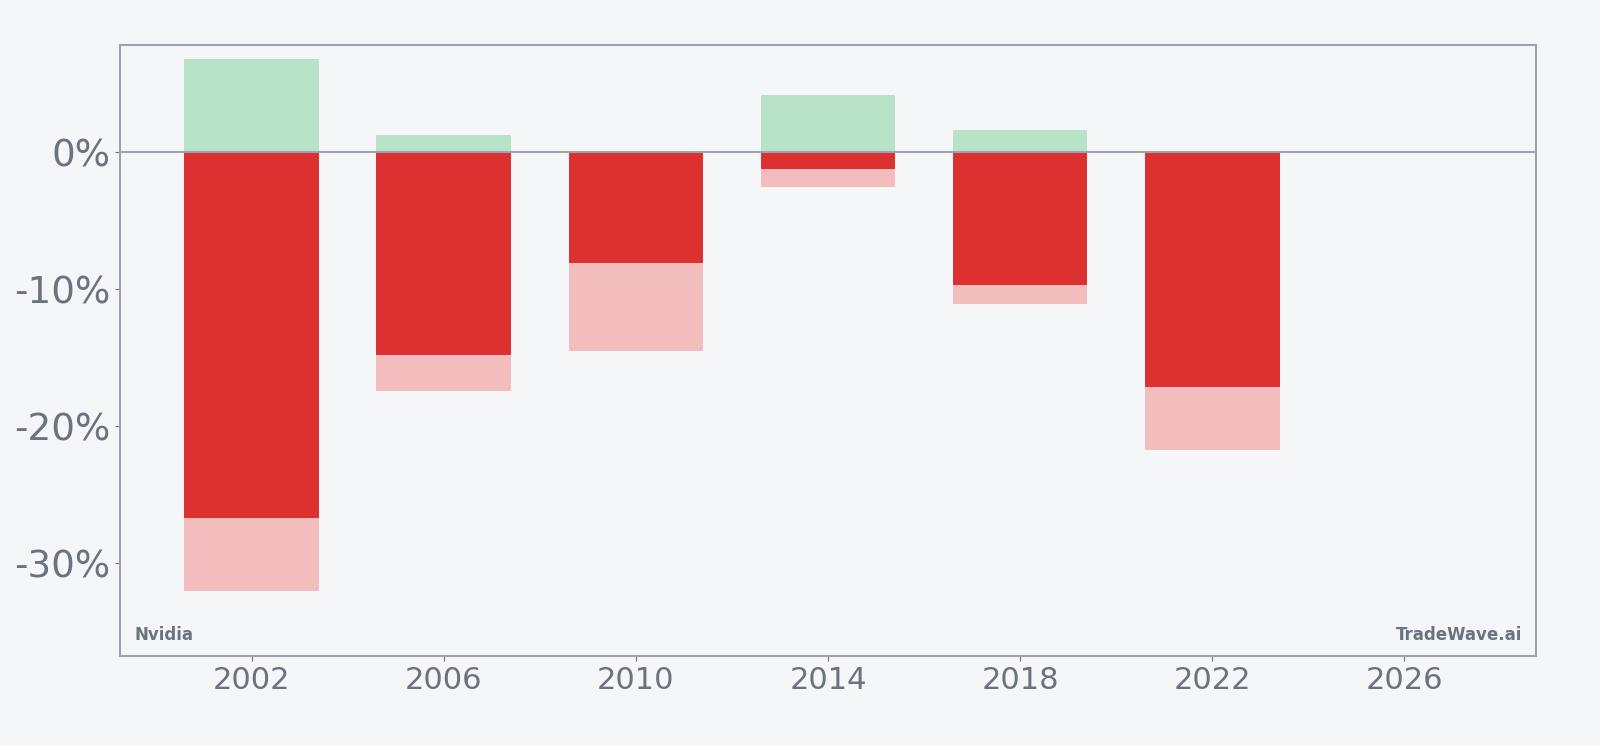
Viewed together, the net-return and excursion bars show a pattern that has consistently rewarded shorts but demanded strong risk management. Years like 2014 delivered only a modest 1.22% net gain for shorts, yet still saw a 4.18% intraperiod rally against the position, while heavier years such as 2002 and 2022 combined deep favorable moves with sizable squeezes along the way. Add it up: six for six winning years, double-digit average profits and large swings in both directions inside the window.
History does not guarantee future results, and even in this all-winner sample, maximum adverse excursions have been large enough to challenge poorly sized positions.
Why does Nvidia (NVDA) follow this seasonal pattern?
One likely driver is the way Nvidia’s earnings calendar and hyperscaler spending updates cluster around late spring in midterm election years, when investors are also digesting shifting policy signals on AI, data centers and fiscal spending. Analysts have pointed to midyear portfolio rebalancing and sector rotation as large funds trim or reweight high-beta AI leaders after strong runs, which can amplify downside pressure in a narrow window. This pattern may also reflect options expiration dynamics, as traders hedge or unwind short-dated AI exposure around key macro and policy events that tend to fall in this part of the midterm year.
What is driving Nvidia (NVDA) today?
Nvidia closed at 220.22 on Thursday, down 1.46% on the day and roughly 6.9% below its 52-week high of 236.54, while still up about 19% year to date.[6] The stock is digesting fiscal first-quarter results released on May 20, where investors focused on how fast hyperscaler capex can keep growing to support the Blackwell AI chip ramp and whether the latest guidance justifies the stock’s premium valuation.[6] Short-dated calls have been trading at a notable premium to puts, with heavy upside call activity ahead of earnings that signaled aggressive positioning for further gains in the AI leader.[8]
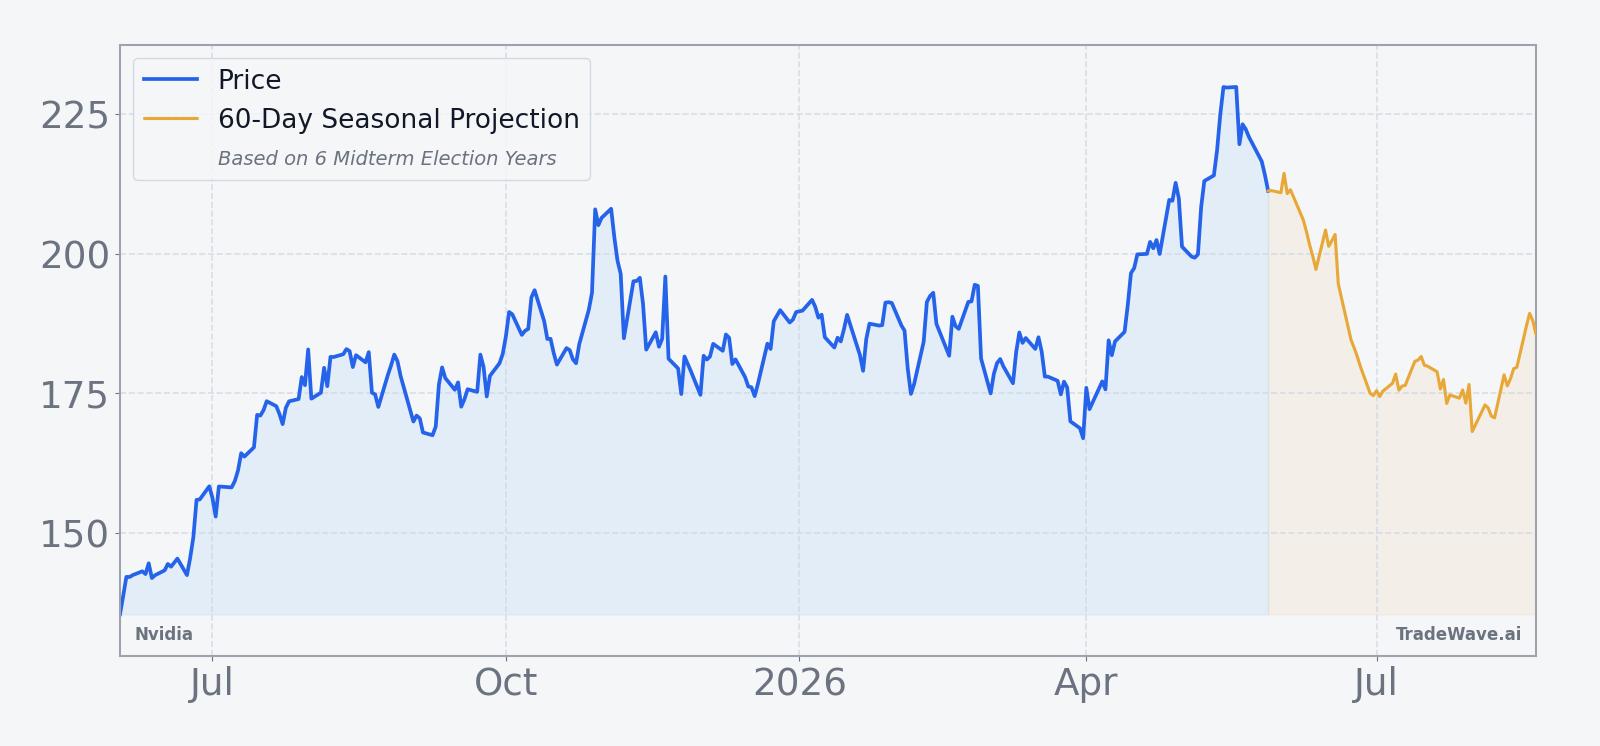
The chart below shows Nvidia’s past year of trading alongside a 60-day seasonal projection that incorporates this midterm-year June window.
Nvidia remains a central driver of the AI trade and a key weight in major equity indices, so any volatility around this seasonal window can ripple through broader tech benchmarks. The company’s exposure to hyperscaler budgets, cloud AI build-outs and data center demand means that even small shifts in guidance or macro tone can trigger outsized moves in the stock. Against that backdrop, the historical seasonality pointing to a short-favored June stretch stands out as a potential counterweight to the bullish narrative that has dominated much of 2026 so far.
What should traders watch as this Nvidia seasonal window approaches?
First, the calendar: the 22-day window begins on Jun 2, so price action in the final days of May will set the starting point for any seasonal move. Traders will be watching whether Nvidia retests the 52-week high near 236.54 or continues to consolidate below that level as the window opens.[6] A strong push to new highs would make any historically typical downside move more dramatic in percentage terms, while a deeper pullback ahead of Jun 2 could blunt the impact of the pattern.
Second, options flow bears close monitoring. The recent skew toward short-dated upside calls ahead of earnings signaled aggressive bullish positioning; if that call-heavy flow persists into early June, it could fuel squeezes against shorts even in a window that has historically favored them.[8] A shift toward more balanced or put-heavy activity, by contrast, would suggest traders are leaning into the seasonal downside risk rather than fighting it.
Third, watch the AI macro tape: updates from major cloud providers on capex plans, any fresh commentary on Blackwell deployment timelines, and broader tech-sector risk appetite will all shape how Nvidia trades inside this window.[6] If the stock sells off on good news or fails to rally on upbeat AI headlines, that would be one sign the historical midterm-year pattern is asserting itself again. If instead Nvidia shrugs off the seasonal tendency and grinds higher with limited drawdowns, it would mark the first real break in a six-for-six record that has held across two decades of midterm cycles.
Sources
About this seasonal analysis
Seasonal pattern data is sourced from TradeWave.ai, which analyzes historical price behavior across annual calendar windows going back up to 30 years. Read the full data methodology or the book The 100-Year Pattern by Afshin Moshrefi (2026 edition). Past performance of seasonal patterns does not guarantee future results. This article is for informational purposes only and does not constitute investment advice.