This 95-Day Midterm Window Has Punished Nvidia (NVDA) in 5 of 6 Cycles
Nvidia just dropped 3.3% as it moves into a 95-day midterm-year spring stretch that has historically leaned bearish for the stock, with shorts winning in most prior cycles.

Key takeaways
- Nvidia is entering a 95-day midterm-year spring window that has historically favored downside, with a short trade direction.
- Across the last 6 midterm election years, this window has been profitable for shorts 83% of the time, with 5 winners and 1 loser.
- Winning years have averaged a 29.85% gain for the short side, while including all years brings the average outcome to 25%.
- Intraperiod swings have been violent, with several years showing deep adverse moves before the short side ultimately paid off.
- Today’s 3.3% slide leaves Nvidia about 18.6% below its 52-week high, adding tension between a still-elevated price and a historically weak seasonal stretch.
- History suggests this window can move quickly in either direction, so traders need to respect both the downside bias and the potential for sharp squeezes.
According to historical data from TradeWave.ai, this specific midterm-year spring stretch has behaved very differently from an average quarter for Nvidia, and the next section breaks down how that pattern has played out across past cycles.
Seasonal window
Nvidia has delivered profitable short setups in 5 of the last 6 midterm-year spring windows starting around Mar 21, with average winning moves of 29.85% and an all-years average of 25% for the short side. Shares closed Friday at 172.70, down 3.3% on the day and about 18.6% below their 52-week high of 212.17, after trading between 171.72 and 178.26 on heavy volume of roughly 236 million shares. That combination of a still-elevated price, a fresh pullback and a historically bearish midterm window gives traders a very different backdrop than the AI-driven melt-up that has defined much of the past two years.
The presidential election cycle matters here because this pattern only looks at the last 6 midterm election years, a phase that has often featured tighter policy, regulatory noise and choppier risk appetite than the pre-election boom that usually follows. Nvidia is entering the midterm election year in calendar terms, and this 95-day stretch sits in the early part of that phase, when Washington tends to debate spending and regulation while the Federal Reserve weighs how restrictive it needs to be.
This seasonal window begins on Mar 21 and spans 95 trading days, and historically it has been a weak stretch for Nvidia when viewed through a short lens. Percent Profitable sits at 83%, with 5 winning short years and just 1 losing year, so the downside bias has been clear across the sample. Avg Profit of 29.85% reflects only the winning short years, while Avg Profit - All of 25% folds in the lone losing year and still leaves a sizable average gain for the short side. For a stock that has become a symbol of the AI boom, that is a strikingly bearish midterm-year pocket.
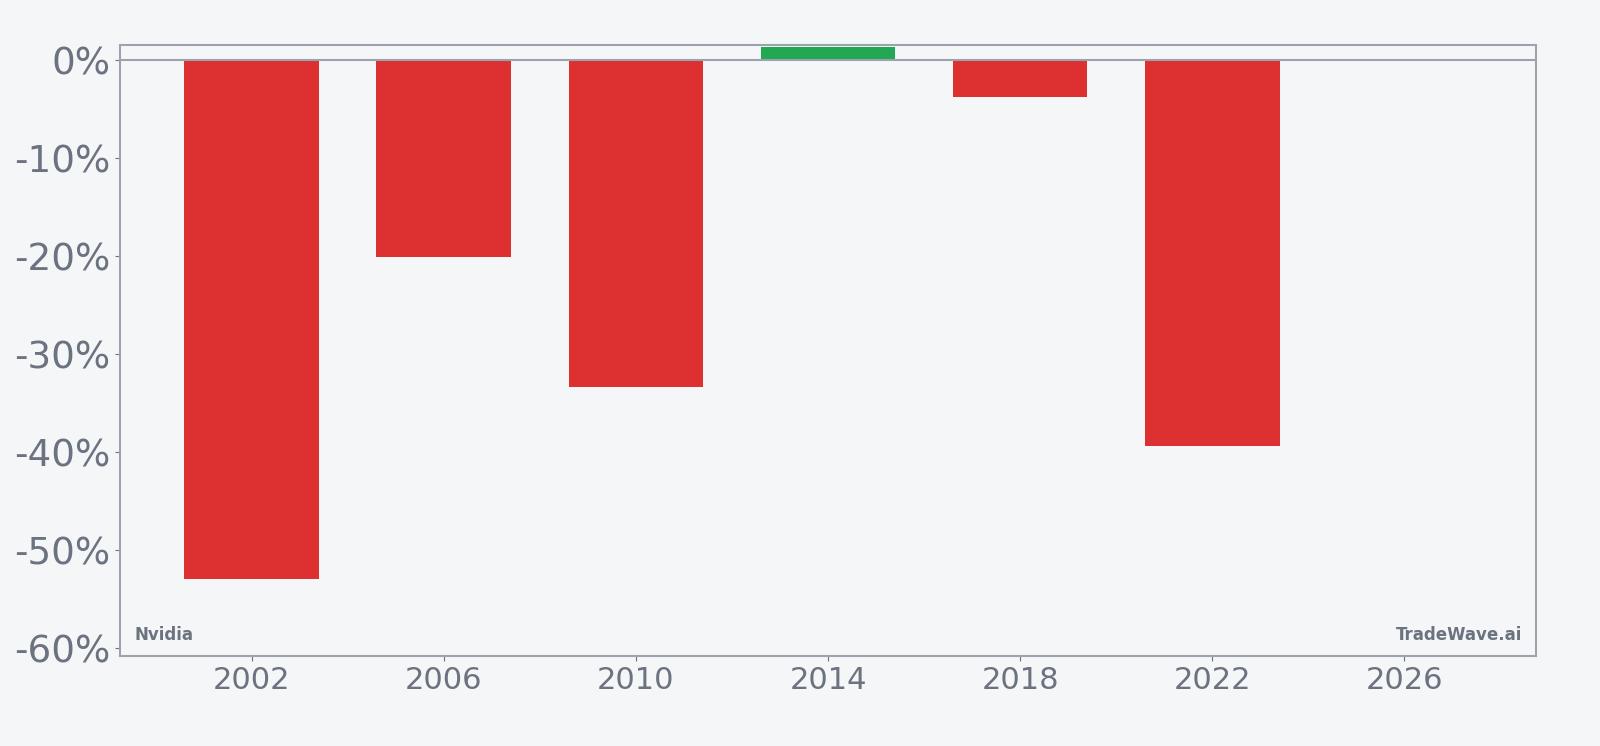
The per-year breakdown shows how that has played out in practice. In 2002, the short side posted a net return of -52.89%, meaning Nvidia fell sharply during the window and shorts benefited from a deep slide. The weakest outcome for shorts came in 2014, when the net return was 1.39% and the stock edged higher instead, turning that year into the single loser in the sample. Add it up: 248% cumulative return for the short side across these six midterm-year windows.
Intraperiod swings have been large. Maximum favorable excursions, which capture the best point-to-peak move in the trade direction, reached 25.54% in 2006 and 8.37% in 2018, showing that when the short side has worked, it has often done so with meaningful follow-through. Maximum adverse excursions, which track the worst drawdown from entry, have been even more eye-catching in some years, including a -56.31% adverse move in 2002 and -42.65% in 2022 before the short side ultimately finished ahead. That mix of big positive and big negative swings is exactly what the TradeWave Ratio of 1.53 is flagging: this window has historically seen Nvidia travel a long way in the trade direction, but not without serious squeezes along the path.
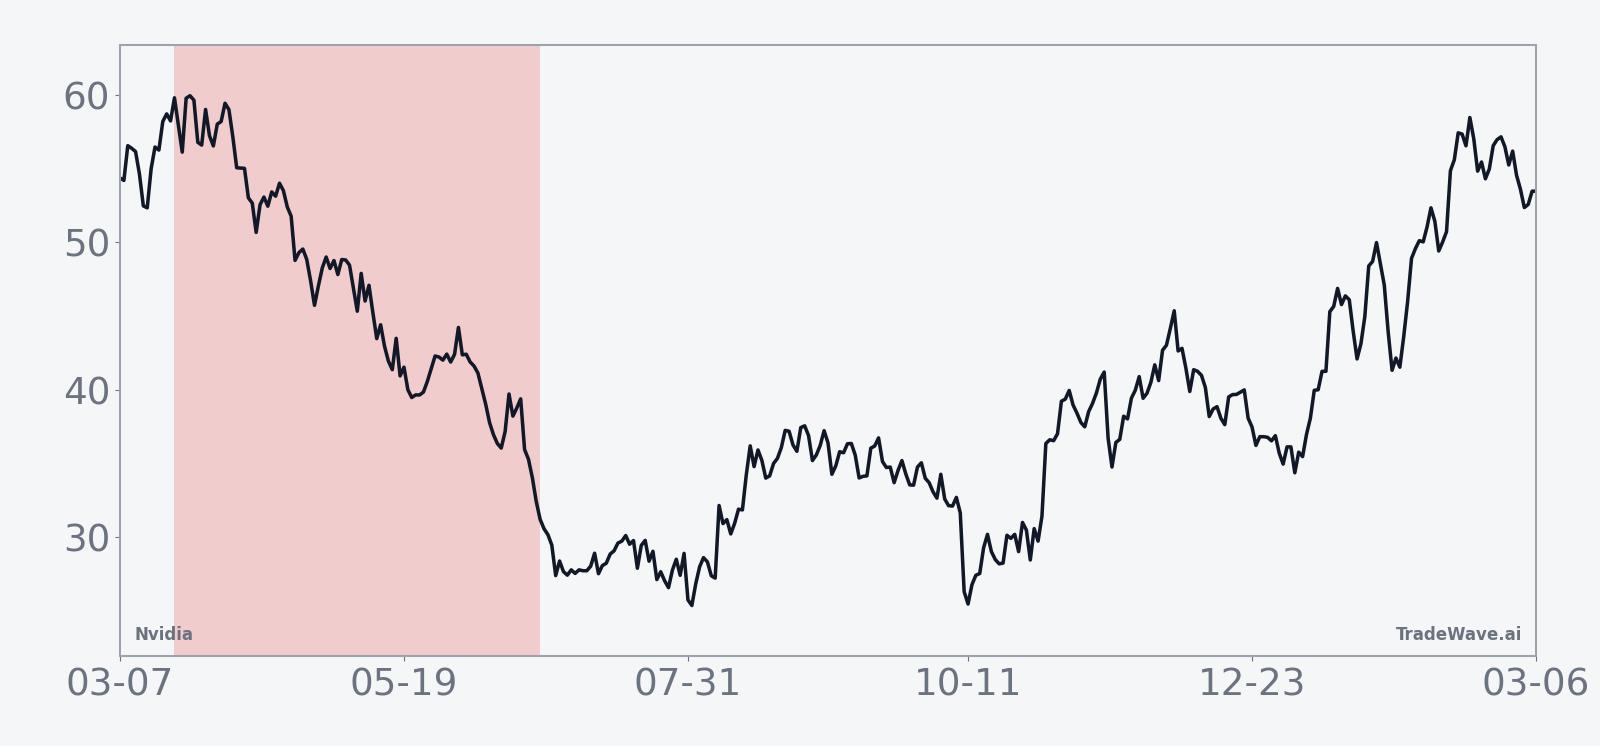
The historical seasonal trend line slopes lower for most of the window, with the bulk of the downside accruing after the early weeks rather than in a single crash. The typical pattern shows Nvidia chopping around entry levels at first, then sliding more decisively as the window progresses, which matches the deep net returns seen in 2002, 2010 and 2022. The cumulative return chart for the pattern reinforces that story, with losses for the stock stacking up across cycles rather than canceling out.
The bar chart that layers net results with best and worst intraperiod moves shows how often shorts have had to sit through squeezes before the pattern paid off.
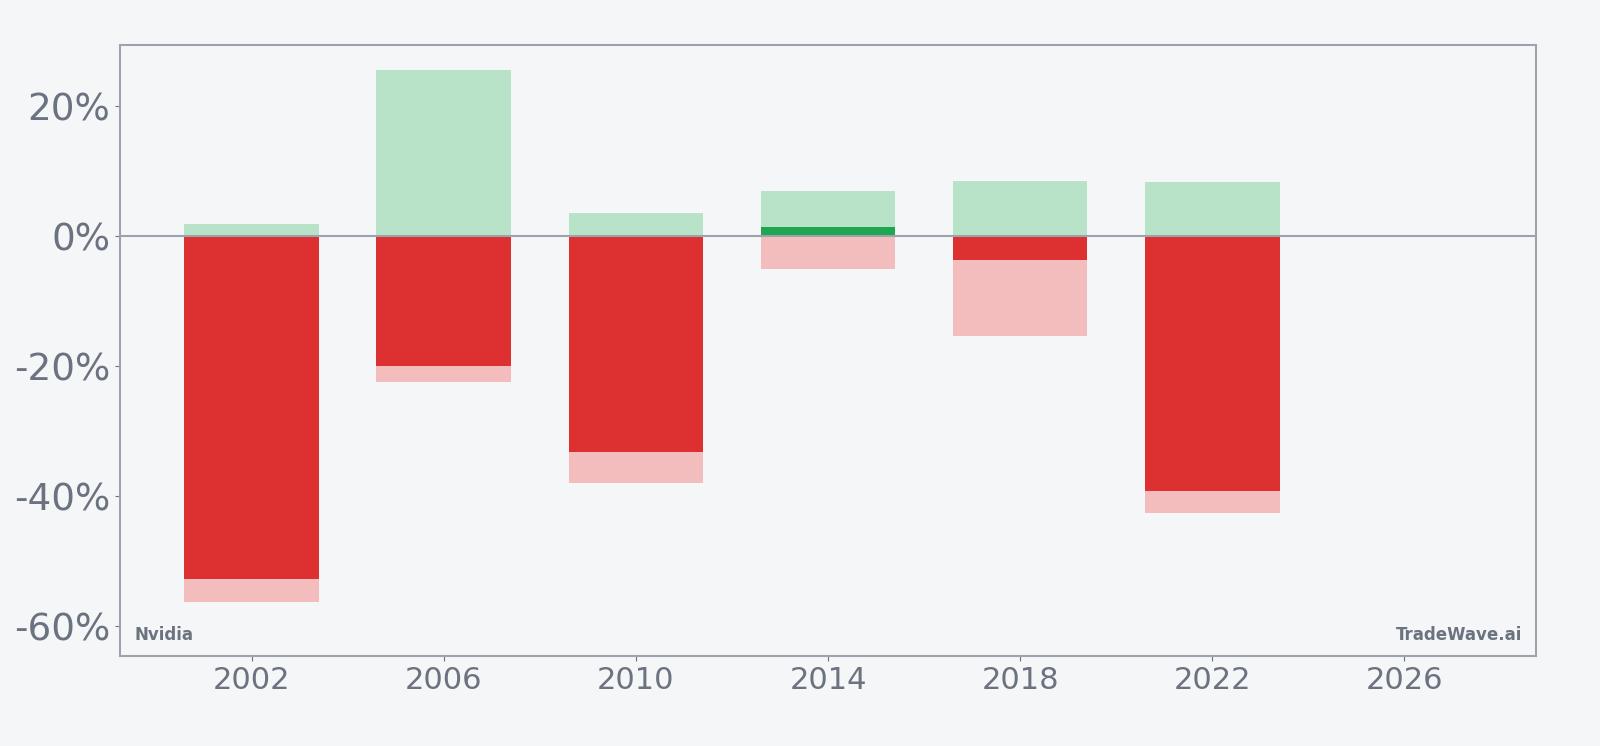
Across the six midterm-year samples, the bars show that even the strongest short years often included double-digit adverse excursions before finishing deep in the green for bears. That is the key takeaway: this has been a short-friendly window for Nvidia, but one that has demanded a strong stomach for volatility.
History does not guarantee future results; adverse excursions can be large even in winning windows, and past midterm-year patterns may not repeat.
Price and near-term drivers
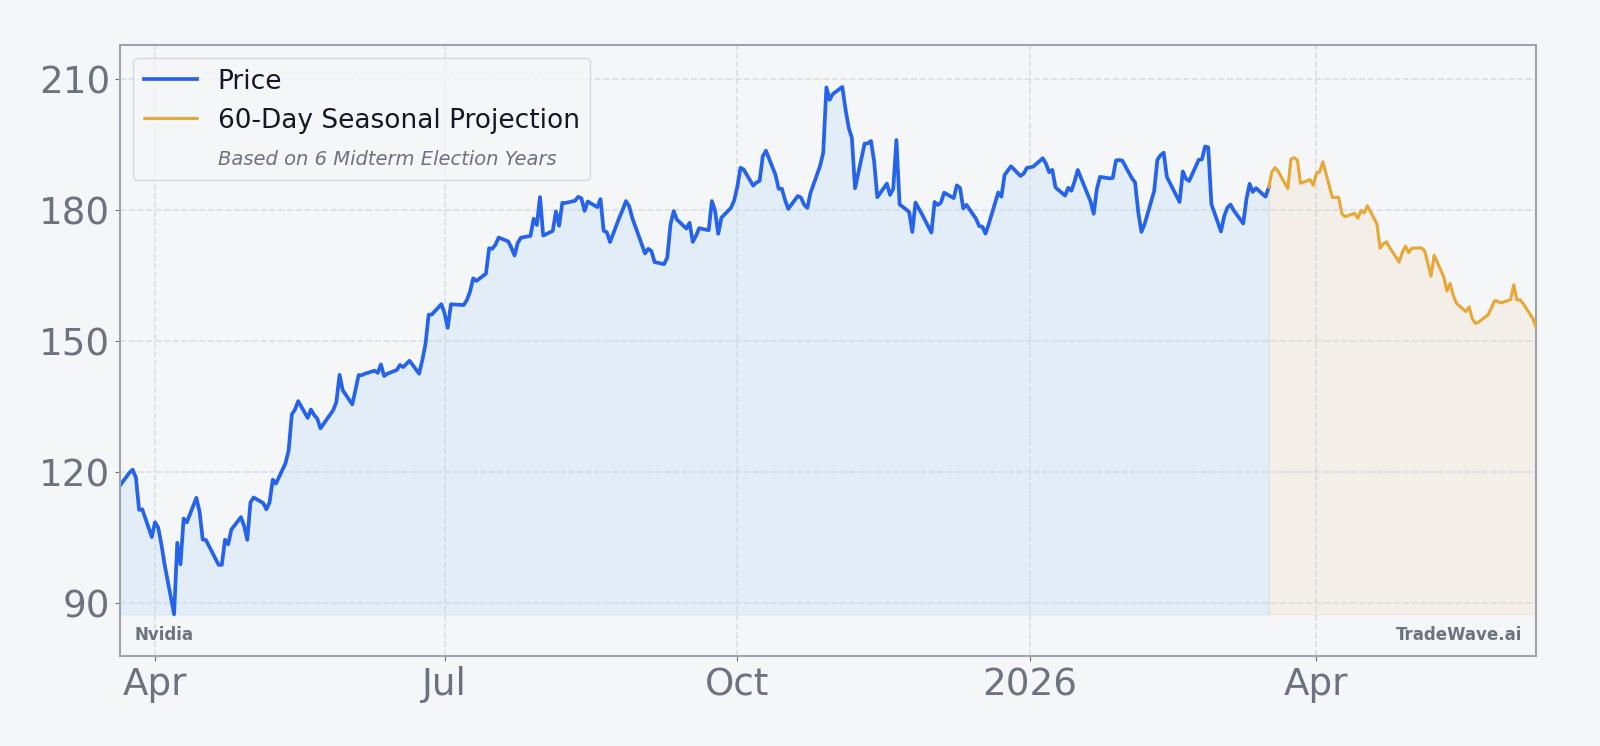
Nvidia closed at 172.70 after a 3.3% drop, trading roughly 18.6% below its 52-week high of 212.17 and modestly below its 50-day moving average of 185.26 on volume that ran well above its 20-day average of about 195 million shares. That pullback comes after a long stretch in which the stock has been a poster child for AI enthusiasm, with analysts projecting strong revenue growth tied to data center GPUs and new architectures such as Blackwell and Vera Rubin that are expected to drive 2026 demand.[1] In 2025, Nvidia’s stock saw both sharp rallies and double-digit drawdowns as investors weighed AI upside against concerns about competition and export controls, with one analysis describing a 10% decline in November 2025 even as the name remained up 35% for the year.[3]
The chart below situates the latest move in its recent multi-month context, alongside a 60-day seasonal projection for this midterm-year window.
Macro and policy remain central to how this window could trade. In 2025, analysts framed Nvidia’s outlook around the “AI revolution,” pointing to expanding GPU demand beyond hyperscalers and the possibility that any easing of China-related GPU restrictions could unlock additional earnings power in fiscal 2027.[1] At the same time, commentary highlighted how bouts of market volatility and worries about trade policy or competition could trigger sharp swings in the stock, even when the long-term AI story stayed intact.[3][9] That mix of powerful secular growth and policy-sensitive volatility is exactly the backdrop in which this midterm-year seasonal pattern has played out in prior cycles.
Election-cycle dynamics add another layer. The midterm election year often brings louder debates over spending, regulation and antitrust, all of which can matter for a company that dominates AI hardware and sits at the center of data center capex plans.[1][7] Historically, midterm years have shown a “two-playbook” structure for major growth names: a choppier, risk-heavy first half followed by a stronger pre-election phase as policy clarity improves. Nvidia’s 95-day spring window sits squarely in that earlier, more volatile part of the year, which lines up with the short-friendly seasonal record highlighted above.
For traders, the tension is clear. Nvidia remains a core AI winner in most fundamental narratives, yet the stock is entering a calendar stretch that has repeatedly punished long exposure in past midterm cycles. If AI demand and product launches keep surprising to the upside, the seasonal pattern could be overwhelmed. If macro or policy headlines wobble, the historical tendency toward deeper drawdowns in this window becomes harder to ignore.
What to watch in this window
First, watch how Nvidia trades around its 50-day moving average near 185. A failure to reclaim that level early in the window would be consistent with prior midterm-year patterns that saw rallies fade before deeper slides. A decisive move back above it, especially on lighter volatility, would be an early sign that this cycle may diverge from the historical short bias.
Second, keep an eye on AI policy headlines and any fresh signals on export controls or data center spending. In 2025, analysts repeatedly tied Nvidia’s swings to changing expectations around China GPU restrictions and hyperscaler capex, arguing that a friendlier policy backdrop could unlock significant upside in fiscal 2027.[1][3] Similar headlines in this midterm year could either reinforce the seasonal downside bias, if they disappoint, or blunt it if they point to a more supportive environment.
Third, monitor trading volume and intraday ranges. Past midterm-year windows have featured large maximum adverse excursions even in winning short years, which means that sharp squeezes have been part of the playbook rather than an exception. If this window starts to show expanding ranges and repeated intraday reversals, that would echo the high-variance behavior seen in 2002, 2010 and 2022.
Finally, track how Nvidia behaves relative to the broader AI and semiconductor complex. In 2025, sector commentary stressed Nvidia’s dominance in AI GPUs but also flagged rising competition and valuation risk.[1][9][10] If the stock begins to underperform peers during this window while macro conditions remain stable, that would line up with the historical pattern of midterm-year spring weakness. If instead Nvidia leads any rebound in growth names, traders will have a clear signal that this cycle is rewriting the seasonal script.
Sources
- [1] Barchart.com, "Nvidia Stock Just Got a New Street-High Price Target. Should You Buy NVDA Now?", Oct 27, 2025
- [2] Barchart.com, "Analysts Have High Hopes for Nvidia Ahead of August 27. Should You Buy NVDA Stock Here?", Aug 22, 2025
- [3] Business Insider, "Nvidia earnings updates: Analysts are bullish before Q3 results", Nov 19, 2025
- [4] Seeking Alpha, "Nvidia: It's Not A Bubble, It's A Dam (NASDAQ:NVDA)", Oct 16, 2025
- [5] Reuters, "Nvidia beat may yet stir fear on the Street", Nov 20, 2025
- [6] Seeking Alpha, "Nvidia: All-Time High Is In Sight, Upgrade To Strong Buy (NASDAQ:NVDA)", Jun 13, 2025
- [7] Yahoo Finance, "Nvidia CEO drops 8 bombshell quotes about its future", Aug 30, 2025
- [8] Yahoo Finance, "The Saturday Spread: Here’s How to Properly Trade the Nvidia (NVDA) Stock Discount", Dec 13, 2025
- [9] Seeking Alpha, "Nvidia rises even as Citi trims estimates amid concerns over increased competition (NVDA:NASDAQ)", Sep 8, 2025
- [10] Seeking Alpha, "Nvidia: You're Running Out Of Time To Sell (NASDAQ:NVDA)", Nov 26, 2025
- [11] Business Insider, "Watch for this signal in Nvidia stock to capitalize on spring-loaded gains ahead", Sep 3, 2025
- [12] Seeking Alpha, "Nvidia: Why A Sharp Breakout Might Be Imminent (NASDAQ:NVDA)", Jun 22, 2025