This 22-Day Midterm Window Has Delivered 104% Cumulative Short Profits in Nvidia (NVDA)
Nvidia is trading just below its recent highs as it approaches a 22-day midterm-year window that has historically delivered steady downside moves, even while options markets brace for a major earnings swing.

What is the seasonal pattern for Nvidia (NVDA)?
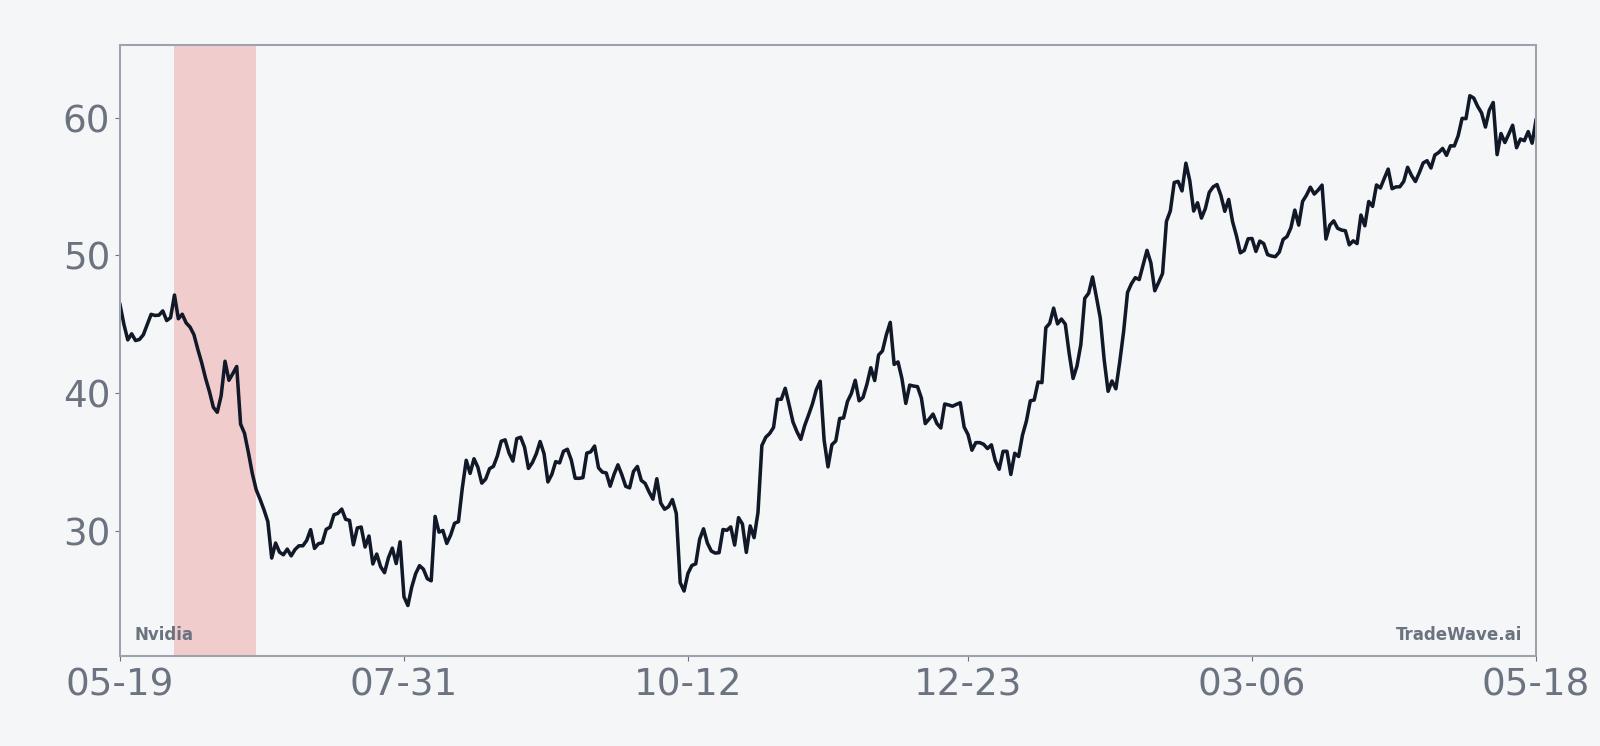
Nvidia has fallen in 6 of 6 midterm-year windows starting around Jun 2, with an average 12.95% gain for short positions in winning years.
- 6 for 6 in this window for shorts, with average winning-year profits of 12.95% over 22 trading days.
- The upcoming pattern runs from Jun 2 for 22 sessions and is based on the last 6 midterm election years.
- Percent Profitable is 100%, with 6 winners and 0 losers for the short-side seasonal setup.
- Trade Direction is short, supported by a TradeWave Ratio of 1.64 and a Sharpe ratio of 1.45 across the sample.
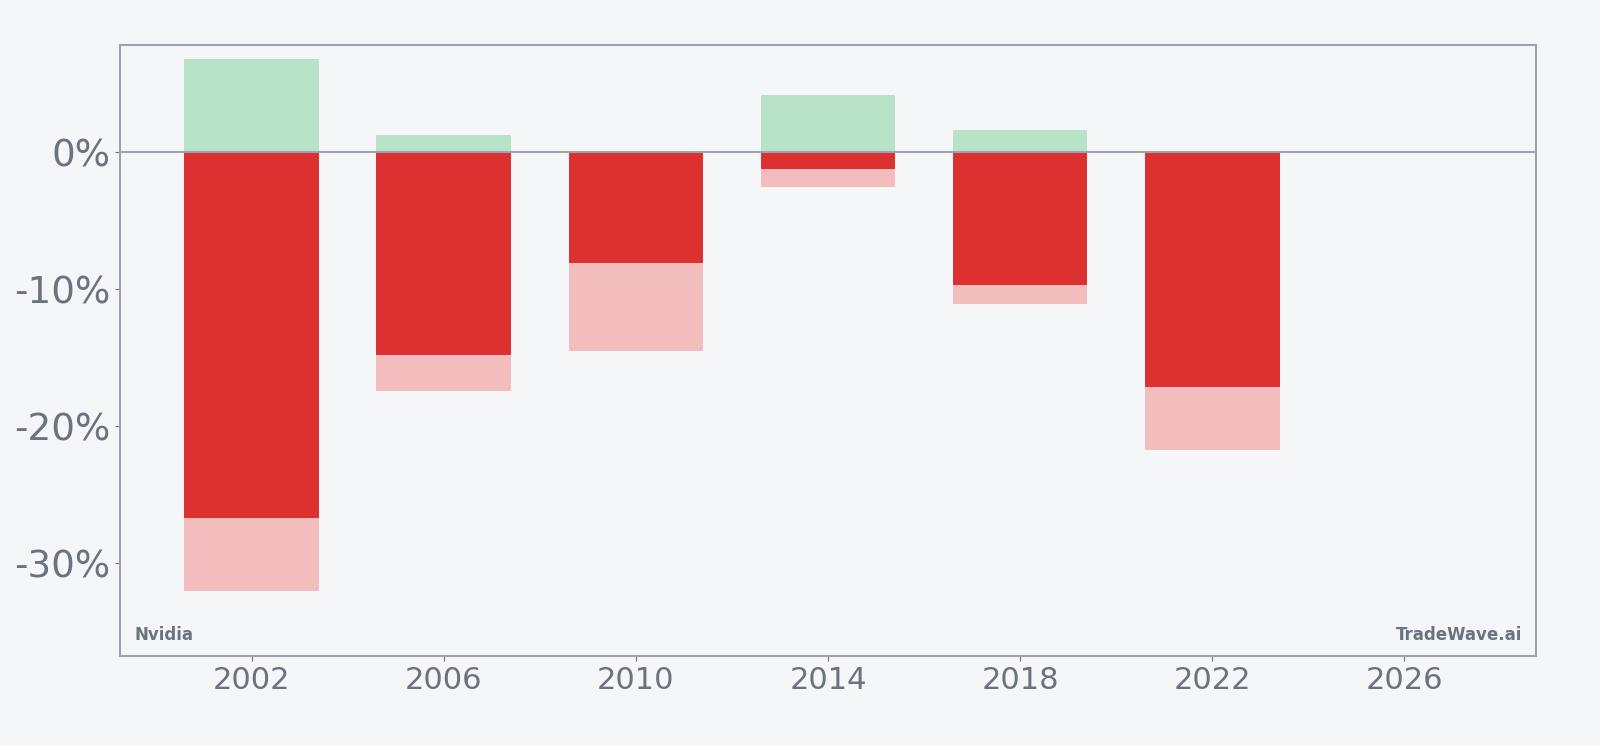
- Individual years have seen sizable intraperiod swings, including adverse moves larger than 20% before the trade ultimately worked.
- Add it up: cumulative return across the six midterm-year windows is 104% for the short strategy.
According to historical data from TradeWave.ai, this early-June stretch has behaved very differently for Nvidia in midterm election years than in a typical month on the calendar.
How has Nvidia (NVDA) traded in this midterm-year June window?
Nvidia has dropped in every one of the last six midterm election years during the 22-day window that begins on Jun 2, with short positions averaging 12.95% profits. Shares finished Thursday at $212.60, leaving the stock about 10.1% below its 52-week high of $236.54 and still well above its 50-day moving average of $198.73.[1] Options desks are also flagging heavy upside call buying and short-dated calls trading rich to puts ahead of the next earnings report, a setup that points to elevated volatility layered on top of this historically weak seasonal stretch.[8]
The pattern is grouped by the presidential election cycle, focusing on the last six midterm election years rather than six consecutive calendar years. That matters because policy uncertainty, rate debates and fiscal wrangling often cluster in midterm years, and mega-cap tech stocks like Nvidia have increasingly become the shock absorbers for those macro swings.
A second view layers in both the best and worst intraperiod swings for each year, highlighting how far Nvidia has tended to move before the window closes.
Across the six midterm-year samples, the trade direction is unambiguously short: every window ended with Nvidia lower, delivering a 100% hit rate for the bearish setup. Average profit of 12.95% for winning years lines up with a 104% cumulative gain for the strategy, while the median outcome of 12.25% shows that results have clustered rather than hinging on a single outlier year.
The per-year table shows how that played out in practice. In 2002, the short trade finished up 26.72%, with the stock at one point rallying 6.85% against the position before sliding into a 32.06% intraperiod drawdown from the entry level. In 2022, the pattern delivered a 17.17% profit for shorts, but not before a brief 1.30% move against the trade and a maximum favorable move of 21.75% in the direction of the short.
Those swings are captured in the MFE/MAE profile. MFE, or maximum favorable excursion, is the best point-to-peak move in the trade direction during the window, while MAE, or maximum adverse excursion, is the worst drawdown from the entry. For Nvidia in this midterm-year slice, both numbers are large in several years, which means the stock has often whipped around before ultimately closing lower by the end of the 22 days.
The cumulative return chart for the pattern shows that the short-side gains tend to build gradually rather than arriving in a single crash. The typical path is a choppy first week, followed by a more decisive drift lower into the back half of the window, which is consistent with the Trend Short readings outpacing Trend Long across the sample.
Put together, the message is blunt: six for six, with double-digit average profits for shorts, makes this one of Nvidia’s cleaner midterm-year seasonal down windows on the calendar.
Why does Nvidia (NVDA) follow this seasonal pattern?
One likely driver is the way Nvidia’s earnings calendar and guidance updates have lined up with midyear macro jitters in past midterm election cycles, when investors often reassess growth and policy risk at the same time. Analysts have also pointed to institutional portfolio rebalancing and sector rotation in semiconductors around these dates, as funds trim winners to manage concentration and volatility. The pattern may also reflect options expiration dynamics, with dealers and hedgers adjusting exposure after big AI-driven rallies earlier in the year.
History does not guarantee future results, and even in a perfect 6-for-6 window, adverse intraperiod moves have been large enough to challenge timing and risk management.
What is driving Nvidia (NVDA) today?
Nvidia slipped 1.1% in the latest session to close at $212.60, leaving the stock about 10.1% below its 52-week high of $236.54 and still comfortably above its 50-day moving average of $198.73.[1] Trading volume of 167.6 million shares ran slightly above the recent 20-day average of 163.0 million, extending a stretch of heavy activity that has become the norm for the market’s AI bellwether.[1]
Options markets are the other big story. Short-dated calls are trading at a premium to puts, and multiple reports highlight heavy upside call buying ahead of Nvidia’s next earnings report, with implied moves large enough to swing hundreds of billions of dollars in market value.[8][10][14] That skew suggests traders are willing to pay up for upside exposure and protection against a post-earnings melt-up, even as others use puts and spreads to hedge a stock that has already logged massive gains over the past few years.
On the fundamental side, Nvidia’s most recent reported quarter featured revenue of $81.6 billion, underscoring how central AI infrastructure demand has become to the company’s story.[3] Commentary around that print framed AI adoption as a structural growth driver, but also flagged the risk that data center buildouts and supply constraints could create lumpy quarters rather than a straight line higher.[11]
Sector-wide, traders are hedging across semiconductor names even as they lean bullish on Nvidia specifically, a split that reflects both the company’s dominant AI position and the market’s awareness that expectations are sky high.[14] In that context, the upcoming midterm-year seasonal window is less about calling a top and more about recognizing that a stock priced for perfection has historically been vulnerable to sharp, tradable pullbacks in this exact slice of the calendar.
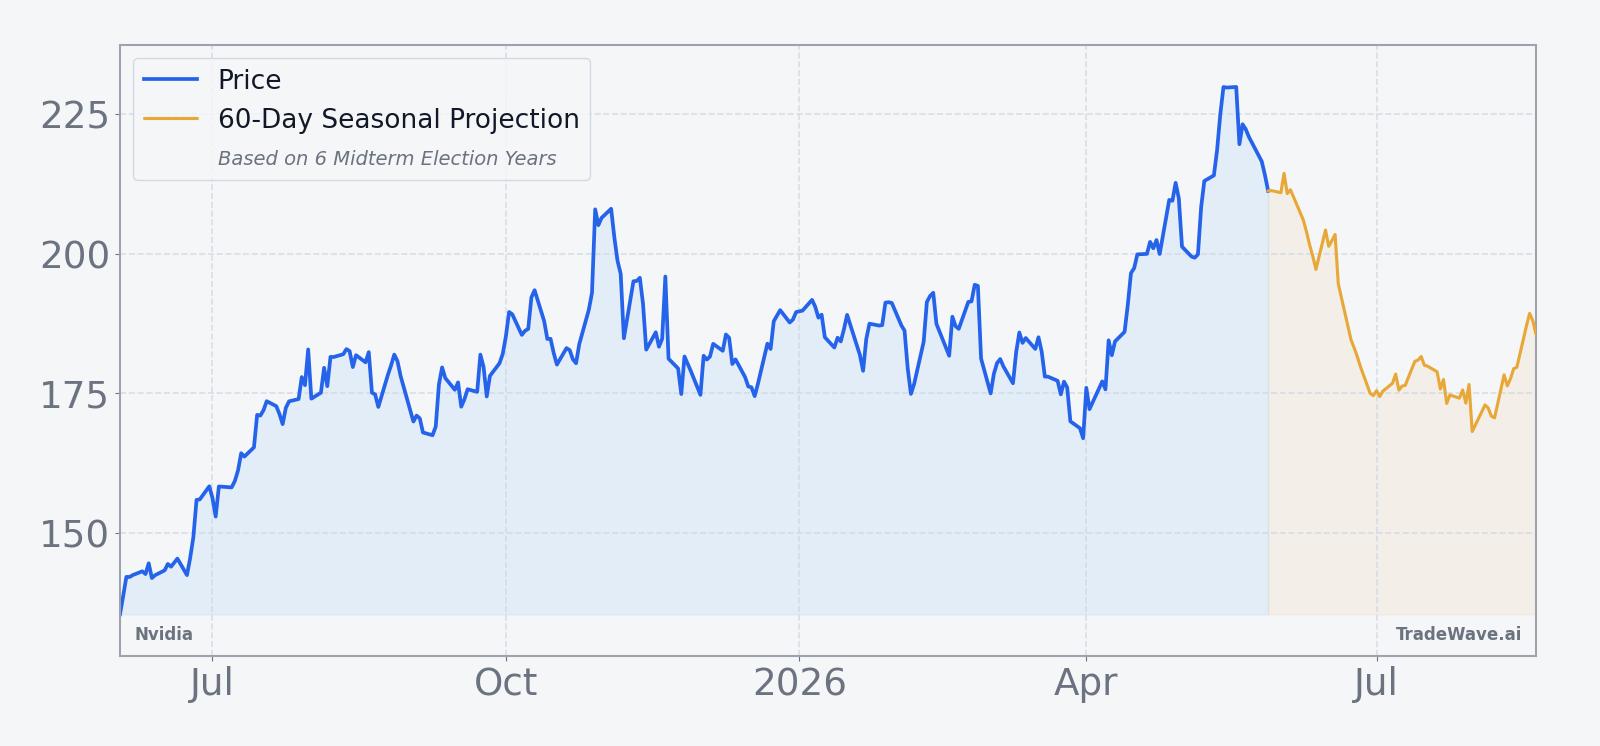
The chart below situates the latest pullback and options-driven volatility against Nvidia’s past year of trading and a 60-day seasonal projection.
What should traders watch in this Nvidia (NVDA) window?
First, the calendar: the 22-day midterm-year window kicks off on Jun 2, so price action in the first few sessions will show whether Nvidia respects its usual pattern of early choppiness followed by a grind lower. A firm break above the recent 52-week high near $236.54 during the window would mark a clear departure from the historical script, while a slide back toward the 50-day moving average around $198.73 would be more in line with prior cycles.[1]
Second, the options tape. The current skew toward short-dated upside calls and the size of implied earnings moves mean traders should watch whether call buying stays intense or fades once the earnings catalyst passes.[8][10][14] If upside demand cools while put hedging builds, that would reinforce the historical short-side seasonal bias; if call activity accelerates into and after earnings, it could fuel a squeeze that overwhelms the usual midterm-year pattern.
Third, the macro and policy backdrop. Midterm election years often feature noisy debates over fiscal policy and regulation, and Nvidia sits at the intersection of AI, data center spending and geopolitics. Any headlines that shift expectations for AI infrastructure budgets, export controls or broader tech regulation could amplify the moves that this window has historically produced.
Finally, traders should track how Nvidia trades relative to the broader semiconductor complex. In past cycles, weakness in mega-cap leaders during midyear midterm windows has sometimes dragged on indices, while resilience in Nvidia has helped cushion broader volatility. Whether the stock once again behaves as a volatility hub or breaks from its six-for-six seasonal record will be one of the more important tells for AI and growth risk this summer.
Sources
- [1] Yahoo Finance: NVIDIA Corporation (NVDA) Stock Price, News, Quote & History (May 28, 2026).
- [3] Yahoo Finance: Price Prediction: Nvidia Stock Will Hit $300 On This Date (May 28, 2026).
- [8] CNBC: Something very unusual is happening with Nvidia options (May 20, 2026).
- [10] Seeking Alpha: What Nvidia's options chain shows ahead of earnings (NVDA:NASDAQ) (May 19, 2026).
- [14] Reuters: Nvidia shares set for $350 billion price swing after earnings, options show (May 19, 2026).
- [9] Yahoo Finance: The Saturday Spread: Here’s How to Properly Trade the Nvidia (NVDA) Stock Discount (Dec 13, 2025).
- [11] Seeking Alpha: Nvidia: It's Not A Bubble, It's A Dam (NASDAQ:NVDA) (Oct 16, 2025).
About this seasonal analysis
Seasonal pattern data is sourced from TradeWave.ai, which analyzes historical price behavior across annual calendar windows going back up to 30 years. Read the full data methodology or the book The 100-Year Pattern by Afshin Moshrefi (2026 edition). Past performance of seasonal patterns does not guarantee future results. This article is for informational purposes only and does not constitute investment advice.