Despite War-Driven Demand, L3Harris (LHX) Faces a Historically Weak June for Shares
L3Harris is stepping into a 23-day midterm-year June stretch that has been reliably weak for the stock, even as shares sit well below last year’s highs.

What is the seasonal pattern for L3Harris (LHX)?
L3Harris has fallen in 10 of 10 midterm-year June windows during this 23-day trading stretch, with an average gain of 4.15% in winning years for the short side.
- 10 for 10 in this window for short trades, with an average profit of 4.15% across the last 10 midterm election years.
- Seasonal window starts Jun 3 and runs 23 trading days, targeting a historically weak early-summer stretch for LHX.
- Percent Profitable is 100%, with 10 winners and 0 losers for the short direction in this specific election-cycle grouping.
- TradeWave Ratio of 1.78 signals that price has typically traveled meaningfully in the trade direction within the window, not just at the close.
- Sharpe ratio of 1.12 points to a favorable risk-adjusted profile for the pattern, even with intraperiod drawdowns.
- Past years show adverse moves against the trade that can exceed 10%, so the window has been profitable but not low-risk.
According to historical data from TradeWave.ai, this early-June stretch for L3Harris behaves very differently in midterm election years than in a typical month. The next section looks at how that election-cycle pattern has played out over the last ten comparable windows.
How has L3Harris (LHX) traded in this midterm-year June window?
L3Harris has declined in all 10 of the last midterm election years during the 23 trading days starting Jun 3, a perfect record for short trades with an average profit of 4.15%. Shares finished Tuesday at $308.15, leaving the stock about 18.2% below its 52-week high of roughly $376.60 and up 5.78% year to date.[1]
Because this pattern is grouped by the presidential election cycle, it only looks at midterm election years, not every calendar year. That matters for defense stocks like L3Harris, where spending debates, budget ceilings and supplemental appropriations often bunch up in the middle of the four-year political cycle.
In this setup the trade direction is short, so negative returns for the stock have historically been winning outcomes. Across the last 10 midterm election years, every iteration of this 23-day L3Harris trading window has delivered a profit for that short bias, with no losing years in the sample. The median profit of 4.04% is close to the 4.15% average, which suggests the wins have been relatively clustered rather than driven by a single outlier.
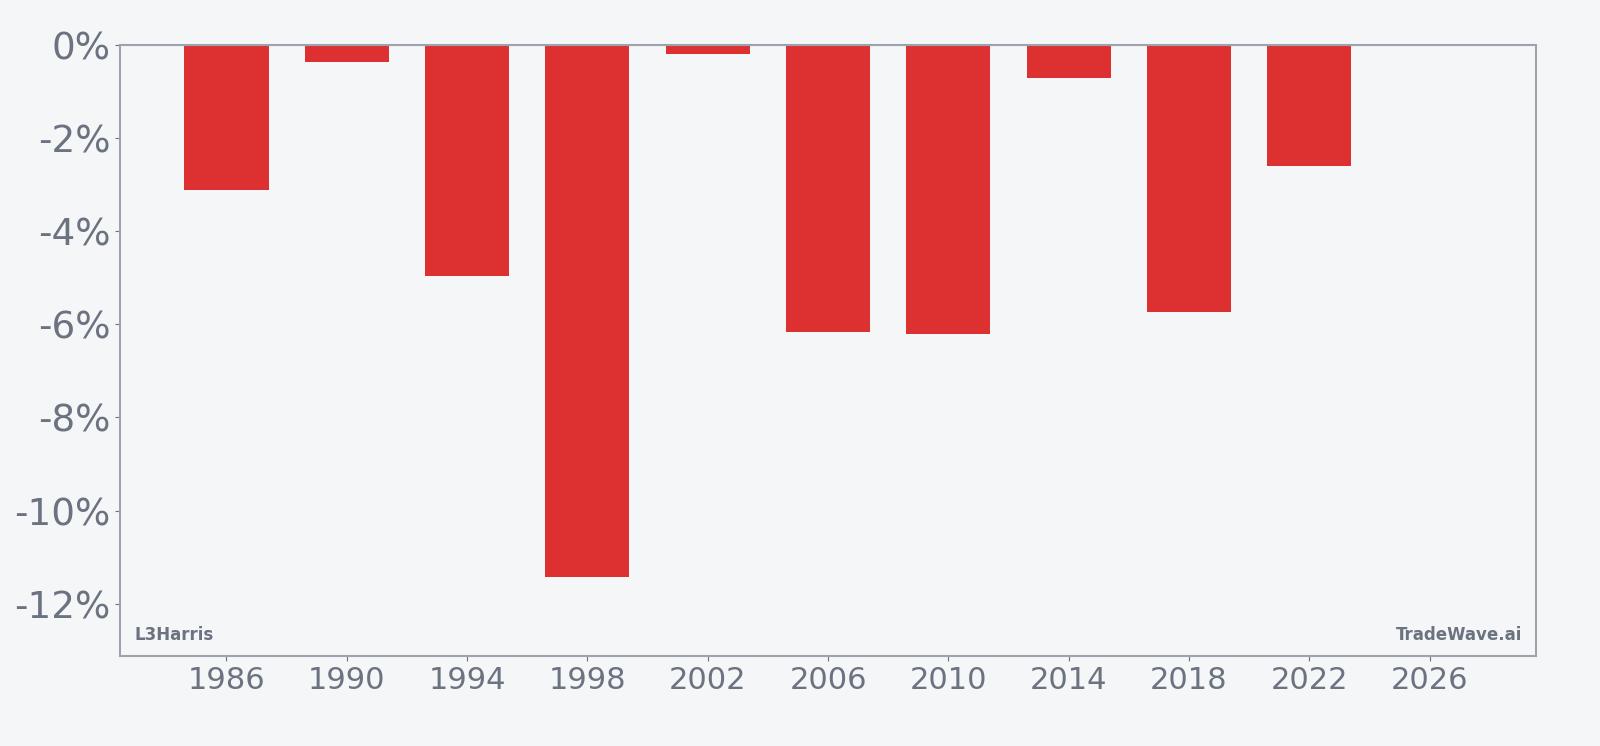
The per-year table shows how that has played out in practice. The strongest year for the pattern was 1998, when L3Harris dropped 11.42% during the window, while 1994 and 2010 also posted declines of roughly 5% to 6% that would have favored shorts. On the softer side, 1990 and 2002 still finished slightly lower, with net returns of 0.36% and 0.19% respectively, keeping the 10-for-10 record intact.
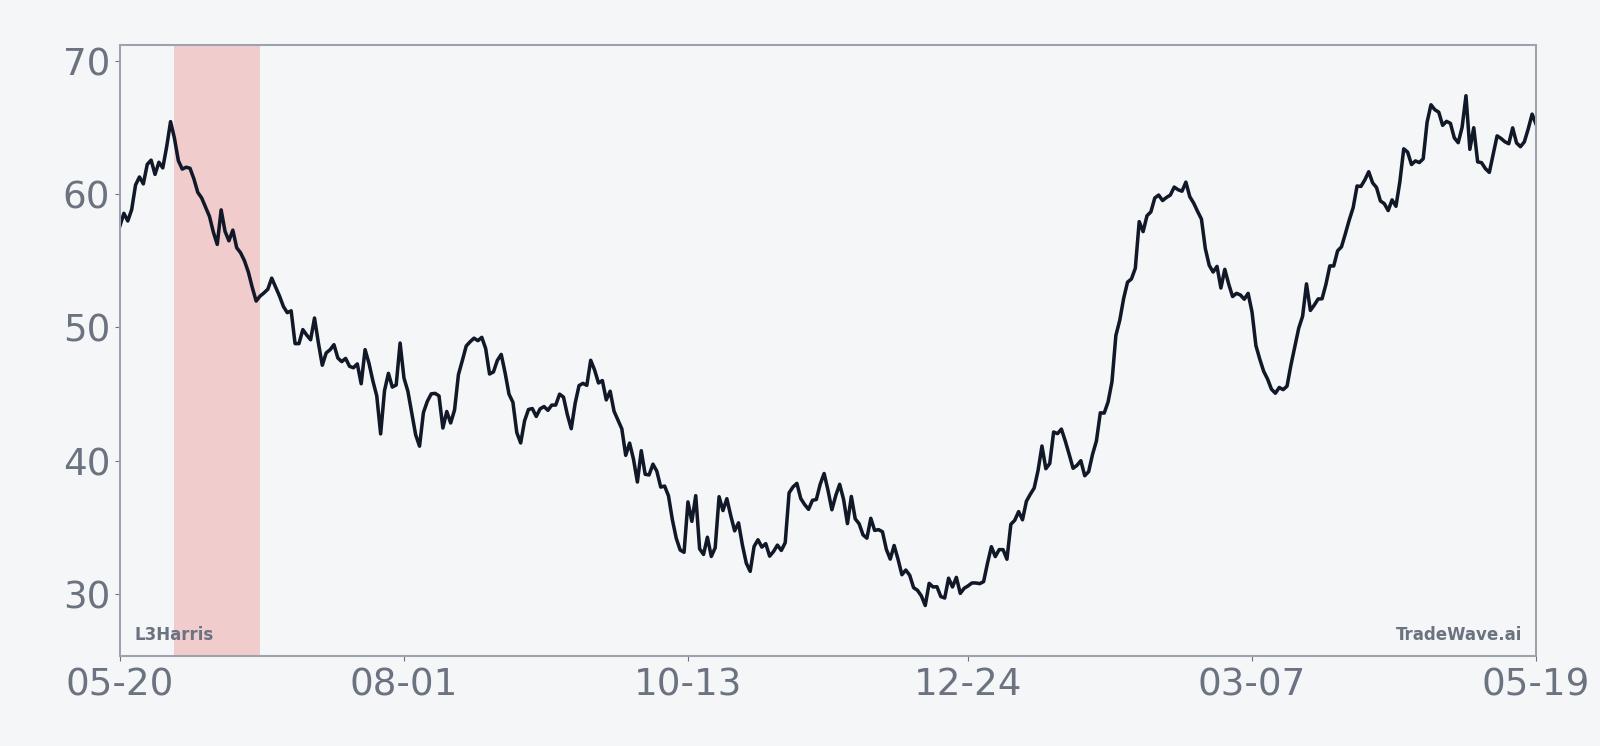
The historical seasonal trend line slopes steadily lower across most of the window, with much of the typical move occurring in the middle third of the period. That profile suggests a tendency for weakness to build after the first few sessions rather than an immediate gap lower on day one.
A second view that combines net results with best and worst intraperiod swings shows how far LHX has tended to travel inside the window before it closes.
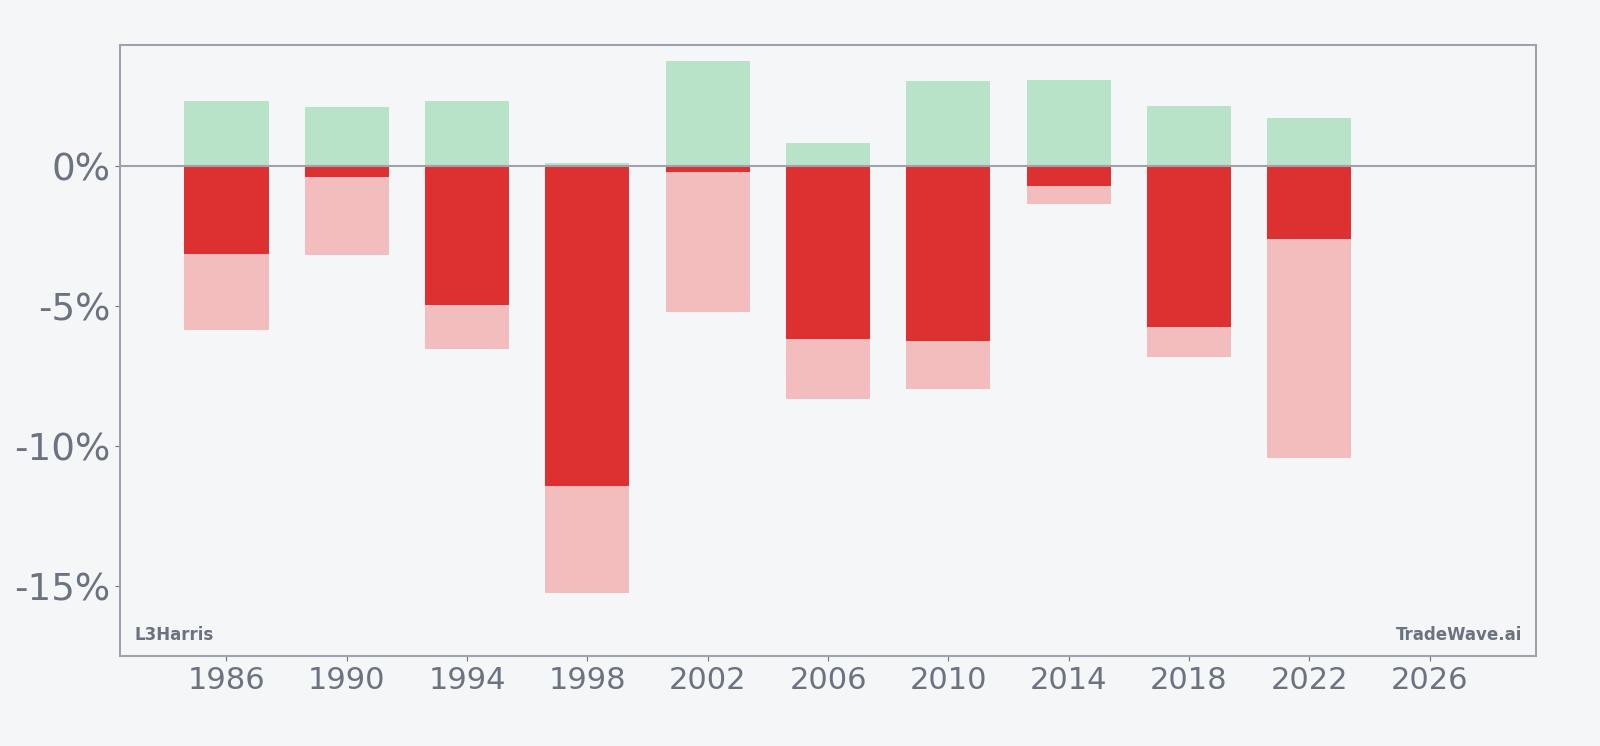
The combined net/MFE/MAE bars show that in strong years like 1998 and 2010, the maximum favorable move in the trade direction was large, while the maximum adverse move against the short was still meaningful, often in the 5% to 8% range. In 2022, for example, the stock’s worst drawdown against the short during the window was 10.43% even though the trade ultimately finished with a 2.6% profit. Add it up: this has been a consistently profitable but bumpy window for betting against LHX, not a smooth glide path.
History does not guarantee future results, and the worst intraperiod drawdowns (MAE) in this window have exceeded 10% in some years even when the final outcome was profitable for the short side.
Why does L3Harris (LHX) follow this seasonal pattern?
This midterm-year June pattern may reflect how defense budgets and procurement decisions line up with the political calendar. One likely driver is that midyear in a midterm election cycle often brings noise around spending caps and continuing resolutions, which can delay contract awards and weigh on contractor stocks. For L3Harris specifically, analysts have pointed to the timing of U.S. government awards and portfolio reshuffling as reasons why early summer can be choppy even when long-term demand for defense systems is strong.[2]
What is driving L3Harris (LHX) today?
L3Harris closed Tuesday at $308.15, down 0.47% on the day, leaving the stock modestly positive for 2026 and still well off its 52-week high near $376.60.[1] That puts the shares about 32.9% above the 52-week low around $231.91, with the stock trading below its 50-day moving average of $328.47 and on lighter-than-average volume compared with the 20-day average of roughly 1.30 million shares.[1]
In January 2026, L3Harris reported quarterly revenue of $5.65 billion that missed Wall Street estimates after a 43-day U.S. government shutdown delayed contract awards, a reminder of how sensitive the company’s near-term numbers are to Washington’s calendar.[3] Earlier that month, the company sold a 60% stake in its space propulsion and power systems business for $845 million and reorganized into three segments to focus more tightly on defense capabilities, including Space & Mission Systems, Communications & Spectrum Dominance, and Missile Solutions.[5]
Those moves followed a July 2025 guidance raise, when L3Harris lifted its 2025 revenue outlook to about $21.75 billion and increased adjusted profit guidance to $10.40 to $10.60 per share on steady demand for defense equipment.[2] Rising geopolitical tensions, from the Russia-Ukraine war to Middle East flashpoints, have supported that demand backdrop and helped keep investor attention on the broader aerospace and defense sector.[2]
The chart below situates the latest move in its recent multi-month context, alongside a 60-day seasonal projection.
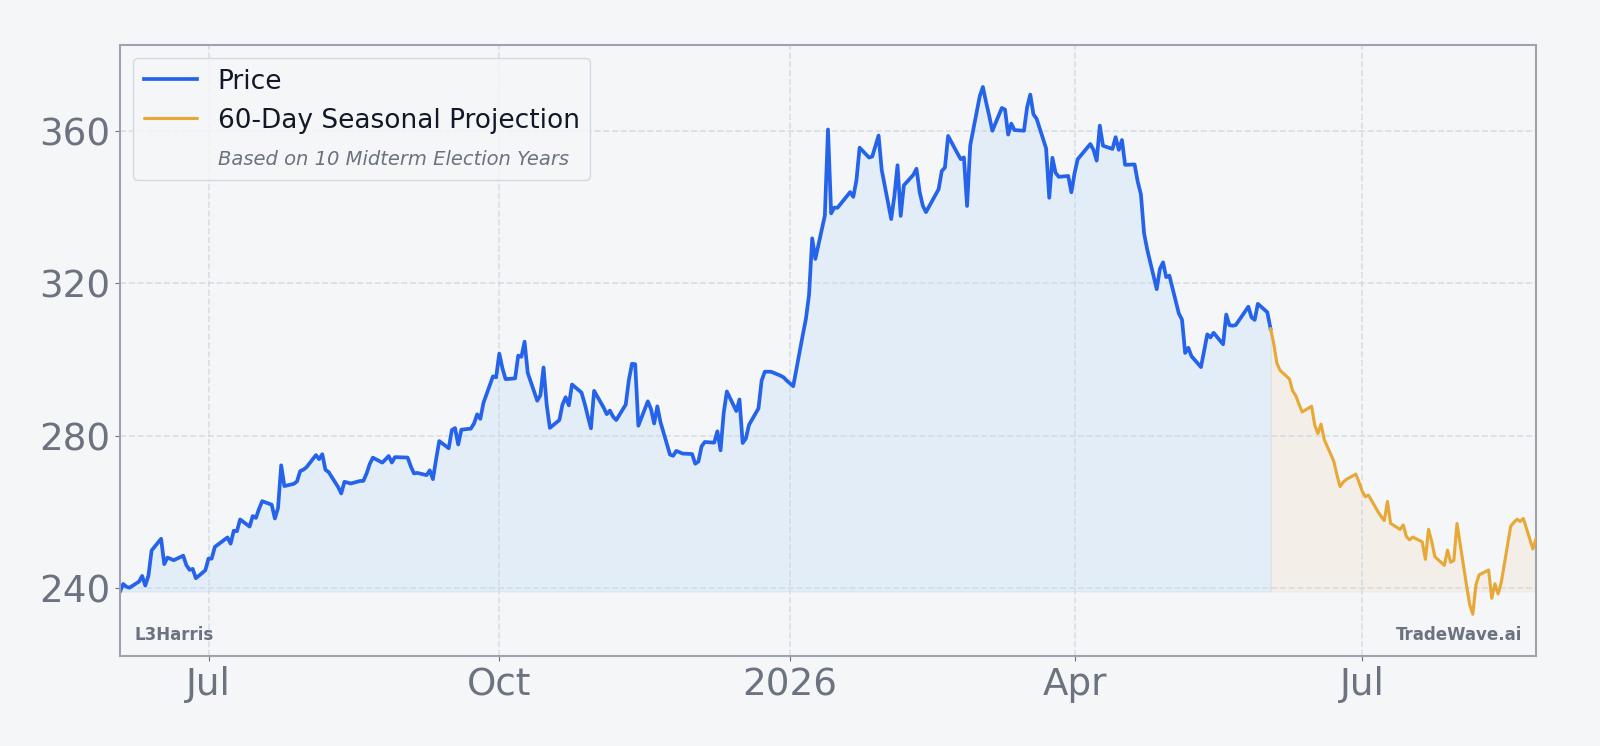
From here, investors will be watching how the stock trades into the next earnings update, currently expected around Jul 24, 2026, when management is likely to revisit full-year guidance and discuss the impact of the space-tech stake sale and the planned IPO of the rocket-motor business.[3] With consensus analyst ratings skewed toward Buy and a Yahoo Finance aggregate price target of $381.95, the Street still sees upside from current levels, even as the historical LHX seasonal trend in this specific midterm-year June window has leaned sharply bearish for the stock price.[1]
What should traders watch in this L3Harris seasonal window?
For this 23-day midterm-year June window, the first thing to watch is whether LHX respects the historical pattern of drifting lower after the opening sessions or instead breaks that script with a sustained move above the 50-day moving average near $328.[1] A quick test of support closer to the 52-week low zone would be consistent with prior windows, while a grind higher toward the $340 to $350 area would mark a clear departure from the usual LHX seasonal trend.
Second, the behavior of volume relative to the 20-day average will matter. Past windows have seen meaningful intraperiod swings, so a pickup in trading activity around policy headlines, budget negotiations or contract announcements could signal that the familiar pattern is in play again. Finally, traders will be tracking how any new guidance or contract color around the late-July earnings date interacts with this seasonal backdrop, especially if management comments on the timing of delayed awards after the earlier government shutdown.[3]
If L3Harris holds firm or rallies through this historically weak stretch, it would be a notable break from the last ten midterm election years and could signal that the combination of portfolio reshaping and elevated geopolitical demand is overpowering the usual midyear drag. If instead the stock resumes its tendency to soften into late June, the 10-for-10 record for this L3Harris trading window will remain one of the more striking defense-sector seasonal patterns on the calendar.
Sources
- Yahoo Finance, "L3Harris Technologies, Inc. (LHX) Stock Price, News, Quote & History", Jun 2, 2026.
- Reuters, "Defense contractor L3Harris raises 2025 outlook on steady demand", Jul 24, 2025.
- Reuters, "L3Harris quarterly revenue misses estimates on government shutdown pressures", Jan 29, 2026.
- Reuters, "L3Harris sells 60% stake in space propulsion business for $845 million", Jan 5, 2026.
About this seasonal analysis
Seasonal pattern data is sourced from TradeWave.ai, which analyzes historical price behavior across annual calendar windows going back up to 30 years. Read the full data methodology or the book The 100-Year Pattern by Afshin Moshrefi (2026 edition). Past performance of seasonal patterns does not guarantee future results. This article is for informational purposes only and does not constitute investment advice.