Section 232 Tariff Changes Spark SWK Pop, But Stanley Black & Decker Still Enters a Weak 43-Day Run
Stanley Black & Decker is stepping into a historically weak 43-day midterm-year stretch even as the stock trades well below its 52-week high and remains under pressure year to date.

What is the seasonal pattern for Stanley Black & Decker (SWK)?
Stanley Black & Decker has fallen in 10 of 10 midterm-year summer windows starting Jun 3, with an average 5.76% gain for short positions in winning years.
- 10 for 10 in this window, with short trades averaging 5.76% profit across winning years.
- The 43-day pattern starts on Jun 3 in midterm election years and has delivered a 73% cumulative return for the short side.
- Percent Profitable is 100%, with 10 winners and 0 losers across the last 10 midterm election-year cycles.
- Average winner profit of 5.76% comes with a standard deviation of 4.37%, pointing to meaningful but not extreme variability.
- The TradeWave Ratio of 1.84 suggests price typically travels materially in the trade direction within the window before it closes.
- Sharpe ratio of 1.21 indicates historically attractive risk-adjusted returns for this specific short-side seasonal setup.
According to historical data from TradeWave.ai, this midterm-year stretch has behaved very differently from an average summer for Stanley Black & Decker, with a clear directional bias that most investors never see in standard charts.
How has Stanley Black & Decker (SWK) traded in this midterm-year summer window?
Stanley Black & Decker has declined in every one of the last 10 midterm election years during the 43 trading days starting Jun 3, a perfect record for short positions that averaged 5.76% profit. The stock closed at 79.09 on Jun 2, up 1.18% on the day and about 13.4% below its 52-week high of 91.33, with shares still down roughly 5% year to date.[2]
Grouping the data by the presidential election cycle matters here because this pattern only shows up in midterm election years, not in a generic June or July seasonal chart. Midterm years often bring policy uncertainty, tariff headlines and shifting industrial demand, which can hit cyclical names like Stanley Black & Decker differently than in the calmer pre-election year that follows.
The historical seasonal trend line slopes steadily lower across most of the window, which fits a short-side pattern. Losses for the stock tend to build gradually rather than in a single air pocket, with the average path showing pressure through the middle of the window before stabilizing toward the end. That profile suggests a persistent midterm-year headwind rather than a one-off shock.
Intraperiod swings show how far SWK has typically moved in both favorable and adverse directions during this window.
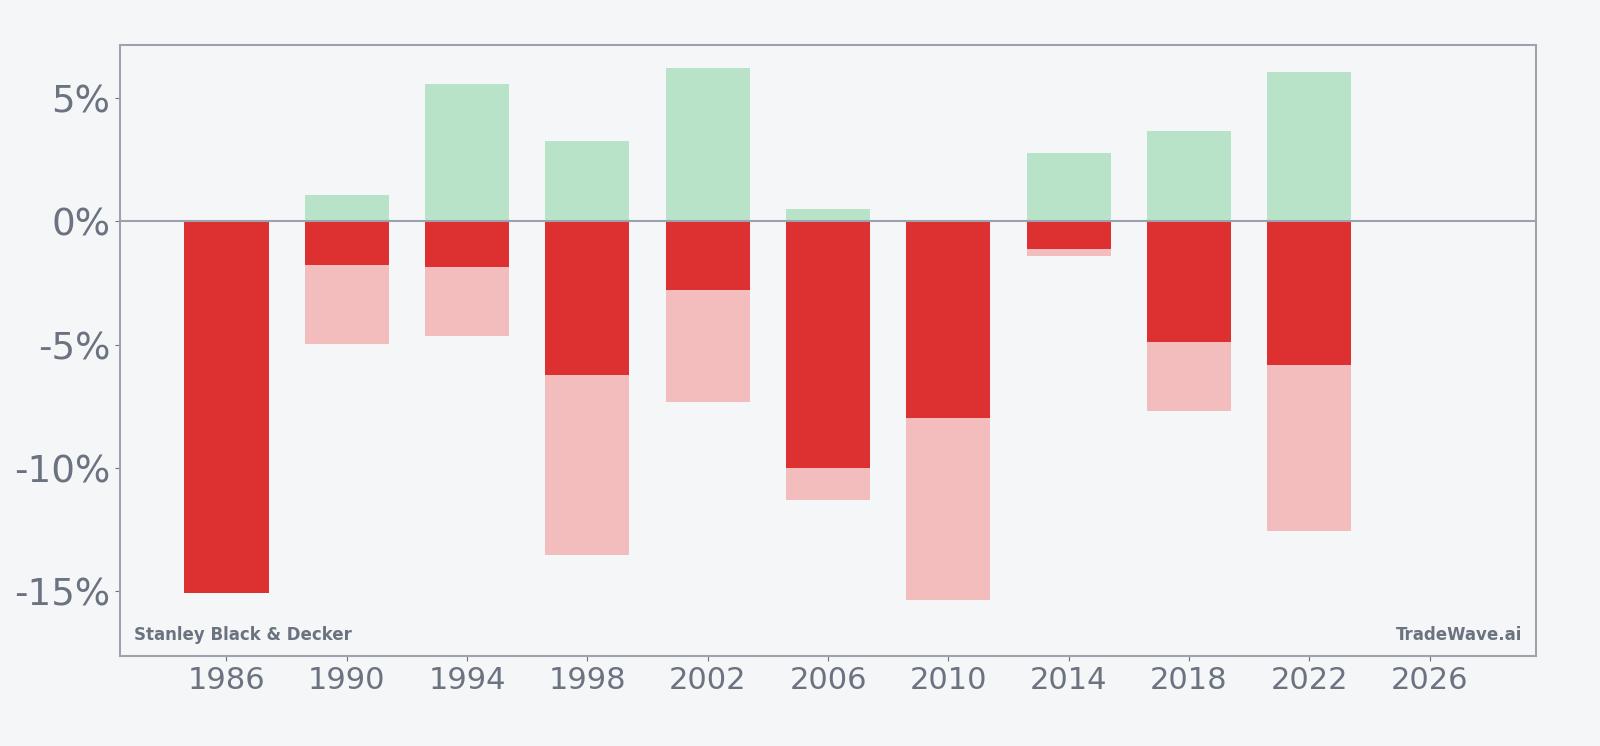
The per-year bars show that even in the strongest short years, like 1986 with a 15.07% decline from entry to exit, Stanley Black & Decker often experienced sizable adverse moves inside the window before finishing lower. In 2010, for example, the stock’s worst intraperiod drawdown from the short entry reached 15.36% against the position, even though the final net move still favored the short side by 8.0%. That mix of solid net gains and chunky intraperiod reversals is exactly what the TradeWave Ratio of 1.84 is flagging: price tends to travel meaningfully in the trade direction, but not in a straight line.
On the favorable side, maximum favorable excursions in several years ran into mid-single to low-double digits, giving shorts room to work when the pattern clicked. Years like 1994 and 2002 saw the stock drop between roughly 1.8% and 2.8% by the end of the window, but with favorable intraperiod moves above 5% at points along the way. Add it up: 10 midterm election years, 10 profitable short windows, and a 73% cumulative return across the sample.
History does not guarantee future results, and the worst intraperiod drawdowns in this window have been large enough that even winning years would have been uncomfortable to sit through.
Why does Stanley Black & Decker (SWK) follow this seasonal pattern?
One likely driver is the way industrial and tools companies line up guidance and orders around the midyear period in midterm election years, when policy and tariff debates can cloud visibility. Analysts have pointed to tariff headlines and shifting aerospace and construction demand as recurring mid-cycle stress points for names like Stanley Black & Decker, which can weigh on shares even without a single obvious catalyst.[3] This pattern may also reflect institutional portfolio repositioning in midterm summers, as managers rebalance exposure to cyclical industrials ahead of the historically stronger pre-election year.
What is driving Stanley Black & Decker (SWK) today?
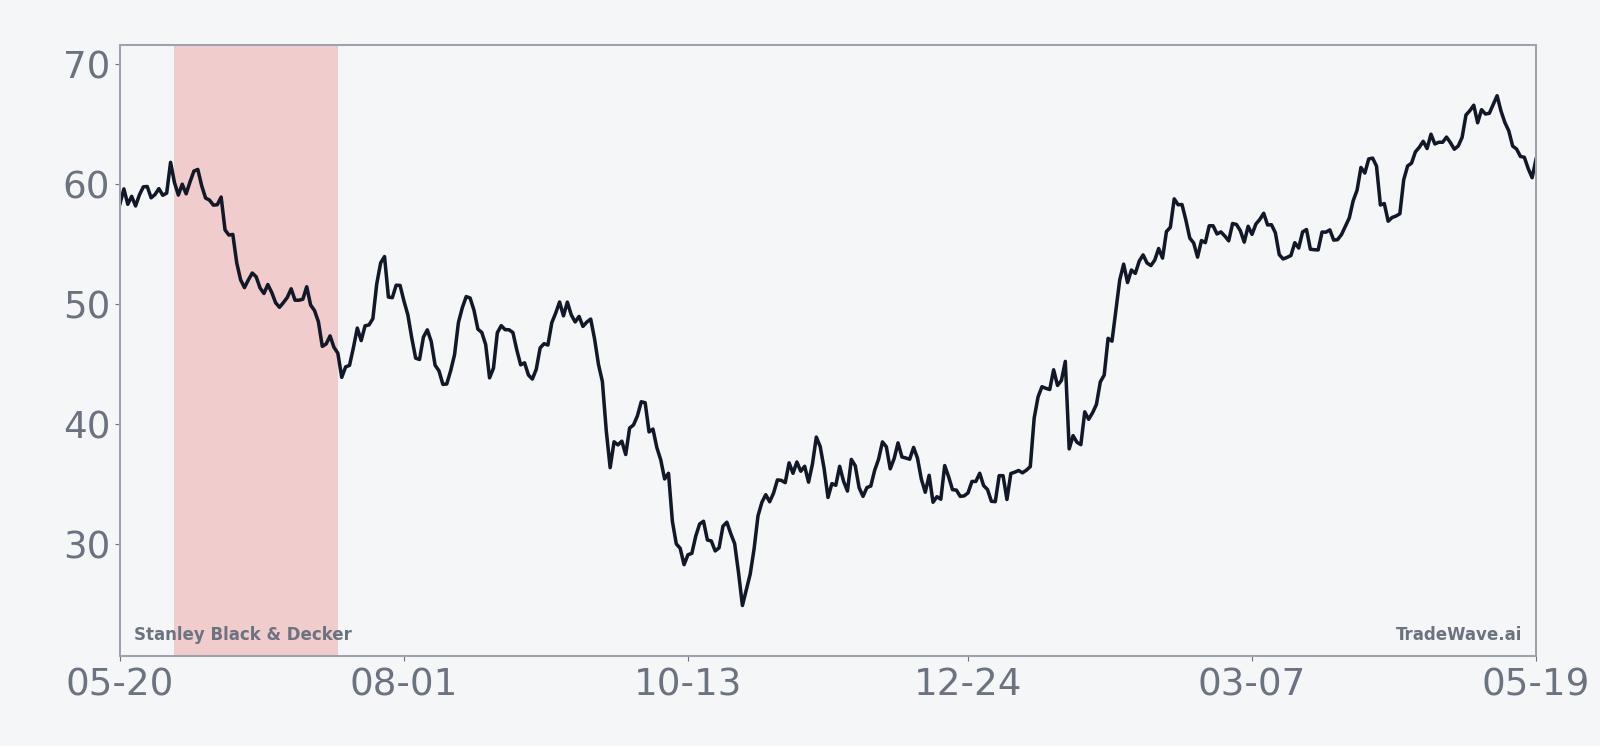
Stanley Black & Decker last traded around 79.14, up about 1.2% on the session, leaving the stock roughly 13.4% below its 52-week high of 91.33 and about 37.7% above its 52-week low near 57.45, with a 5.7% gain over the past month but still down roughly 5% for 2026.[2] That mix of a short-term bounce and a negative year-to-date print sets an interesting backdrop for a stock that has already been through a multi-year restructuring and portfolio cleanup.
Near-term, the most visible macro driver has been trade policy rather than company-specific news. On Apr 20, CNBC reported that shares jumped more than 4% intraday after management said recent changes to Section 232 tariffs were not expected to have a material impact on the full-year forecast, easing fears that another round of trade friction would hit margins.[3] That comment helped stabilize sentiment around the industrial and tools maker, which had already moved to streamline its portfolio by agreeing in Dec 2025 to sell its Consolidated Aerospace Manufacturing unit to Howmet Aerospace for $1.8 billion in cash, a deal framed as a way to reduce debt and refocus on core brands.[2]
Those steps fit a broader industrial-sector story in which management teams are trying to simplify operations and shore up balance sheets ahead of a potentially choppy policy and rate backdrop. For Stanley Black & Decker, the combination of tariff reassurance and portfolio pruning has bought time, but the stock’s position below its 50-day moving average of 74.79 earlier this spring and its still-muted volume relative to the 20-day average of about 1.55 million shares show that conviction remains tentative.[2] The seasonal window that starts on Jun 3 arrives against that backdrop of cautious optimism and lingering skepticism.
The chart below situates the latest move in its recent multi-month context and overlays the upcoming seasonal projection.
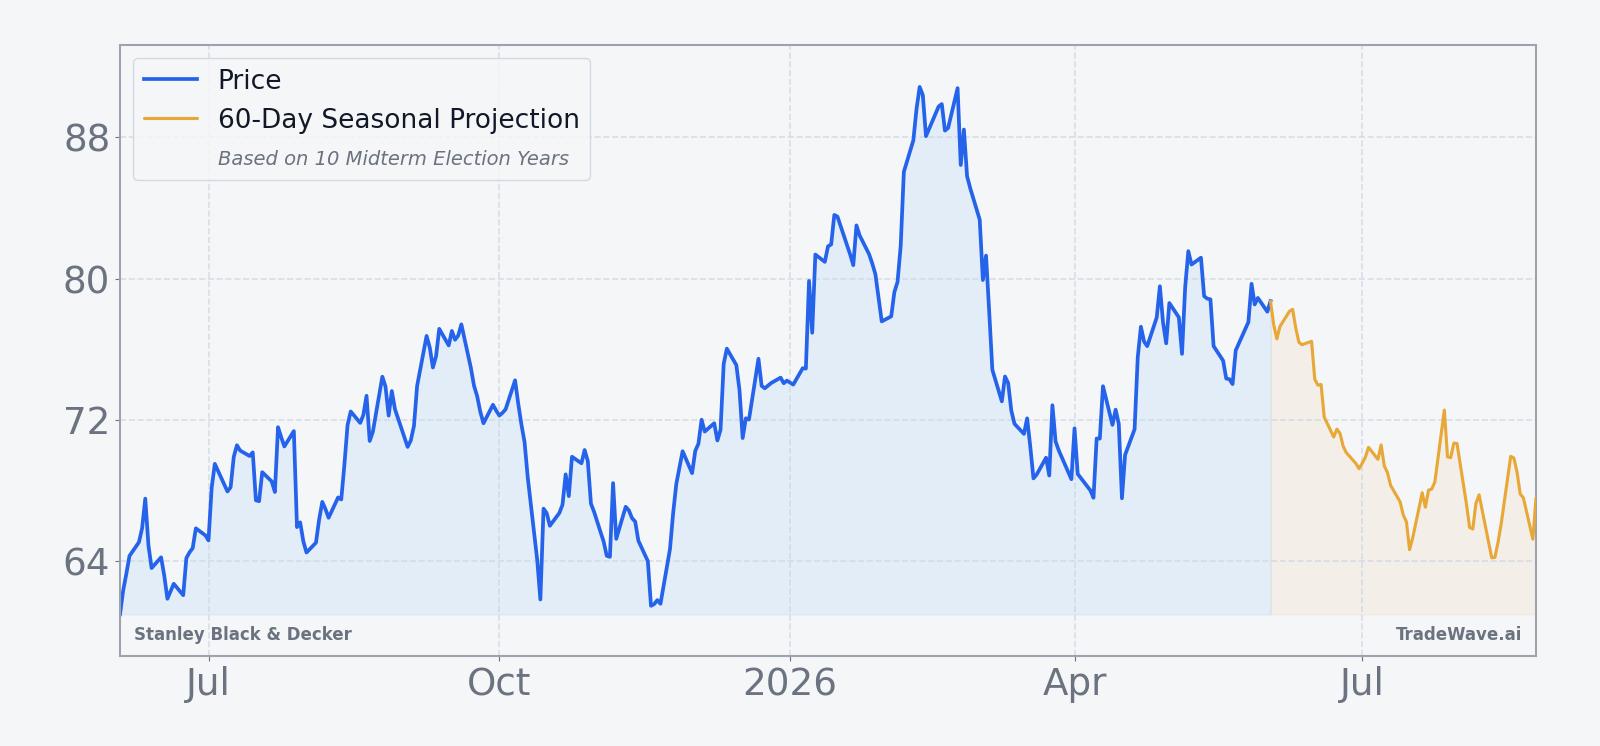
What should traders watch in this Stanley Black & Decker seasonal window?
First, watch how SWK behaves relative to the 79 to 82 zone as the window progresses. Historically, the pattern has not required a fresh high to start working, but it has tended to see pressure build through the middle of the 43-day stretch rather than immediately. A failure to hold recent gains while the broader industrial sector is stable would be one sign that the midterm-year seasonal trend is reasserting itself.
Second, monitor macro and policy headlines around tariffs and industrial demand. The company’s April comment that Section 232 tariff changes were not expected to alter the full-year outlook helped spark a sharp intraday move, showing how sensitive the stock can be to trade rhetoric.[3] Any reversal in that narrative, or fresh noise around infrastructure spending and construction activity, could add fuel to a historically weak seasonal period.
Third, pay attention to intraperiod volatility rather than just the final outcome. Past midterm-year windows have seen maximum adverse moves against the short side reach double digits in some years, even when the final result still favored shorts. If this year’s window starts with a squeeze higher but then rolls over in line with the historical pattern, that would fit the “choppy but lower” template embedded in the TradeWave Ratio and the MAE/MFE profile.
Finally, the broader election-cycle context matters. The market is in the midterm election year today, with the pre-election year historically offering a more supportive backdrop for cyclicals. How SWK trades in this 43-day slice could shape how investors think about owning the stock into that next phase: a clean break lower would reinforce the idea that midterm summers are for de-risking industrial exposure, while resilience or outright strength through this historically weak window would be an early sign that the company’s restructuring and tariff insulation are starting to change the script.
Sources
About this seasonal analysis
Seasonal pattern data is sourced from TradeWave.ai, which analyzes historical price behavior across annual calendar windows going back up to 30 years. Read the full data methodology or the book The 100-Year Pattern by Afshin Moshrefi (2026 edition). Past performance of seasonal patterns does not guarantee future results. This article is for informational purposes only and does not constitute investment advice.