Advanced Micro Devices (AMD) Has Dropped in 10 of 10 Midterm Summer Windows as 40-Day Weak Stretch Opens
Advanced Micro Devices is heading toward a historically weak 40-day midterm-year window just as the stock trades near record highs after an AI-fueled earnings surge.

What is the seasonal pattern for Advanced Micro Devices (AMD)?
Advanced Micro Devices has fallen in 10 of 10 midterm-year summer windows during this 40-day stretch, with an average gain of 14.98% in winning years for the short side.
- 10 for 10 in this window, with the short side averaging 14.98% gains across the last 10 midterm election years.
- Seasonal window runs from Jun 15 for 40 trading days, targeting the mid-year stretch of the midterm election year.
- Percent Profitable is 100%, with 10 winners and 0 losers for the short direction in this AMD seasonal trend.
- TradeWave Ratio of 2.17 signals that price has typically traveled meaningfully in the trade direction within the window.
- Sharpe ratio of 1.12 reflects strong risk-adjusted returns for the short pattern across this Advanced Micro Devices trading window.
- Historical drawdowns inside the window have been sizable in several years, underscoring that intraperiod volatility can be sharp even when the short ultimately wins.
According to historical data from TradeWave.ai, this upcoming midterm-year stretch has behaved very differently from an average summer for AMD. The next section walks through how that election-cycle pattern has played out in prior decades.
How has Advanced Micro Devices (AMD) traded in this midterm-year summer window?
Advanced Micro Devices has declined in all 10 midterm election years during this 40-day window, with the short side averaging a 14.98% gain and a 100% win rate. The next iteration begins on Jun 15, 2026, with AMD changing hands at $521.54 on Jun 3, about 1.1% below its 52-week high of $527.20.[13] That puts a historically weak seasonal stretch directly in front of a stock that has been on a powerful AI-driven run.
Because this pattern is grouped by the presidential election cycle, it captures only the last 10 midterm election years rather than consecutive calendar years. That matters in 2026, which is the midterm election year in the current cycle, since policy uncertainty, regulatory noise and shifting fiscal expectations often cluster in this phase and can amplify volatility in mega-cap growth names like AMD.
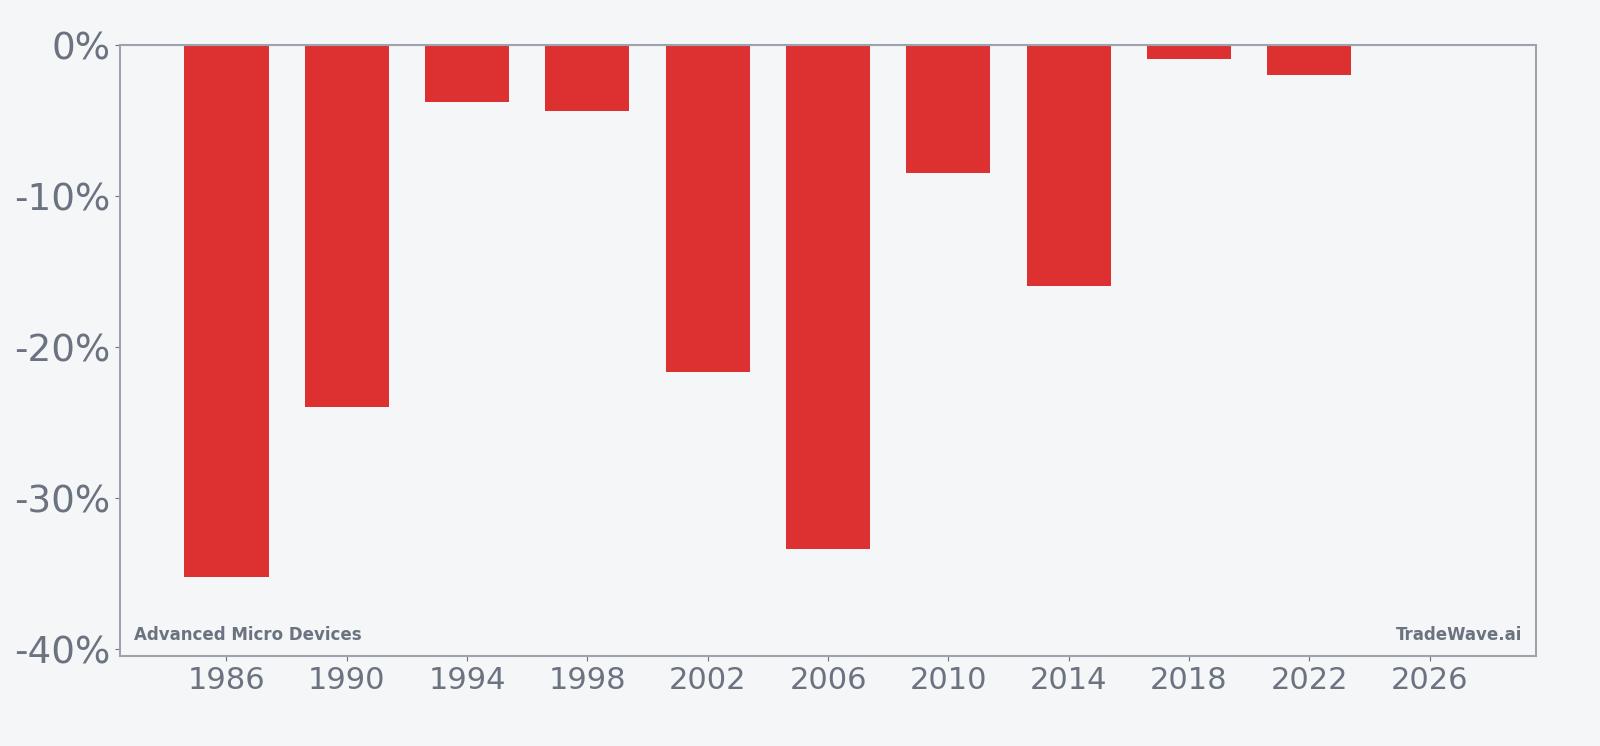
Across the 10 midterm-year samples, the short pattern has been helped by several large downside years. In 1986, AMD dropped 35.2% during the window, with the worst intraperiod drawdown from entry reaching 36.87% and only a modest 2.23% best run-up against the short.[8] In 2006, the stock fell 33.4% over the same stretch, again with the adverse move against the short capped near 1.03% while the favorable excursion approached the full net decline.
Even the milder years have tended to lean lower. The smallest net decline in the sample was 0.92% in 2018, but that year still saw AMD trade as much as 11.02% below the entry point at the worst moment for longs before finishing slightly down.[8] The 2022 midterm year produced a 1.97% net drop, with the stock at one point trading 19.82% below the starting level inside the window, a reminder that intraperiod swings can be much larger than the final result.
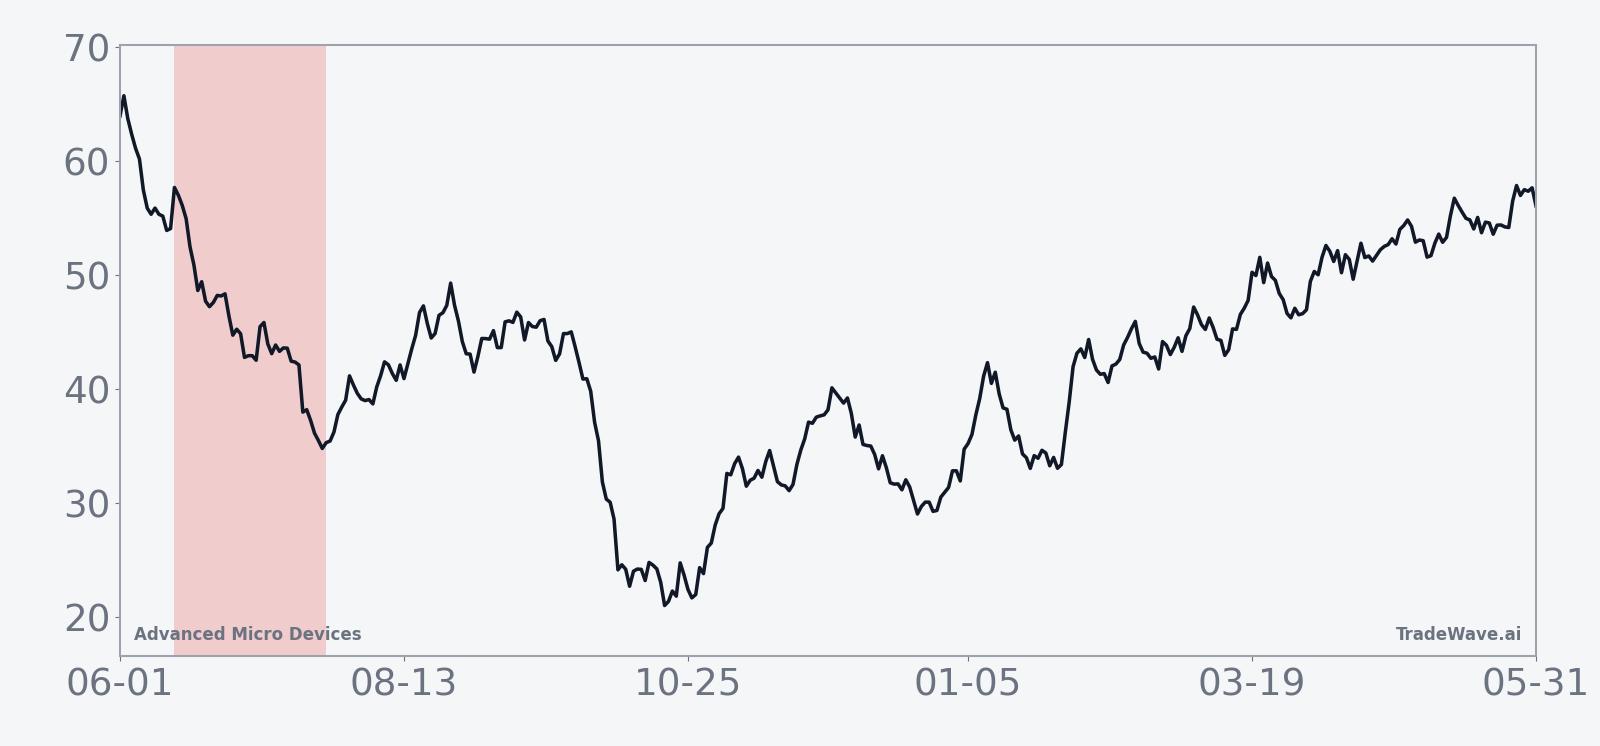
The historical seasonal average shows the bulk of the downside accruing in the middle of the window rather than in a straight line from day one. Early days often see modest noise or even small rallies against the short before the typical pattern bends lower, then flattens into the close of the 40-day span. That choppy start followed by a more directional phase is a hallmark of this AMD seasonal trend.
Year-by-year bars that combine net returns with best and worst excursions put that volatility profile into sharper focus.
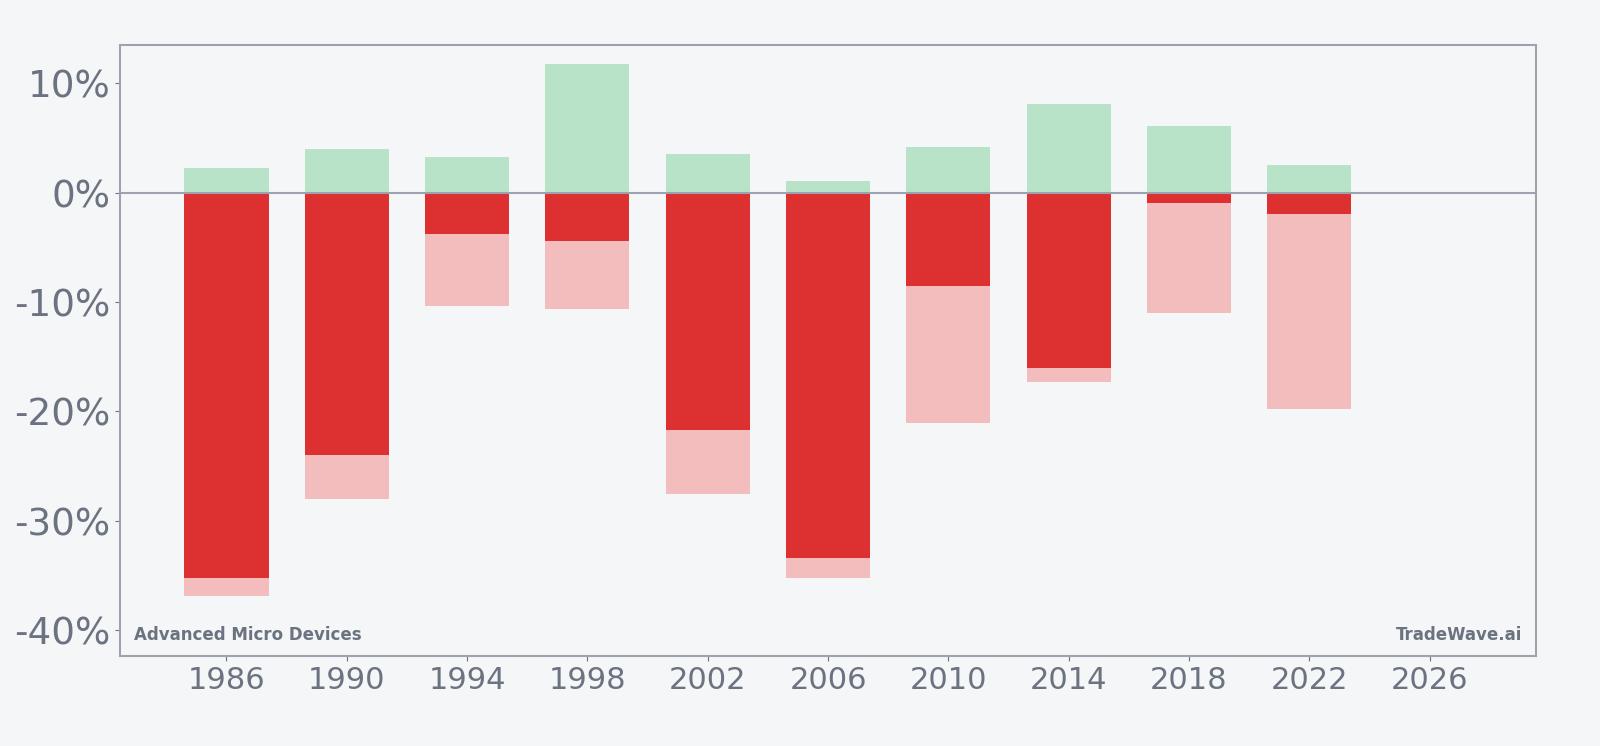
The combined net, best-case and worst-case bars show a consistent pattern: in every midterm-year sample, AMD has spent time meaningfully below the entry price, with maximum favorable moves for the short often exceeding 20%, while maximum adverse moves against the short have generally been contained to the low double digits. That mix of sizable downside potential and manageable countertrend spikes is what lifts the TradeWave Ratio to 2.17 and supports a Sharpe ratio above 1.0 for this short pattern.
History does not guarantee future results; adverse excursions can still be large in individual years, and MAE has reached more than 30% in some past windows even when the short ultimately finished profitable.
Why does Advanced Micro Devices (AMD) follow this seasonal pattern?
One likely driver is the way AMD’s earnings calendar and guidance updates cluster around midyear, which can trigger sharp repricing in high-expectation AI and data center stories. Analysts have also pointed to midterm election years as periods when policy and regulatory uncertainty around chips, export controls and China demand can weigh on semiconductor sentiment. This 40-day window may reflect a recurring phase when investors reset positioning in growth-heavy chip names after early-year optimism collides with more cautious macro and policy headlines.
What is driving Advanced Micro Devices (AMD) today?
AMD closed Jun 3 at $521.54, up 2.24% on the day, leaving the stock about 1.1% below its 52-week high of $527.20 after a powerful run that has seen shares jump 41.49% over the past month.[13] The move caps a stretch in which first-quarter 2026 results blew past expectations, with revenue rising 38% year over year to $10.25 billion and net income nearly doubling to $1.38 billion on surging AI and data center demand.[13] Barron’s and Yahoo Finance both reported that the stock spiked as much as 18.6% on May 7 after the earnings release and upbeat guidance, underscoring how central AMD has become to the AI infrastructure trade.[7][13]
Options traders were already leaning into that upside narrative ahead of the May 5 report, with weekly contracts pricing a nearly 9% post-earnings move and skewed toward bullish participation.[6] That positioning helped fuel a squeeze once the numbers hit, as investors scrambled to adjust to stronger-than-expected AI GPU and CPU demand and a still-tight competitive race with Nvidia in data center accelerators.[7][13] The result is a stock that sits near the top of its 12-month range, trading well above its 50-day moving average of $334.24 and supported by heavy interest from growth and AI-focused funds.[13]
Sector-wide, the story remains the same: multiple reports highlight accelerating AI infrastructure and data center spending as the primary growth engine for AMD’s revenue and profits, with potential tailwinds from any resumption of China AI shipments in the coming years.[2][13] That macro and sector backdrop has kept investors comfortable paying up for AMD’s growth profile, even as the stock’s volatility spikes around earnings and product milestones.
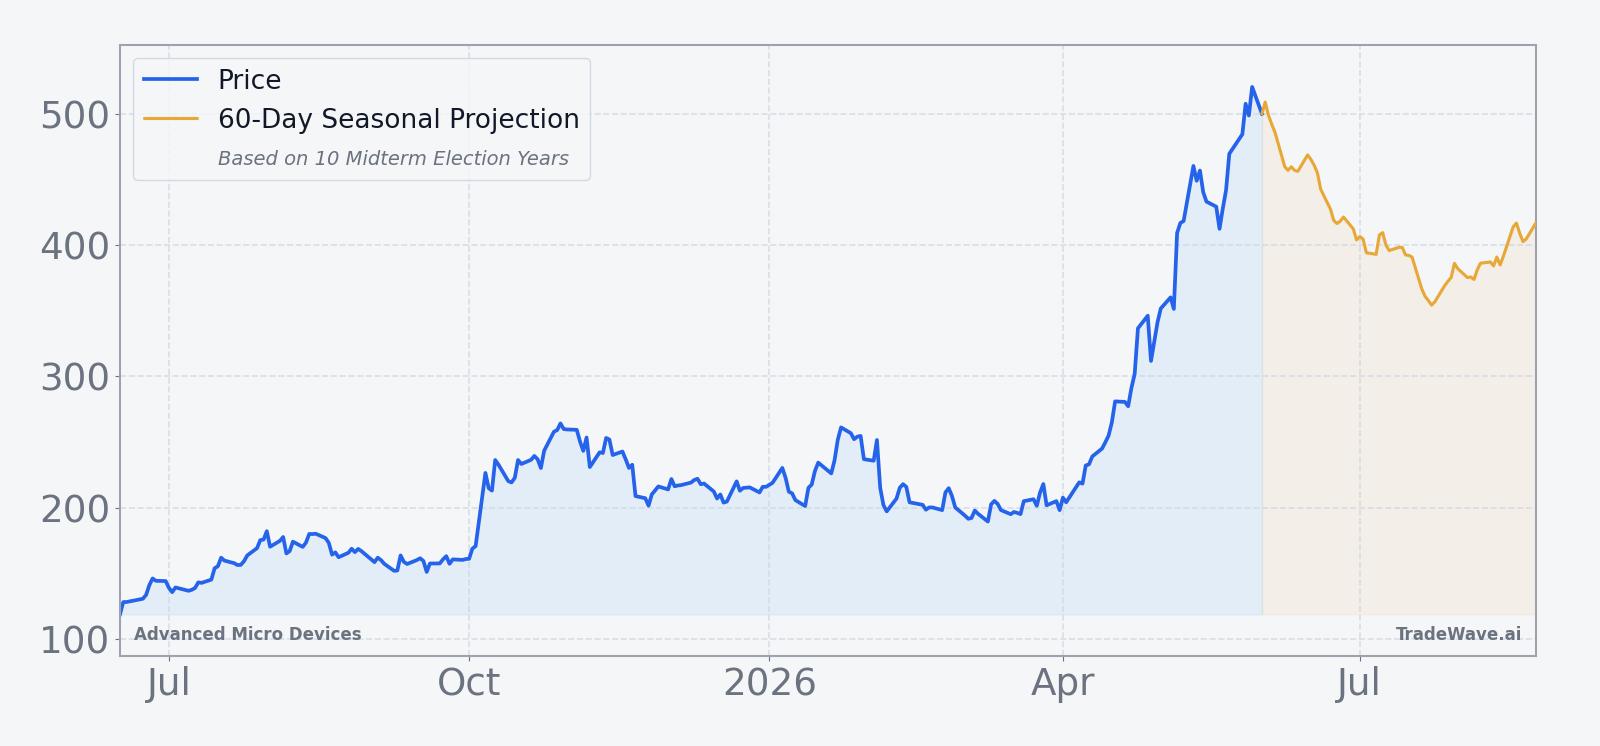
The chart below situates the latest surge against AMD’s past year of trading and overlays a 60-day seasonal projection for context.
What should traders watch as this AMD seasonal window approaches?
First, the calendar: the 40-day midterm-year window starts on Jun 15, so any shift from relentless dip-buying to more two-way trade in AMD around that date would be consistent with the historical pattern. Second, levels: traders will be watching whether the stock can hold above the recent breakout zone near the low $500s or whether a break back toward the 50-day moving average would signal that the typical midyear cooling phase is taking hold.[13]
Third, options and volume: ahead of the last earnings report, weekly options priced a nearly 9% move and skewed bullish, helping to turbocharge the upside once results landed.[6] If, as this seasonal window opens, options markets again price large swings but with more balanced or even downside-tilted positioning, that would mark a notable shift from the pre-earnings setup and could align more closely with the historical short-friendly pattern.[6]
Finally, macro and policy headlines will matter. Any fresh noise around export controls, China AI demand or broader tech regulation in this midterm election year could interact with AMD’s elevated valuation and the historically weak seasonal stretch to produce sharper swings than a typical summer lull.[2][13] For a stock that has become a key driver of AI and semiconductor sentiment, how AMD behaves inside this 40-day window will be an important tell for whether the market is ready to digest gains or keep pressing the accelerator.
Sources
- [1] Barchart, “Can AMD Stock Hit $210 In 2025?” (Jul 31, 2025).
- [2] Yahoo Finance (Insider Monkey), “AMD Reports August 5—Analyst Sees Q3 Upside and CPU Market Gains” (Jul 31, 2025).
- [3] The Motley Fool, “AMD Stock Slips Despite 30% Earnings Growth and Stronger-Than-Expected Guidance” (Nov 4, 2025).
- [6] Seeking Alpha, “AMD options traders price ~9% post-earnings move” (May 5, 2026).
- [7] Barron’s, “AMD Stock Jumps on Solid Earnings” (May 5, 2026).
- [8] Forbes, “Advanced Micro Devices Stock Could Make Quick Comeback” (Jan 8, 2026).
- [13] Yahoo Finance (GuruFocus), “AMD Jumps on AI Surge, Profit Nearly Doubles” (May 7, 2026).
About this seasonal analysis
Seasonal pattern data is sourced from TradeWave.ai, which analyzes historical price behavior across annual calendar windows going back up to 30 years. Read the full data methodology or the book The 100-Year Pattern by Afshin Moshrefi (2026 edition). Past performance of seasonal patterns does not guarantee future results. This article is for informational purposes only and does not constitute investment advice.