This 26-Day Midterm Window Has Favored 3.98% Short-Side Profits in KeyCorp (KEY)
KeyCorp is heading toward a midterm-election-year seasonal window that has usually favored downside moves, just as the stock trades near the upper end of its recent range.

What is the seasonal pattern for KeyCorp (KEY)?
KeyCorp has moved lower in 8 of the last 10 midterm-election-year windows starting around Jun 8, with average gains of 3.98% in winning short trades.
- 8 for 10 in this window, with short trades averaging 3.98% gains in winning years.
- Seasonal setup is a 26-day window starting Jun 8 in midterm election years, aligned with a short trade direction.
- Percent Profitable is 80%, with 8 winners and 2 losers across the last 10 comparable cycles.
- Including all years, Avg Profit - All is 4%, reflecting that losing years have been relatively small versus winners.
- TradeWave Ratio (TWR) of 1.56 points to meaningful intraperiod moves in the trade direction, while a Sharpe ratio of 1.1 shows solid risk-adjusted results.
- Individual years have seen adverse excursions of more than 10%, so drawdowns can be sharp even when the pattern finishes profitably.
According to historical data from TradeWave.ai, this mid-June window for KeyCorp has behaved very differently from an average month on the calendar. The next section looks at how that election-cycle pattern has played out in prior midterm years.
How has KeyCorp (KEY) traded in this midterm-year June window?
KeyCorp has moved lower in 8 of the last 10 midterm-election-year windows that begin around Jun 8 and run for 26 trading days, with short trades averaging 3.98% gains when they work. Shares closed Tuesday at 21.21, up 1.5% on the day and sitting between a 52-week high of 22.45 and a 52-week low of 14.23, leaving the stock about 5.5% below its high and 49.1% above its low based on recent price data.
Because this pattern is grouped by the presidential election cycle, it only looks at midterm election years, not every calendar year. That matters for banks like KeyCorp, since midterm years often coincide with shifting policy debates on regulation, capital standards and fiscal spending that can change how regional lenders trade around the summer.
Historically, the trade direction for this window has been short, meaning the pattern is defined by years when KeyCorp drifted lower or sold off during the 26-day stretch. Across the last 10 midterm-election-year samples, 8 of those short trades finished profitable, while 2 ended as losing years. Average profit in the winning years is 3.98%, and when every year is included, the all-years average comes in at 4%, which tells you the losers have been relatively modest compared with the winners.
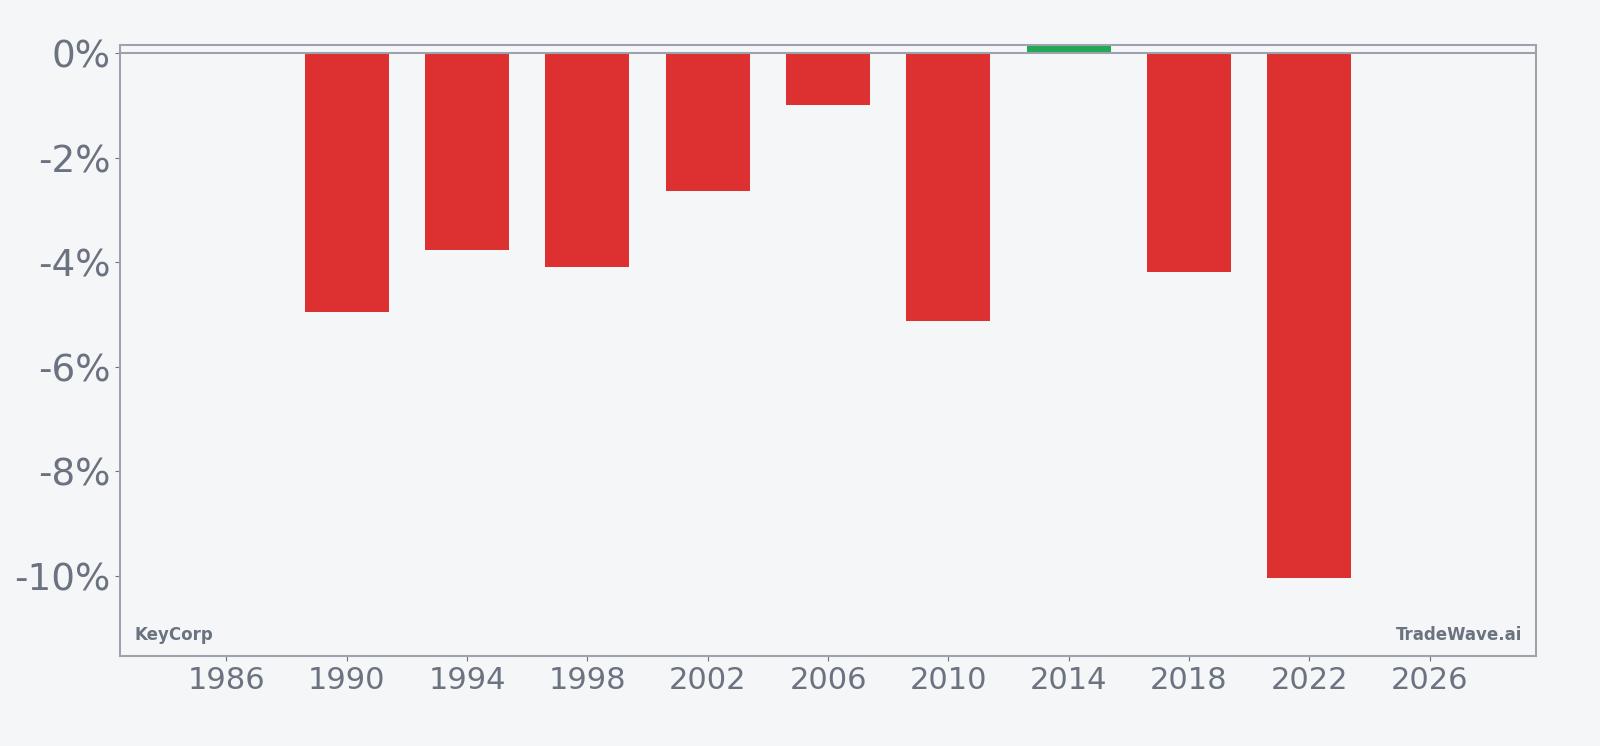
The per-year table shows that 2022 was the strongest year for the pattern, with a net return of -10.04% for the stock and a worst intraperiod drawdown of -13.61% from the entry price, which would have been a very favorable outcome for a short. On the other side, 2014 stands out as a flat to slightly losing year for shorts, with a small positive net return of 0.14% for the stock and a maximum adverse move of -3.52% against the trade. That mix of one big win, several mid-sized wins and a couple of small setbacks is what produces the 80% success rate.
The historical seasonal average trend for this window slopes gently lower, with most of the downside accruing in the middle of the period rather than at the open or close. That suggests the typical pattern has been a slow grind lower rather than a single shock day, even in years like 2010 and 2022 when the final move was sizable.
A second view that stacks net results with best and worst intraperiod moves shows how much room KeyCorp has historically had to run inside this window.
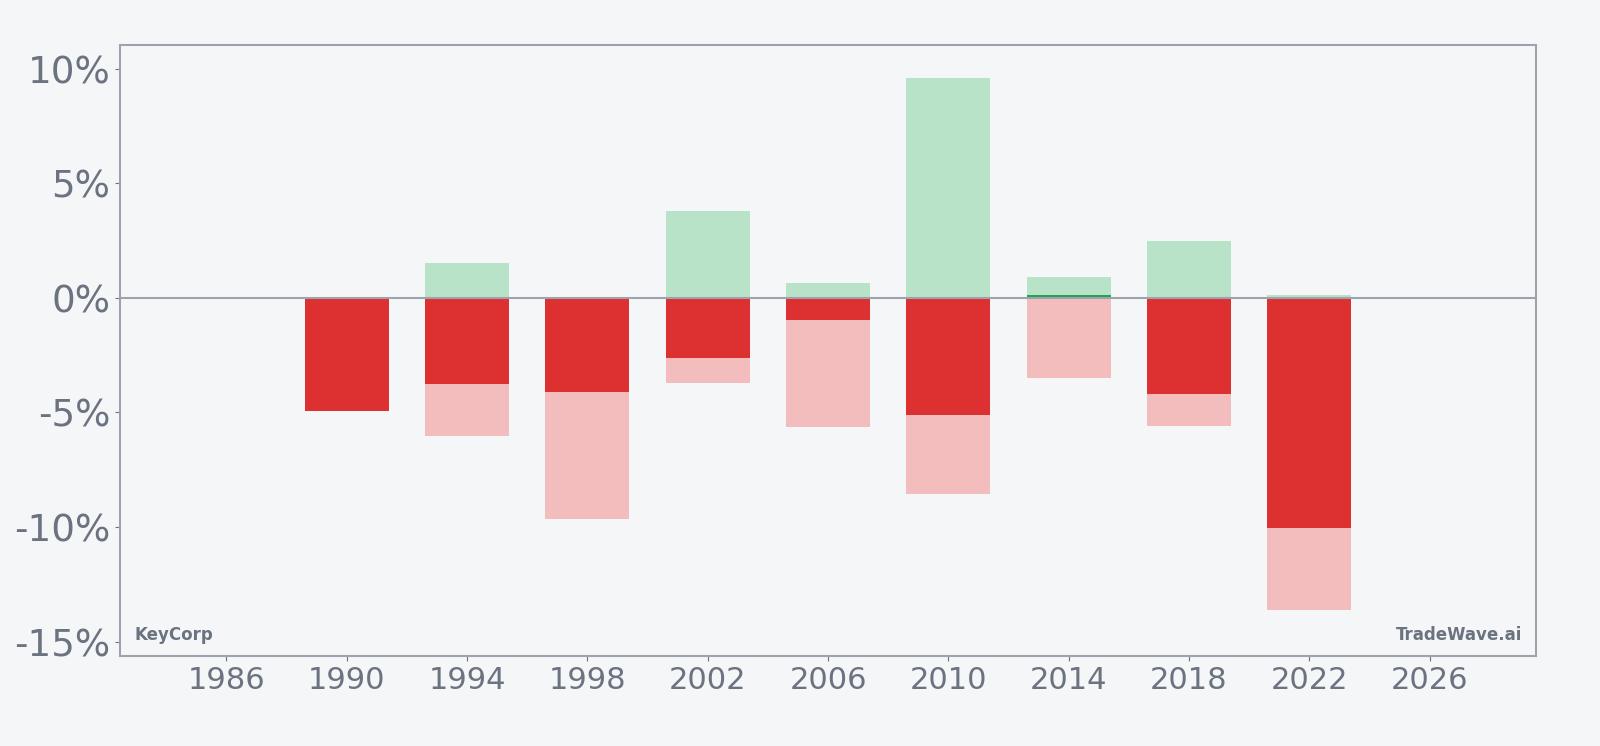
The stacked net, maximum favorable excursion and maximum adverse excursion bars show that even in winning years, KeyCorp has often swung several percentage points in both directions before the window closed. In 2010, for example, the stock’s best intraperiod move was a 9.6% rally from the entry level, yet it still finished the window down 5.12%, which would have been a strong year for the short pattern. That combination of large favorable and large adverse excursions is what the TradeWave Ratio of 1.56 is flagging: this is a window where the stock tends to travel meaningfully in the trade direction, but not in a straight line.
History does not guarantee future results; adverse excursions can be large even in winning windows, and traders can experience significant drawdowns before a pattern plays out.
Why does KeyCorp (KEY) follow this seasonal pattern?
One likely driver is the way midterm election years cluster regulatory and policy headlines for banks into the late spring and early summer. Analysts have pointed to periods like this as times when regional lenders face renewed scrutiny on credit quality, capital and stress-test outcomes, which can weigh on sentiment even without stock-specific news. This pattern may also reflect institutional portfolio repositioning ahead of the second half, as managers rebalance financials exposure while they wait for clearer signals on the rate path and loan growth.
What is driving KeyCorp (KEY) today?
KeyCorp closed Tuesday at 21.21, up 0.31 on the session for a 1.5% gain, with intraday trading between 20.58 and 21.28 on volume of about 8.8 million shares. That leaves the stock modestly below its 52-week high of 22.45 and well above its 52-week low of 14.23, while the 50-day moving average sits at 20.83 and 20-day average volume is roughly 10.8 million shares, suggesting liquidity is ample as the seasonal window approaches.
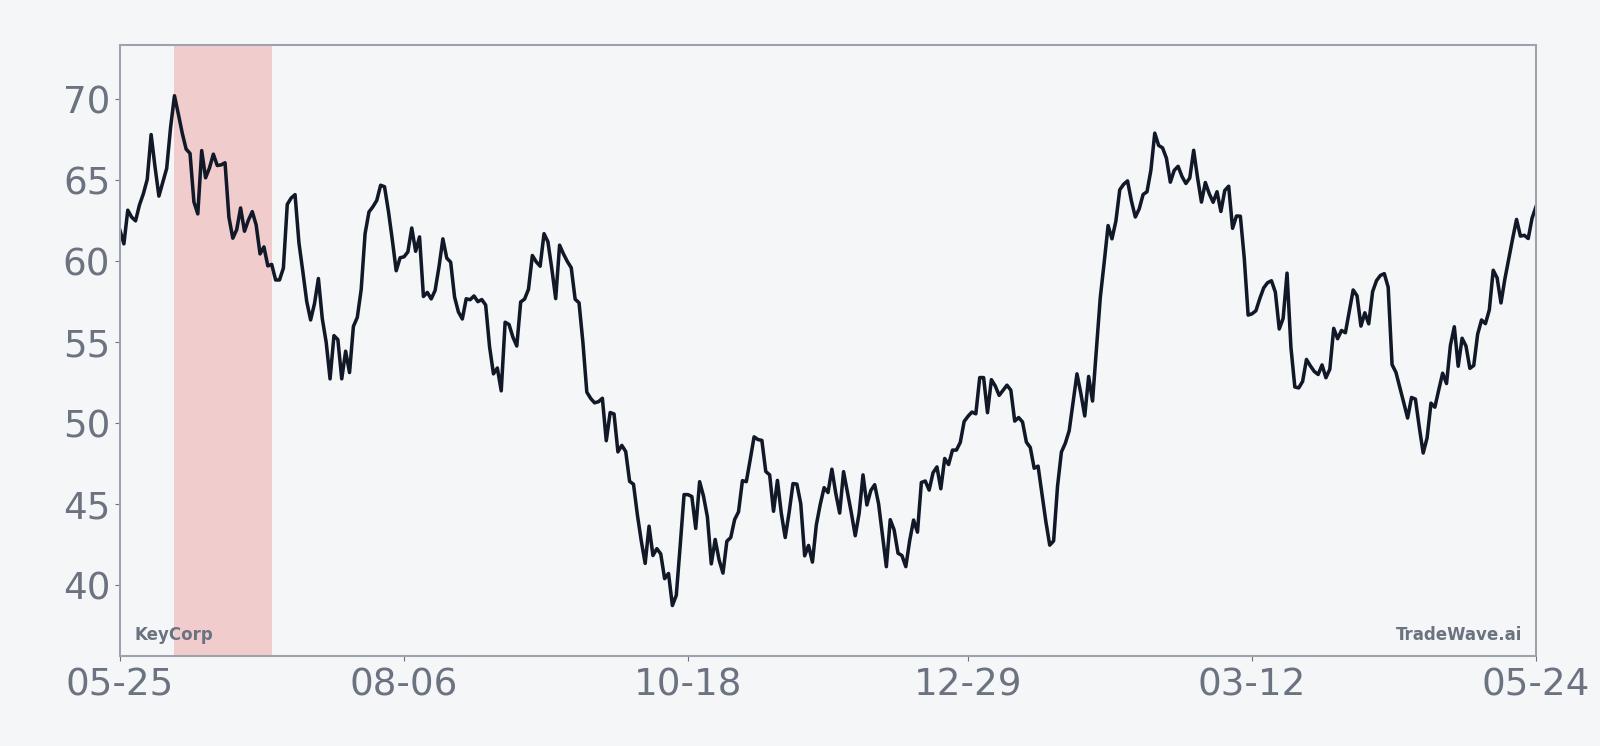
The chart below situates the latest move in its recent multi-month context and overlays the upcoming seasonal projection.
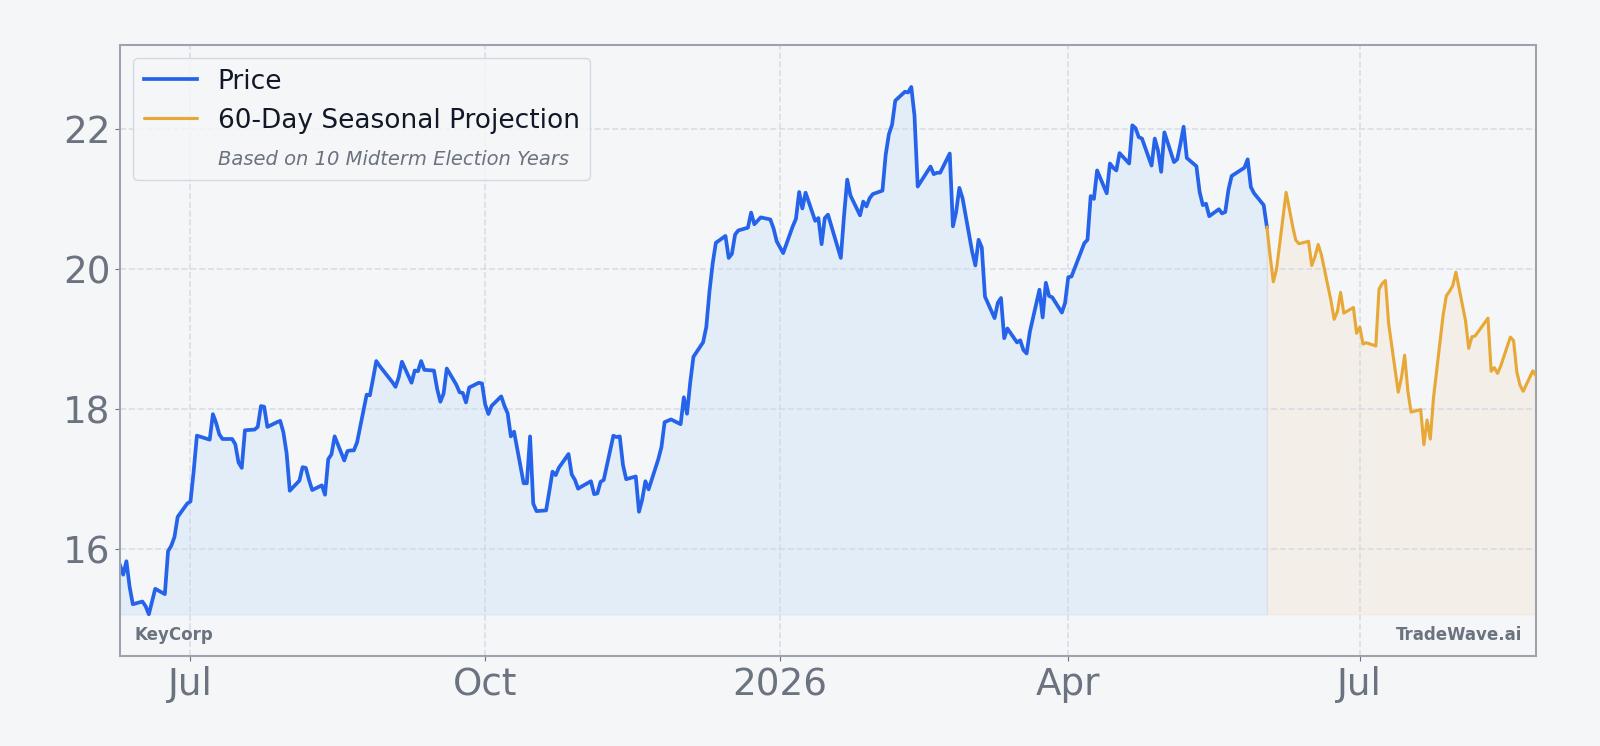
From a broader perspective, KeyCorp has been trading in the upper half of its 12-month range, with a one-month return of -0.27% that masks a choppy path around the 21 level. The 50-day moving average just below spot price shows the stock has been grinding higher in recent weeks, which makes the historically bearish midterm-year June window a notable contrast. For traders focused on bank seasonality and election-cycle behavior, the setup is a reminder that even steady uptrends can run into calendar-driven pockets of volatility.
What should traders watch as this KeyCorp window opens?
First, the calendar: the 26-day midterm-year window begins on Jun 8, so price action in the days immediately before and after that date will show whether KeyCorp respects its usual seasonal rhythm or shrugs it off. Second, levels: the 22.45 area that marks the 52-week high is the obvious upside reference, while the 50-day moving average near 20.83 is the first line of support that has mattered in recent trading.
Third, behavior inside the window will matter as much as the final outcome. In prior cycles, some of the best short years still saw sharp rallies early in the period before the stock rolled over, which is why maximum adverse excursions have been sizable even when the pattern finished profitable. If this year’s window features a similar intraperiod squeeze followed by a fade, it would fit the historical template; a clean breakout above the 52-week high that holds through the full 26 days would be a clear break from the usual pattern.
Finally, traders should keep one eye on the policy calendar. As the midterm election year moves through its middle months, any fresh headlines on bank regulation, capital rules or credit quality could amplify the moves that this seasonal window has historically produced. Add it up: a stock near the top of its range, a midterm-year backdrop and a window that has favored shorts in 8 of 10 cycles is a combination that deserves attention, even if history only ever offers probabilities, not promises.
Sources
About this seasonal analysis
Seasonal pattern data is sourced from TradeWave.ai, which analyzes historical price behavior across annual calendar windows going back up to 30 years. Read the full data methodology or the book The 100-Year Pattern by Afshin Moshrefi (2026 edition). Past performance of seasonal patterns does not guarantee future results. This article is for informational purposes only and does not constitute investment advice.