Valero Energy (VLO) Has Dropped in 9 of 10 Midterm June Windows Starting Jun 3
Valero Energy is heading into an 8-day midterm-election-year seasonal window that has usually meant short-term downside, even as the stock trades near record highs and refining margins stay firm.

What is the seasonal pattern for Valero Energy (VLO)?
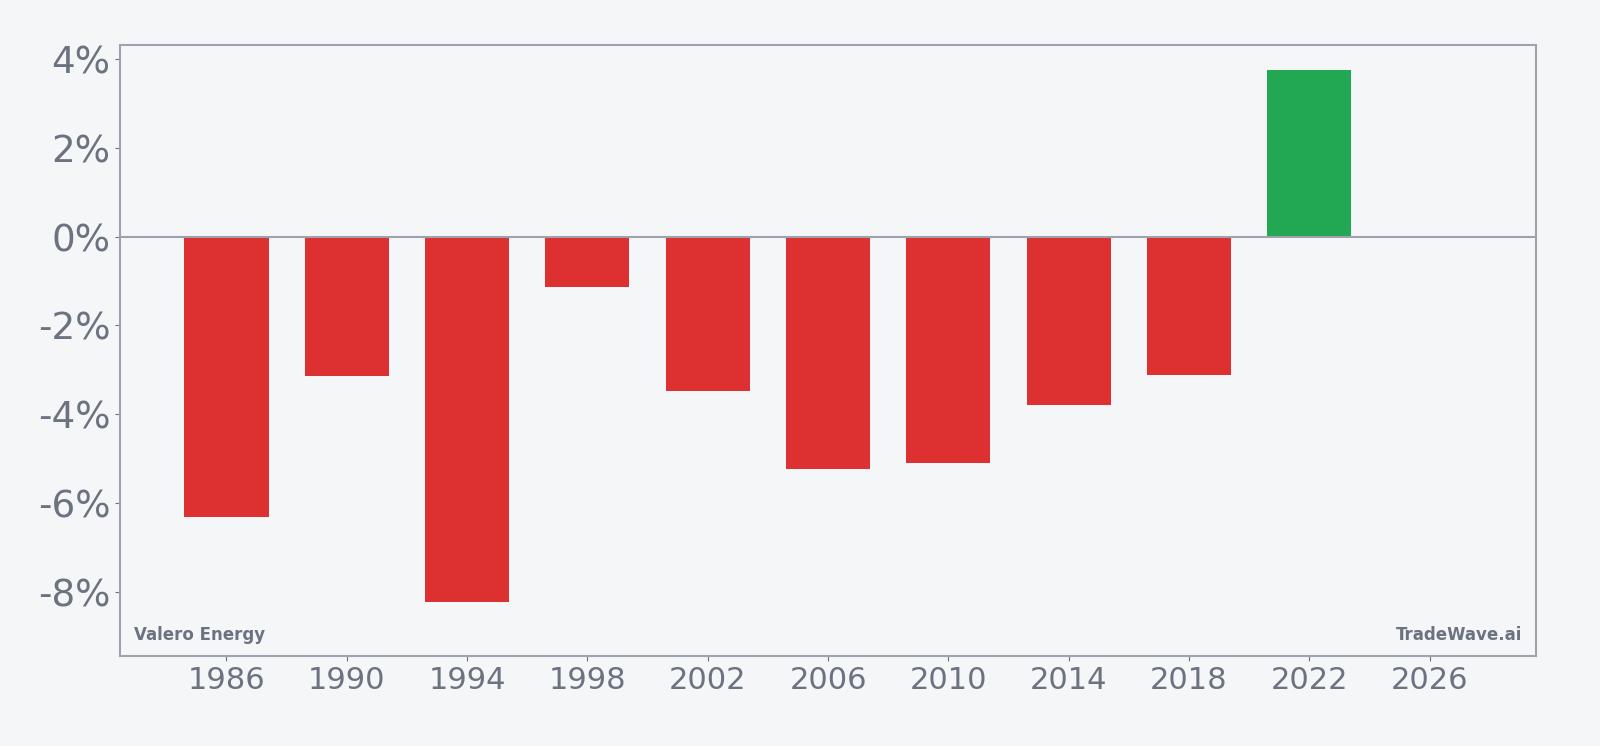
Valero Energy has fallen in 9 of 10 midterm-election-year June windows starting Jun 3, with an average 4.4% gain for winning short trades in those years.
- 9 for 10 in this window, with short trades averaging 4.4% gains in winning years across the last 10 midterm election cycles.
- The upcoming pattern runs for 8 trading days starting Jun 3 and has historically favored downside moves in Valero Energy.
- Percent Profitable is 90%, with 9 winners and 1 loser for the short-side setup in this specific Valero Energy trading window.
- Average profit across all years, including the losing one, is 4%, showing that down years have not erased the seasonal edge.
- Intraperiod swings have been meaningful, with some years showing sharp adverse moves before the pattern ultimately worked for shorts.
- The setup aligns with a midterm-election-year seasonal outlook for refiners, where policy and demand uncertainty often drive short bursts of volatility.
According to historical data from TradeWave.ai, this early-June stretch has behaved very differently from an average month for Valero Energy in past midterm election years.
How has Valero Energy (VLO) traded in this early-June midterm window?
Valero Energy has dropped in 9 of the last 10 midterm-election-year windows that begin on Jun 3 and run for 8 trading days, with short trades averaging 4.4% gains when they worked. Shares finished Monday at $244.82, down fractionally on the day and sitting about 6.3% below their 52-week high of $261.26.[1] That combination of a strong longer-term uptrend and a historically weak short window is what makes this year’s setup stand out for a stock that has been a beneficiary of robust refining margins.[2]
Grouping the data by the presidential election cycle matters here because this pattern only looks at the last 10 midterm election years, a phase that often brings policy uncertainty and choppy trading for economically sensitive sectors like energy. In this context, the short-side bias in early June stands out as a recurring feature of Valero Energy’s seasonal trend rather than a one-off quirk.
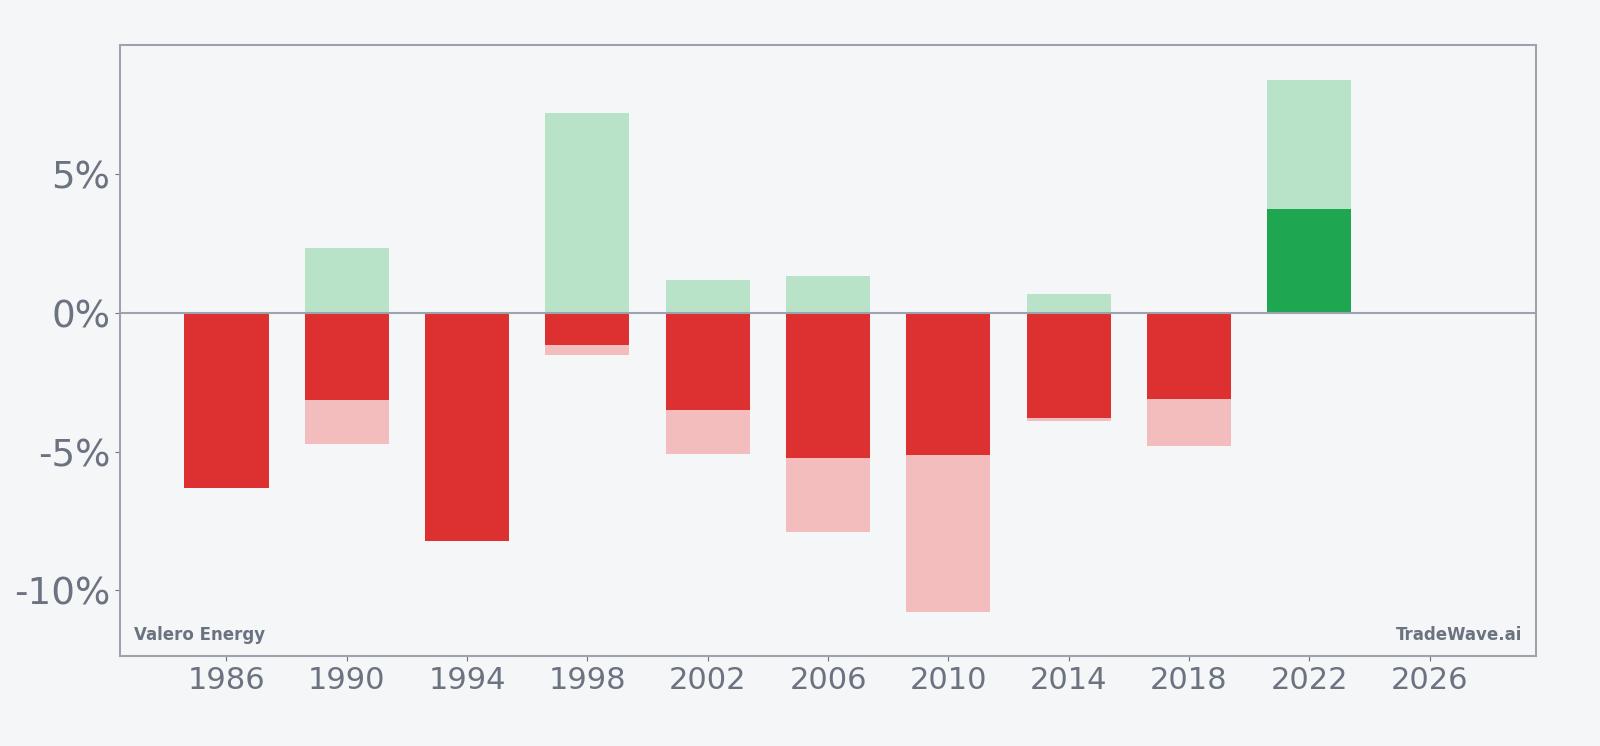
Year-by-year net returns, along with best and worst intraperiod swings, show how often the short pattern has worked and how bumpy the ride has been.
Across the 10 midterm-election-year samples, 9 years delivered profits for the short-side setup and only 1 year produced a loss, giving a 90% Percent Profitable reading with 9 winners and 1 loser. Average profit in winning years is 4.4%, while the average across all years, including the losing one, is still a solid 4%, which suggests that the lone outlier did not fully offset the broader pattern.
The per-year table shows that 1994 was the strongest year for shorts, with Valero Energy falling 8.23% during the window, while 2022 was the clear outlier, with the stock rising 3.76% and turning the short trade into a loser. In several of the winning years, such as 2006 and 2010, the maximum adverse move from entry was larger than the final net gain, which means shorts had to sit through meaningful rallies before the pattern resolved lower.
Looking at the maximum favorable move and maximum adverse move, or MFE and MAE, the historical profile points to a window that can move quickly in both directions. Years like 1998 and 2022 saw MFEs above 7% and 8% respectively, while 2010 posted an MAE of 10.77%, underscoring that even in a generally favorable short window, intraperiod drawdowns have sometimes been steep.
The seasonal trend chart suggests that, on average, the bulk of the move in successful years has tended to occur in the middle of the 8-day stretch rather than in a straight line from day one. The cumulative return curve slopes lower across the window, but with enough noise that timing inside the window has mattered almost as much as direction.
Put together, the message is simple: nine for ten is a strong record for a short-side seasonal pattern, but the path has often been volatile and the 2022 outlier shows that a powerful uptrend can still overwhelm the window in a given year.
Why does Valero Energy (VLO) follow this seasonal pattern?
This early-June midterm-year pattern may reflect a mix of sector rotation and macro positioning around summer driving season and policy headlines. One likely driver is that refiners often see expectations reset after spring maintenance and ahead of peak demand, which can trigger short bursts of profit-taking in strong stocks. Analysts have also pointed to midterm-year policy uncertainty around energy regulation and fuel standards as a catalyst for brief risk-off episodes in the refining group.
History does not guarantee future results; adverse excursions can be large even in winning windows, and a strong underlying trend can still overpower the seasonal tendency in any single year.
What is driving Valero Energy (VLO) today?
Valero Energy slipped 0.01% on Monday to close at $244.82, leaving the stock about 6.3% below its 52-week high of $261.26 and more than double its 52-week low of $118.94.[1] The stock has been supported by a run of strong earnings through late 2025 and early 2026, with the company beating profit estimates in the second and third quarters of 2025 and again in the fourth quarter on the back of stronger refining margins and higher throughput volumes.[2][3][4]
In Q4 2025, reported on Jan 29, 2026, Valero posted adjusted earnings of $3.82 per share versus analyst expectations of $3.27, helped by a rebound in margins and robust utilization across its Gulf Coast system.[4] Earlier in 2025, the refiner had already surprised to the upside, with Q2 profit of $2.28 per share versus a $1.74 estimate and Q3 adjusted EPS of $3.66 versus $3.05, reinforcing the narrative that complex refiners have been key winners from tight product markets and favorable crude spreads.[2][3]
Sector analysts have highlighted that potential rebuilding of Venezuela’s oil sector and increased flows of heavy sour crude into the U.S. Gulf Coast could further benefit Valero, which is configured to run those barrels and capture wider discounts.[5] At the same time, the company has been returning significant cash to shareholders, declaring a quarterly dividend of $1.13 per share and distributing $1.3 billion via dividends and buybacks in the third quarter of 2025, which has added a capital-return angle to the stock’s appeal.[1]
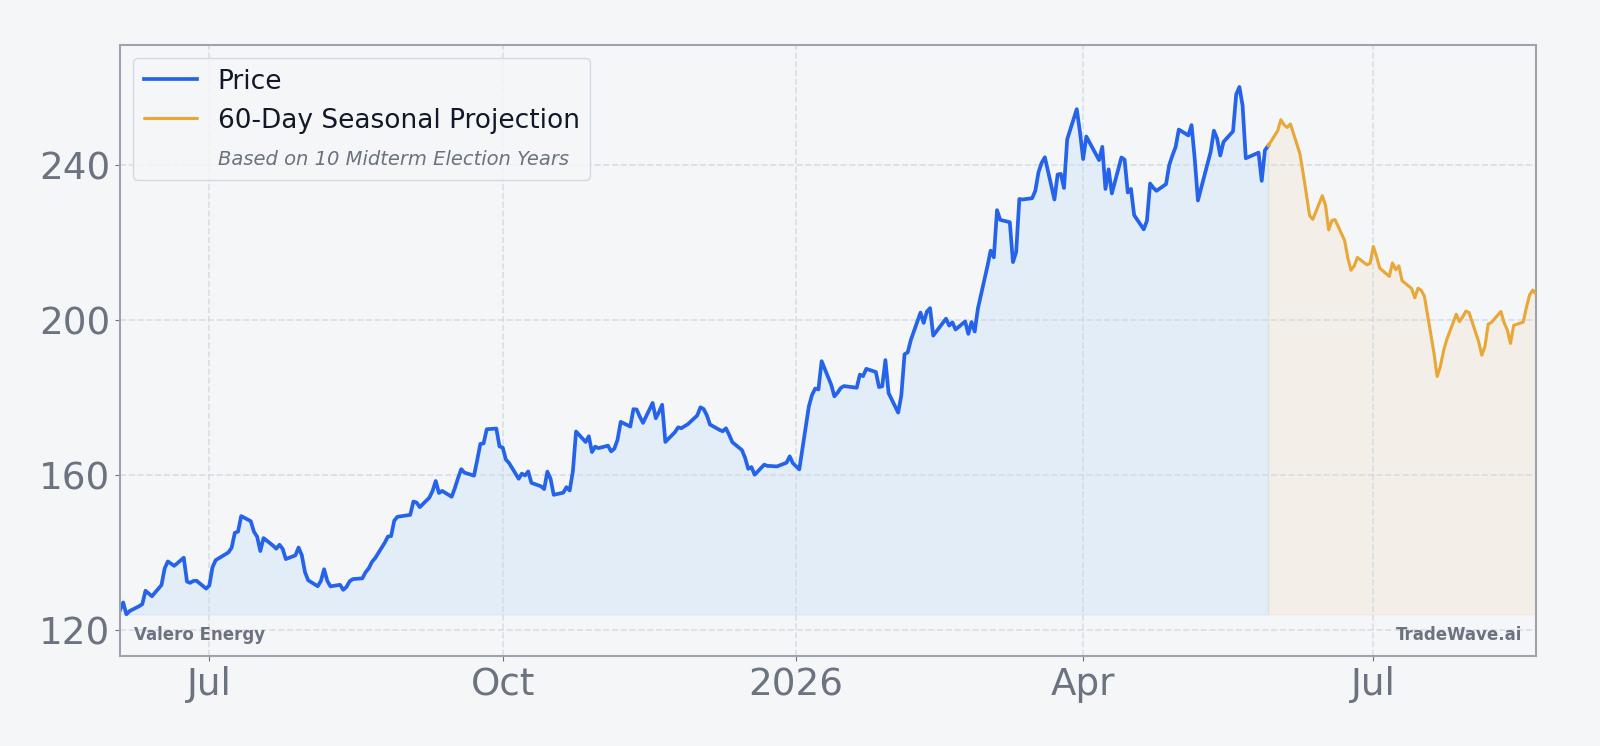
The chart below situates the latest move in its recent multi-month context, alongside a 60-day seasonal projection.
What should traders watch in this upcoming window?
For the 8-day stretch starting Jun 3, the key test will be whether Valero Energy respects its historical tendency to soften in midterm-election-year early June or whether the strong fundamental backdrop keeps the bid intact. Price action around the $240 to $250 band, which has been an active trading zone in recent weeks, will be important for gauging whether any seasonal weakness is just a shallow pause or something sharper.
Macro-wise, traders will be watching gasoline demand data and any fresh headlines on Venezuelan supply or U.S. refining policy, since both can quickly shift expectations for margins and throughput.[5][6] A pattern-consistent move would likely show up as a drift lower or a brief air pocket during the window, while a decisive push back toward the $260 area would look more like a repeat of 2022’s outlier year for this pattern.
Volume and intraday volatility will also matter. Past earnings reactions have shown that Valero can move 2% to 3% in a single session when headlines hit, and similar bursts during this window would either reinforce or contradict the historical short bias depending on direction.[2][4] Add it up: the early-June seasonal record is clearly skewed toward shorts, but the real signal this year will come from how the stock behaves as it tests that pattern against a still-supportive refining and policy backdrop.
Sources
- [1] CNBC, “Top Wall Street analysts suggest these 3 dividend stocks for enhanced total returns” (Nov 2, 2025)
- [2] Reuters, “Valero Energy beats third-quarter profit estimates on stronger margins” (Oct 23, 2025)
- [3] Reuters, “Valero beats estimates as refining margins offset renewable diesel loss” (Jul 24, 2025)
- [4] Reuters, “Valero Energy beats quarterly estimates for profit on stronger refining margins” (Jan 29, 2026)
- [5] CNBC, “Energy stocks rise on Venezuela rebuilding potential; why one refining stock could be the big winner” (Jan 5, 2026)
About this seasonal analysis
Seasonal pattern data is sourced from TradeWave.ai, which analyzes historical price behavior across annual calendar windows going back up to 30 years. Read the full data methodology or the book The 100-Year Pattern by Afshin Moshrefi (2026 edition). Past performance of seasonal patterns does not guarantee future results. This article is for informational purposes only and does not constitute investment advice.