ON Semiconductor (ON) Q1 Loss Narrows, but Fresh 52-Week High Meets Bearish June Stretch
ON Semiconductor is trading just below a fresh 52-week high as it approaches a short June window that has historically leaned bearish for the stock.
What is the seasonal pattern for ON Semiconductor (ON)?
ON Semiconductor has fallen in 5 of 6 midterm-year June windows during this six-day pattern, with an average 6.38% gain in winning years for the short setup.
- 5 wins and 1 loss for the short setup in this window, with winning years averaging a 6.38% move in the trade direction.
- The upcoming pattern runs for 6 trading days starting Jun 4, 2026, across the last 6 midterm election years.
- Percent Profitable is 83%, with 5 winners and 1 loser for shorts in this ON Semiconductor trading window.
- Avg Profit - All, which includes both winning and losing years, is 5%, pointing to a solid bearish seasonal bias.
- Historical excursions show meaningful downside stretches within the window, even in years that ultimately finished close to flat.
- The TradeWave Ratio of 1.31 and a Sharpe ratio of 1.24 indicate a historically efficient short pattern relative to its volatility.
According to historical data from TradeWave.ai, this early-June stretch in midterm election years has behaved differently from a typical month for ON Semiconductor, and the next iteration is just weeks away.
How has ON Semiconductor (ON) traded in this midterm-year June window?
ON Semiconductor has delivered profitable short trades in 5 of the last 6 midterm-year June windows, with an average 6.38% move in the trade direction during winning years. Today the stock closed at $118.69, up 2.6% on the session and sitting about 0.3% below its 52-week high of $119.10.[4] That puts a historically bearish six-day window on the calendar just as the stock presses fresh highs.
Because this pattern is grouped by the presidential election cycle, it only looks at midterm election years, not every calendar year. That matters for semiconductors, which often feel the impact of shifting fiscal priorities, industrial policy and regulation in the middle of a presidential term, when Washington tends to pivot from stimulus to implementation.
This seasonal window begins on Jun 4, 2026 and spans six trading days. Historically, during this period ON Semiconductor has tended to drift lower, which is favorable for the short trade direction that the pattern tracks. Across the last six midterm election years, the short setup has been profitable in 83% of cases, with 5 winners and just 1 loser.
In winning years, the average move in the trade direction has been 6.38%, while including all years, winners and losers together, the average outcome is still a 5% gain for shorts. That gap between Avg Profit and Avg Profit - All shows that the single losing year did not fully erase the gains from the stronger down moves. Median profit of 4.64% suggests the typical outcome has been a moderate but meaningful slide rather than a one-off crash.
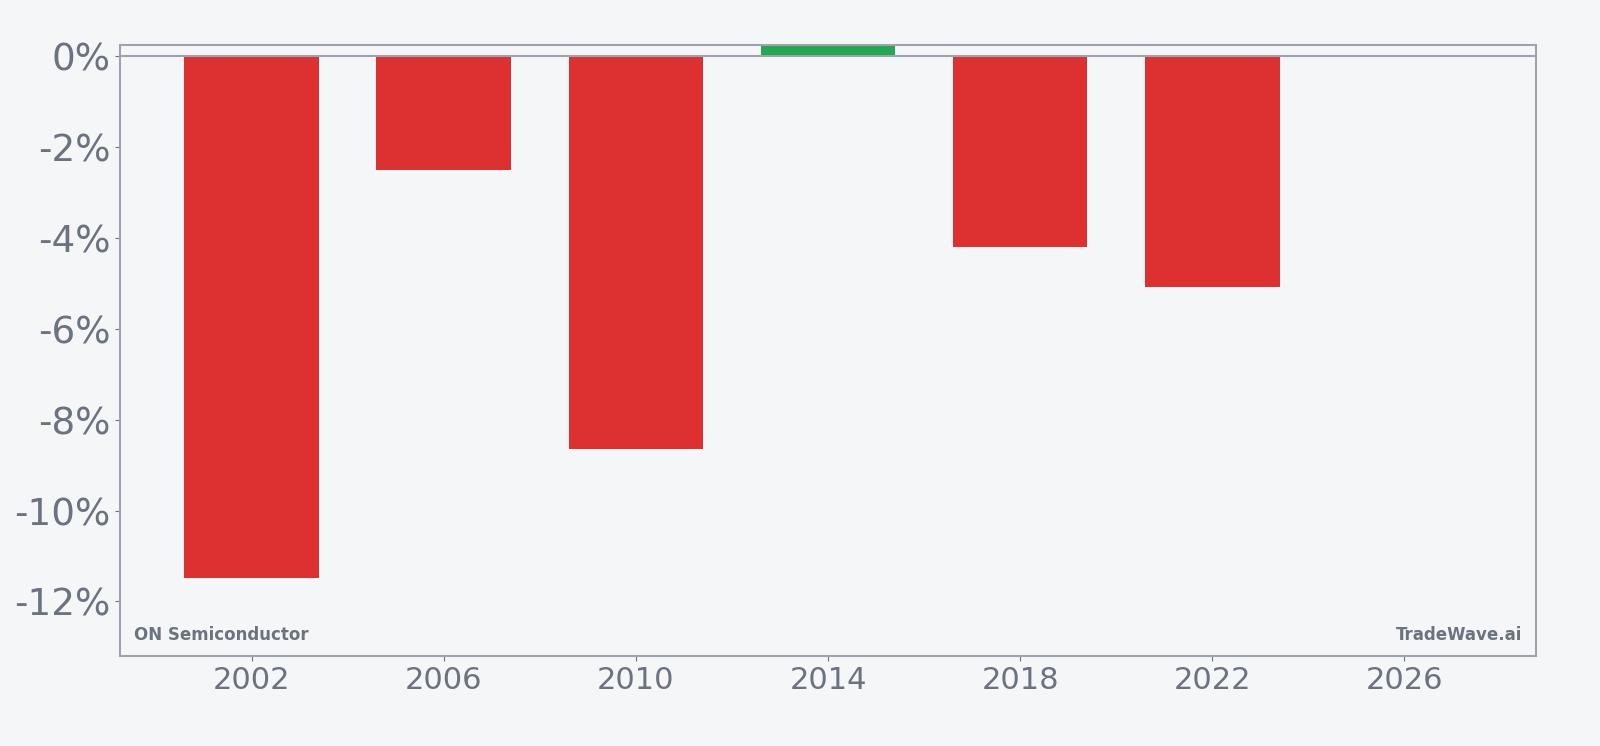
The per-year record shows how that plays out in practice. In 2002, the short setup captured an 11.49% decline over the six-day window, with the worst intraperiod drawdown from entry at 18.92% and only a 1.35% best run-up against the trade. In 2010, the pattern again worked for shorts, with an 8.64% net decline and a relatively contained 9.07% worst adverse move from the entry price.
Even the softer years still leaned in favor of the short side. In 2006, the net return for the pattern was a 2.51% decline, while 2018 delivered a 4.2% drop over the window. The lone outlier was 2014, which finished essentially flat with a 0.22% gain against the short, despite a 2.23% best move in the trade direction and a 1.79% worst drawdown from entry.
The historical seasonal average trend line for this ON seasonal pattern slopes lower across the six days, with most of the downside accruing in the middle of the window rather than at the open or close. That profile suggests that in prior midterm years, pressure has tended to build after the first day or two, rather than delivering an immediate gap move.
A second view of the same window shows how far price has typically traveled in both favorable and adverse directions within each year.
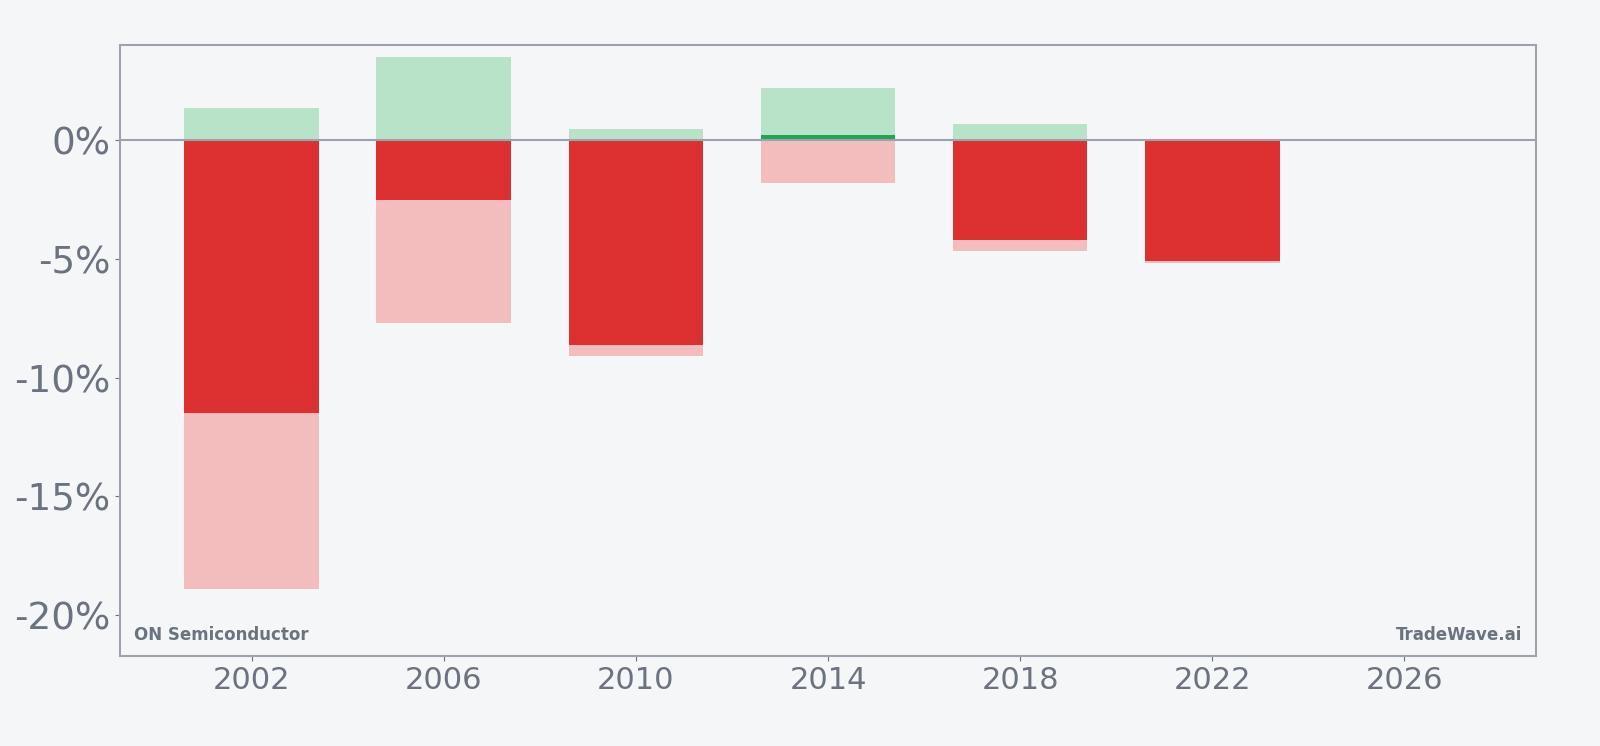
The stacked net, maximum favorable excursion and maximum adverse excursion bars show that when this window has worked for shorts, it has often done so with relatively controlled upside squeezes and deeper downside stretches. In 2002 and 2010, for example, the best point-to-peak move in favor of the short was modest, while the worst drawdown from entry stayed within the same general range as the final net decline, suggesting a fairly directional slide rather than a whipsaw.
History does not guarantee future results; adverse excursions (MAE) can be large even in winning windows.
Why does ON Semiconductor (ON) follow this seasonal pattern?
This midterm-year June pattern may reflect a mix of sector rotation and policy-driven positioning. One likely driver is that midterm years often bring clarity on industrial and chip-related regulation, prompting portfolio managers to rebalance exposure to cyclical names like ON Semiconductor around early summer. The short, six-day window could also line up with options expiration and index rebalancing flows that have historically leaned against high-flying semiconductor stocks at this point in the cycle.
What is driving ON Semiconductor (ON) today?
ON Semiconductor closed Friday at $118.69, up 2.6% on the day, after a blistering 48.09% one-month run that has carried the stock to within a fraction of its 52-week high of $119.10.[4] Trading volume of about 8.6 million shares came in below the 20-day average of roughly 13.7 million, suggesting the latest push higher is happening on lighter participation than the earlier leg of the rally.[4]
The near-term fundamental backdrop is dominated by AI demand and a gradual recovery from last year’s inventory overhang. On May 4, 2026, the company reported a narrowed first-quarter loss of $33.4 million, or 8 cents per share, with revenue supported by AI data-center orders that helped offset broader semiconductor softness.[4] Management highlighted stabilizing end markets and reiterated that AI-related revenue has been a key growth engine even as electric-vehicle demand and legacy segments remain choppy.[4]
Those numbers followed a midterm-year earnings path that has been uneven but improving. In February 2026, ON Semiconductor missed fourth-quarter revenue estimates by a small margin, which in February led to a sharp after-hours selloff as investors focused on the top-line shortfall rather than the modest EPS beat.[1][3] In August 2025 and November 2025, the company had already signaled that end markets were stabilizing and that AI-driven demand was helping to offset cyclical headwinds in autos and industrials.[2][5][13]
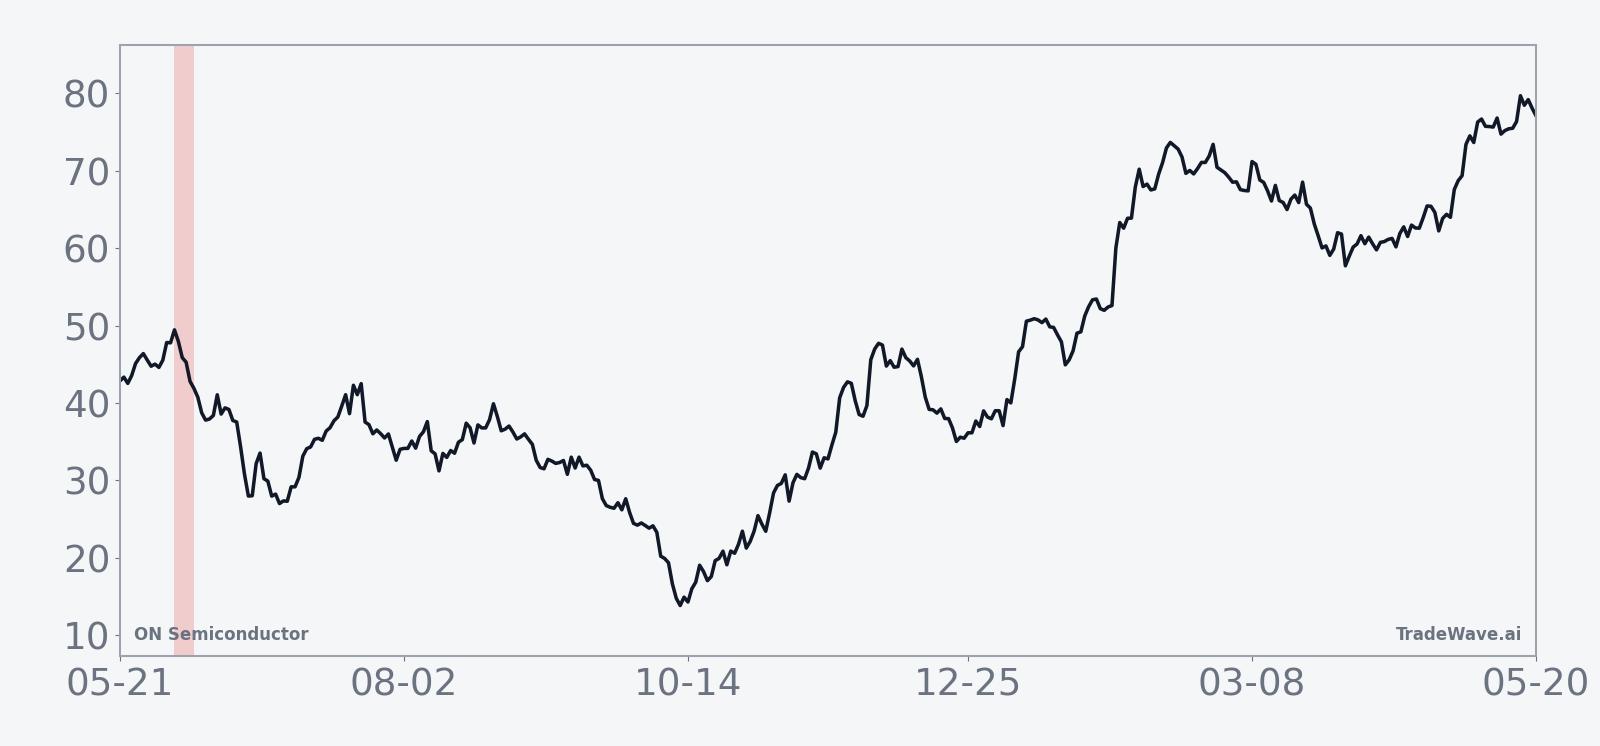
Sector-wide, the semiconductor industry is still working through the tail end of an inventory glut and a slowdown in electric-vehicle demand, even as AI infrastructure spending remains robust.[3] That mix has left ON Semiconductor trading as a hybrid story: part AI beneficiary, part cyclical chip supplier exposed to macro swings. With the stock now near its 52-week high and well above its 50-day moving average of $77.62, positioning into the early-June ON seasonal trend will likely intersect with how investors handicap that balance between AI growth and more traditional chip-cycle risk.[4]
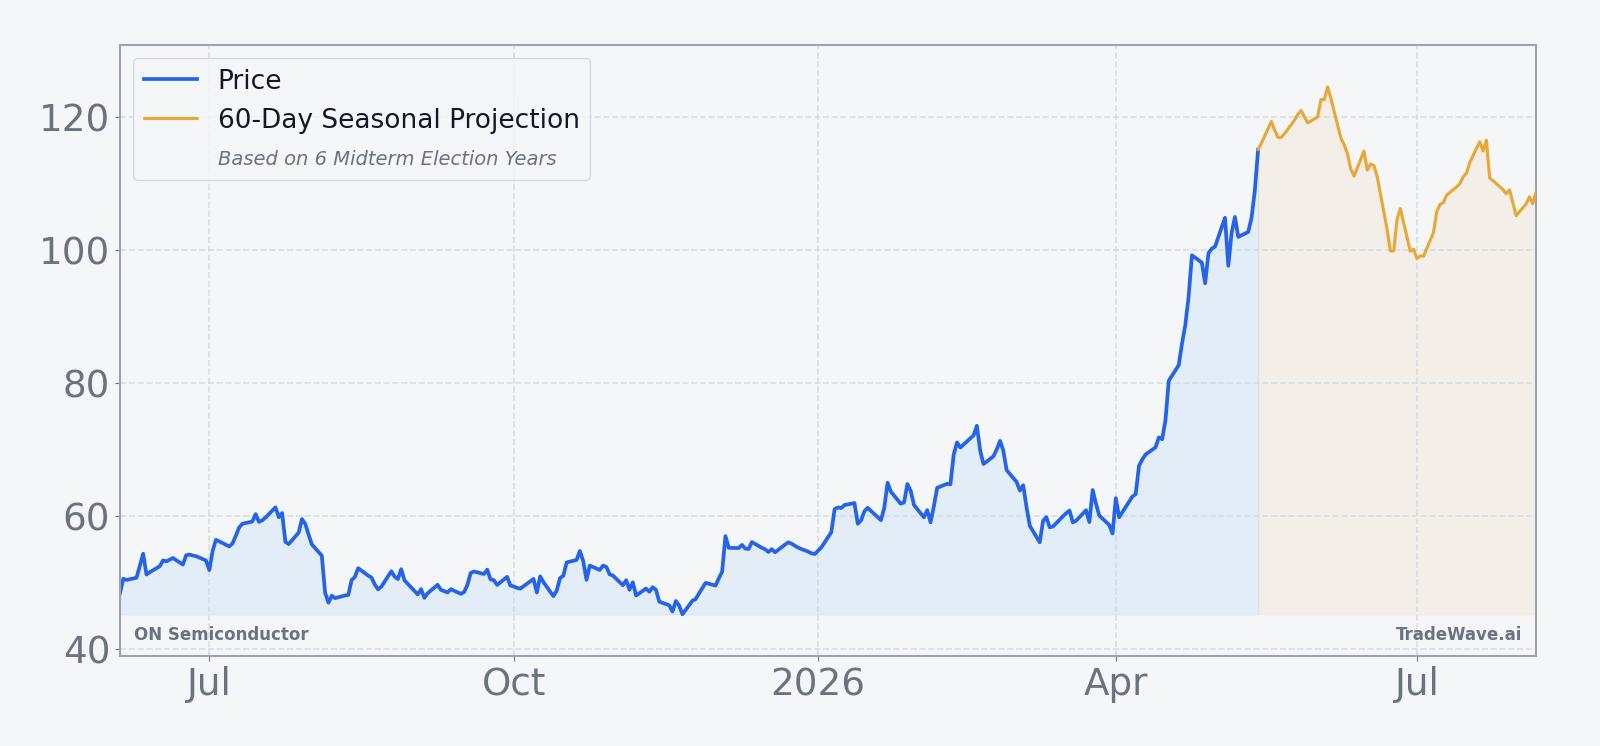
The chart below situates the latest surge against the past year of trading and a 60-day seasonal projection.
What should traders watch as this ON Semiconductor seasonal window approaches?
First, the calendar: the six-day ON Semiconductor trading window tied to midterm election years opens on Jun 4, 2026, so any shift in tone from buyers to profit-takers around that date will be notable. Price-wise, the 52-week high at $119.10 is the immediate reference; sustained closes above that level into the window would mark a clear break from the historical pattern, while a failure to hold new highs could echo prior midterm-year reversals.[4]
Second, watch how AI-related headlines and macro data intersect with the ON seasonal trend. Another strong AI data-center update or a positive read-through from peers could blunt the historical downside bias, while renewed concern about EV demand or inventory could reinforce it.[3][4] Finally, monitor volume and intraday ranges during the window: in past years, the pattern’s best short outcomes have come when downside moves developed over several sessions rather than a single gap, with maximum favorable and adverse excursions showing that the path has mattered as much as the destination.
Sources
- CNBC, "Stocks making the biggest moves after hours: ON Semiconductor, Upwork, Chegg and more" (Feb 9, 2026)
- Yahoo Finance, "Earnings live: Palantir stock rises modestly on strong results, Hims & Hers stock surges" (Nov 3, 2025)
- Reuters, "Chipmaker Onsemi misses quarterly revenue estimates, shares fall" (Feb 9, 2026)
- Wall Street Journal, "ON Semiconductor Narrows First-Quarter Loss on AI Data-Center Demand" (May 4, 2026)
- Wall Street Journal, "ON Semiconductor Results Show Stabilizing End Markets" (Aug 4, 2025)
- Reuters, "Chipmaker Onsemi beats quarterly estimates on AI-driven demand" (Nov 3, 2025)
About this seasonal analysis
Seasonal pattern data is sourced from TradeWave.ai, which analyzes historical price behavior across annual calendar windows going back up to 30 years. Read the full data methodology or the book The 100-Year Pattern by Afshin Moshrefi (2026 edition). Past performance of seasonal patterns does not guarantee future results. This article is for informational purposes only and does not constitute investment advice.