This 219-Day Midterm Window Has Delivered 495% Cumulative Gains for Merck & Co. (MRK)
Merck & Co. is heading toward a historically powerful 219-day midterm-election-year seasonal window even as the stock trades just below its 52-week high with modest year-to-date gains.

What is the seasonal pattern for Merck & Co. (MRK)?
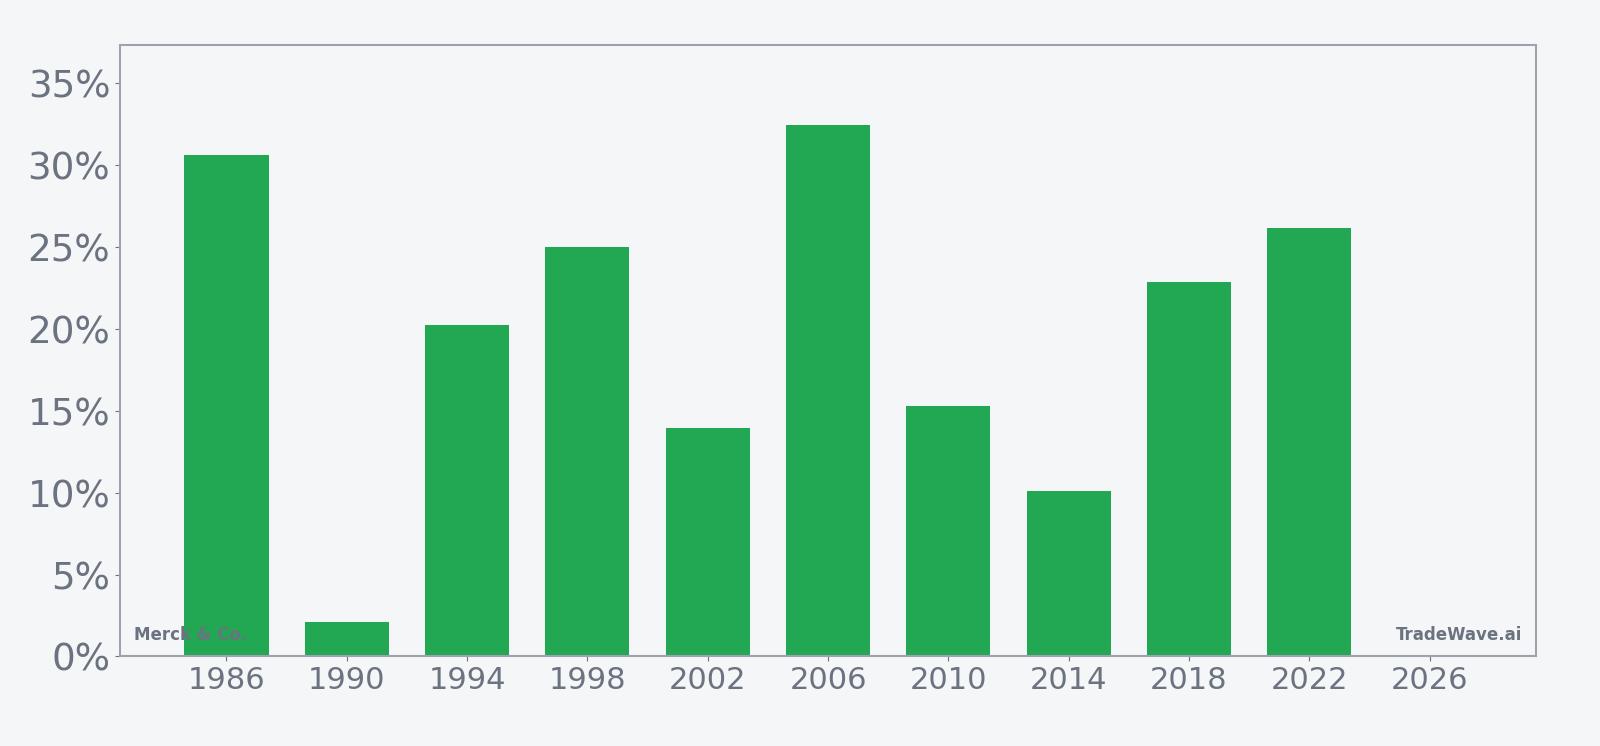
Merck & Co. has risen in 10 of 10 midterm-election-year windows starting June 6, with an average gain of 19.89% in winning years.
- 10 for 10 in this window, with average winning-year gains of 19.89% across the last 10 midterm election years.
- Seasonal window begins Jun 6 and runs 219 trading days, spanning late midterm year into the pre-election year.
- Percent Profitable is 100%, with 10 winners and 0 losers in the historical sample.
- Trade Direction is long, supported by a TradeWave Ratio of 2.17 and a Sharpe ratio of 1.84, pointing to strong risk-adjusted upside.
- Individual years have seen maximum favorable moves above 30% but also adverse swings worse than -25%, so rallies have not been straight lines.
- Cumulative return across all 10 windows totals 495%, with a median gain of 21.56%, underscoring how consistently this MRK seasonal trend has favored the bulls.
According to historical data from TradeWave.ai, this upcoming stretch for Merck & Co. behaves very differently from an average year on the calendar, with a distinct midterm-election-year profile that traders rarely see discussed.
How has Merck & Co. (MRK) traded in this midterm-year window?
Merck & Co. has posted gains in every one of the last 10 midterm-election-year windows that start around Jun 6 and run for 219 trading days, averaging 19.89% in those winning years. Today the stock closed at $119.72, down 2.2% on the session, leaving it about 3.5% below its 52-week high of $124 and up 5.6% year to date.
Because this pattern is grouped by the presidential election cycle, it reflects how MRK has behaved specifically in the midterm year as policy noise peaks and then into the year before the presidential election, when risk appetite has often improved. The trade direction is long, and across the last 10 such cycles the stock has never finished this window in the red.
Percent Profitable sits at 100%, with 10 winners and 0 losers, which is rare for a window this long. Average profit of 19.89% means that in a typical winning year, MRK has added roughly one-fifth to its value between early June of the midterm year and the end of the window, while the median gain of 21.56% shows that results have skewed toward the higher side rather than being driven by a single outlier.
The per-year table shows how broad that strength has been. The weakest outcome in this sample was 2.12% in 1990, while stronger years such as 2006 and 2022 delivered net gains of 32.47% and 26.18% respectively. Add it up and the cumulative return across all 10 windows is 495%, which is a big number for a defensive large-cap pharma name.
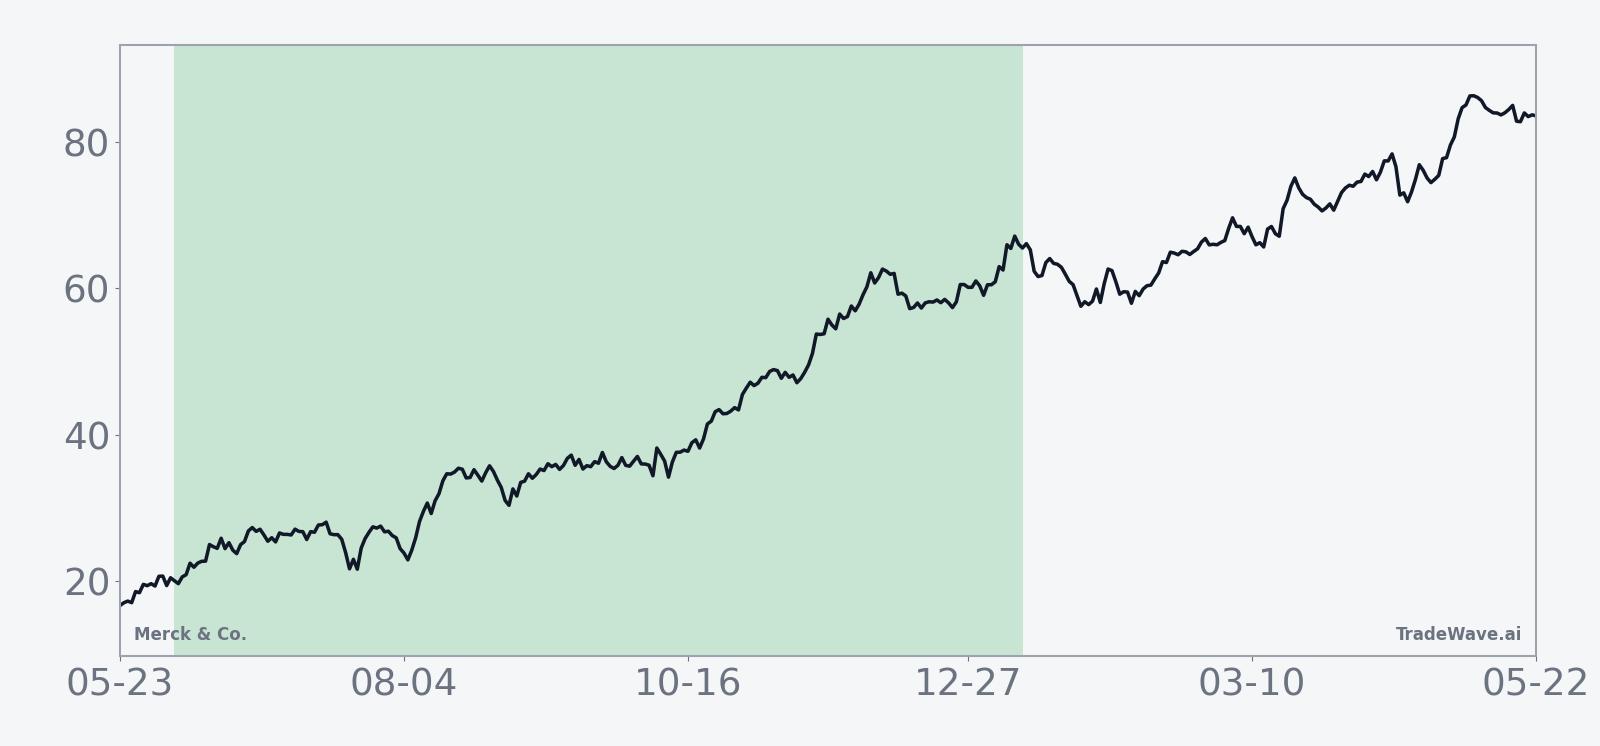
The historical seasonal average suggests that MRK’s gains in this window have tended to build steadily rather than in a single burst. Trend metrics show 70 long-biased days versus zero short-biased days across the window, and an even stronger 77-to-0 tilt when focusing on the most recent subset of years, hinting that the bullish bias has not faded in the modern era.
Year-by-year bars that include both peak rallies and worst drawdowns help frame how bumpy that path has been.
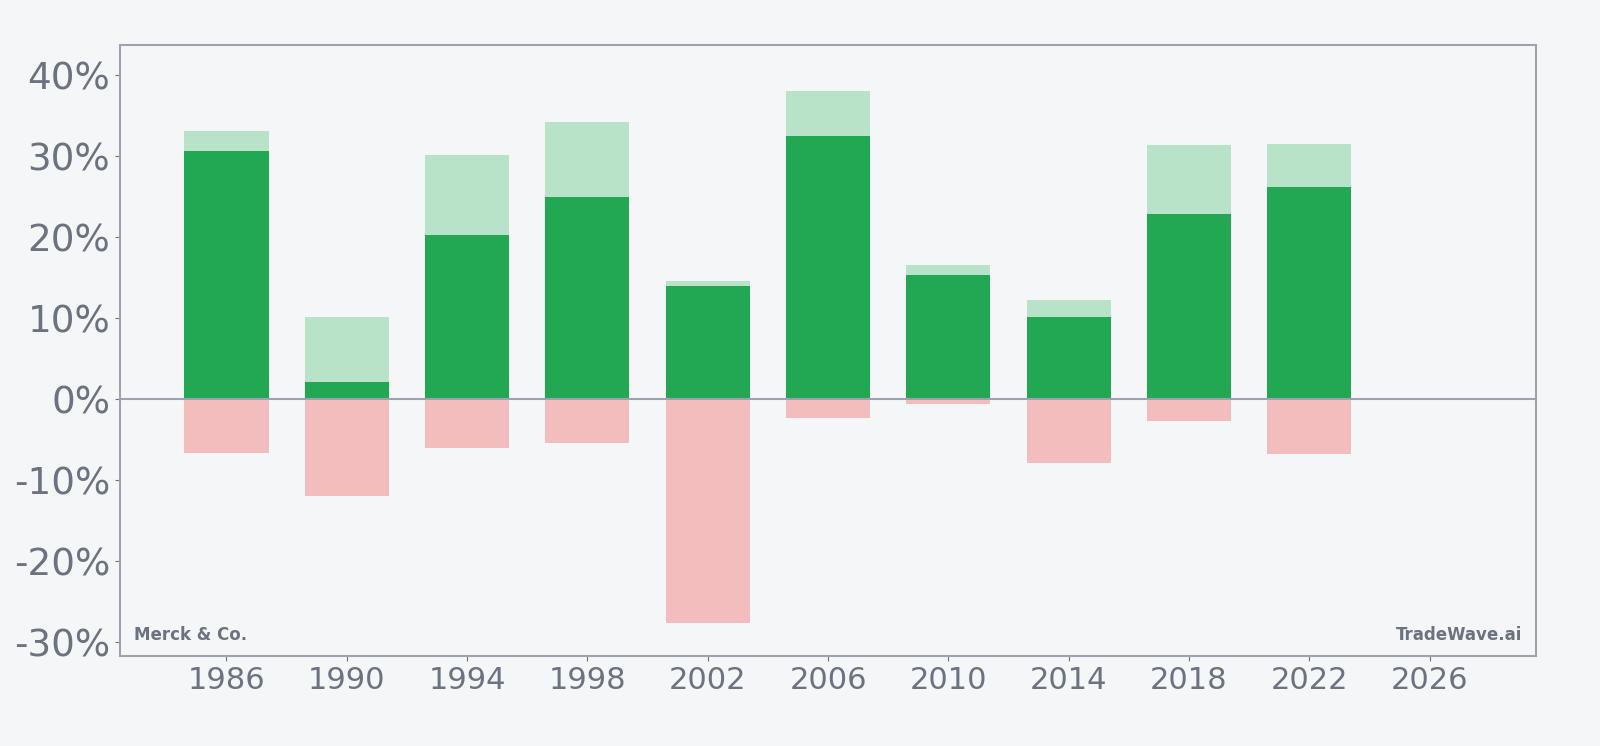
The maximum favorable move in strong years has often pushed above 30%, as in 1998, 2018 and 2022, showing how far MRK has historically run when the pattern is working. At the same time, maximum adverse excursions have occasionally been deep, with 2002 showing a worst drawdown of -27.63% even though the window still finished up 13.97%, a reminder that investors have had to sit through real volatility to capture the full seasonal effect.
History does not guarantee future results, and adverse excursions can be large even in windows that ultimately finish higher.
Why does Merck & Co. (MRK) follow this seasonal pattern?
One likely driver is the way Merck’s earnings calendar and drug trial milestones cluster in the back half of the midterm year and into the year before the presidential election, when risk appetite for healthcare has often improved. Institutional portfolio managers also tend to rebalance around policy clarity, rotating into defensive growth names like large-cap pharma as the macro picture for the next administration comes into focus. This MRK seasonal pattern may reflect that combination of earnings visibility, regulatory catalysts and election-cycle sector rotation rather than any single headline.
What is driving Merck & Co. (MRK) today?
Merck & Co. slipped 2.2% to $119.72 on Wednesday, leaving the stock about 3.5% below its 52-week high of $124 and up 5.6% so far in 2026. The move comes after a stretch in which Merck has leaned on oncology powerhouse Keytruda and a growing vaccine and infectious disease portfolio to offset looming patent expiries, while management has outlined a long-term plan to reach roughly $70 billion in annual revenue by the mid-2030s through cardiometabolic, respiratory and infectious disease growth drivers.[3]
The chart below situates the latest pullback against MRK’s past year of trading and a short-term seasonal projection.
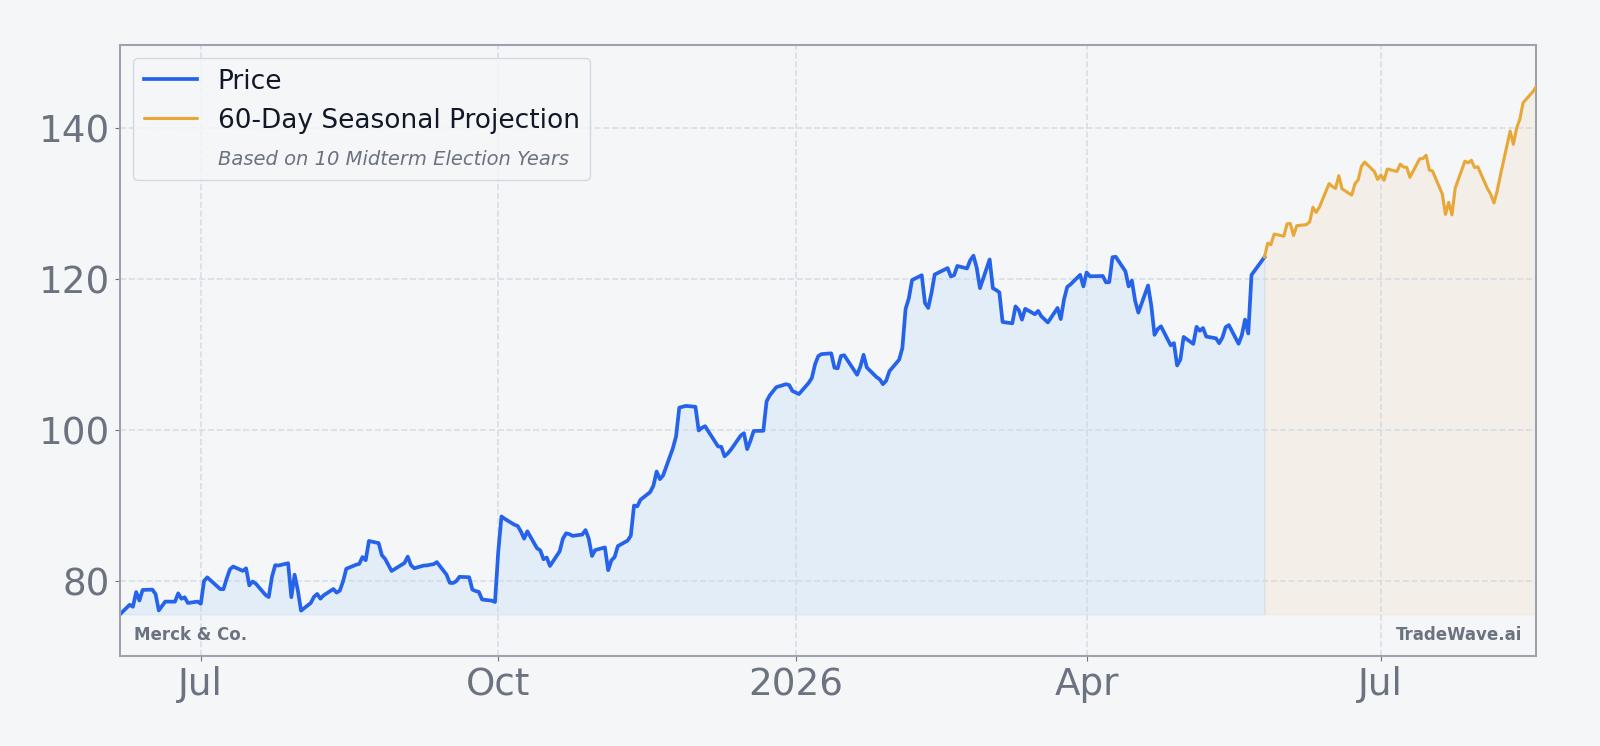
In late 2025, Merck’s Q3 results showed revenue of $17.28 billion versus $16.96 billion expected and non-GAAP EPS of $2.58 versus $2.35, driven by 10% growth in Keytruda sales to $8.1 billion and supported by Gardasil contributions.[2] Around the same time, the company tightened 2025 revenue guidance to $64.5 billion to $65.0 billion and projected EPS of $8.93 to $8.98, while also winning U.S. and European approvals that expanded Keytruda’s addressable market and introduced a subcutaneous formulation aimed at sustaining revenues beyond loss of exclusivity.[1][2]
In January 2026, Merck laid out a roadmap for “new growth opportunities” that could drive about $70 billion in annual revenue by the mid-2030s, with roughly $20 billion targeted from cardiometabolic and respiratory assets and $15 billion from infectious disease, reinforcing the idea that the company is trying to pivot from a single-drug story to a broader pipeline narrative.[3] For a stock that already trades near its 52-week high, that backdrop sets the stage for how investors may interpret any pullbacks or rallies as the powerful midterm-year seasonal window opens in early June.
What should traders watch as this MRK seasonal window approaches?
First, the calendar: the 219-day window begins on Jun 6 and runs deep into the year before the presidential election, a phase that has historically been friendlier to risk assets than the midterm year itself. How MRK behaves around that start date, especially if it retests or breaks above the $124 area, will show whether the stock is leaning into its historical seasonality or fighting it.
Second, volatility inside the window matters as much as direction. Past cycles have seen maximum adverse moves worse than -20% even when the final outcome was positive, so traders will be watching whether any drawdowns this time stay shallower than the 2002-style -27.63% or echo that kind of shakeout. A pattern of higher lows on pullbacks would be more consistent with the historical long bias than a deep, early-year air pocket.
Third, the policy and pipeline tape will be key. Regulatory decisions around oncology combinations, vaccine indications and infectious disease assets, along with any updates to the long-term $70 billion revenue ambition, will help determine whether fundamentals line up with the bullish seasonal backdrop.[3] If those catalysts land during the heart of the window and the stock responds with the kind of 20% to 30% maximum favorable moves seen in prior cycles, it would fit the established MRK trading window pattern.
Finally, traders should track how MRK trades relative to the broader healthcare sector and the S&P 500 as the U.S. election cycle advances. Outperformance during this window would echo the last 10 midterm-election-year patterns, while a sustained lag or a rare negative outcome would mark a clear break from the historical seasonality that has defined this name in similar phases of the cycle.
Sources
- Forbes, "Why Is Merck Stock Surging?", Nov 26, 2025
- Reuters, "Merck posts higher third-quarter sales as Keytruda growth offsets drop from Gardasil", Oct 30, 2025
- Reuters, "Merck says new growth opportunities to drive revenue of $70 billion by mid-2030s", Jan 13, 2026
- Forbes, "Is Merck Stock’s Run Legitimate?", Dec 24, 2025
About this seasonal analysis
Seasonal pattern data is sourced from TradeWave.ai, which analyzes historical price behavior across annual calendar windows going back up to 30 years. Read the full data methodology or the book The 100-Year Pattern by Afshin Moshrefi (2026 edition). Past performance of seasonal patterns does not guarantee future results. This article is for informational purposes only and does not constitute investment advice.