Merck & Co. (MRK) Has Risen in 10 of 10 Midterm Windows Starting Apr 27, Averaging 25% Gains
Merck & Co. is heading into a historically powerful midterm-election-year seasonal window just as the stock trades slightly above its 50-day average and investors weigh oncology growth against looming patent and M&A decisions.

What is the seasonal pattern for Merck & Co. (MRK)?
Merck & Co. has risen in 10 of 10 midterm-election-year windows starting around Apr 27, with an average gain of 25.06% in winning years.
- 10 for 10 in this window, with average winning-year gains of 25.06% across the last 10 midterm election years.
- The upcoming 259-day trading window begins Apr 27, 2026 and historically has been a strongly bullish MRK seasonal trend.
- Percent Profitable is 100%, with 10 winners and 0 losers in the historical sample.
- Average profit of 25.06% compares with a median gain of 26.16%, pointing to a consistently positive outcome profile.
- The TradeWave Ratio (TWR) of 2.09 indicates that price has typically traveled meaningfully in the long direction within the window, while intraperiod drawdowns have at times been sharp.
- Sharpe ratio of 1.93 signals strong risk-adjusted returns for this specific Merck & Co. trading window in prior midterm election years.
According to historical data from TradeWave.ai, this is not just another stretch on the calendar for Merck & Co.; the next midterm-year window has behaved very differently from an average year in past cycles.
How has Merck & Co. (MRK) traded in past midterm-year windows?
Merck & Co. has risen in every one of the last 10 midterm-election-year windows that start around Apr 27 and run for 259 trading days, averaging gains of 25.06%. Today the stock closed at 119.07, up 3.1% on the session, leaving it roughly in line with its 50-day moving average of 119.13 and up 5.6% year to date.
The presidential election cycle matters here because this pattern is built only from midterm election years, a phase that often brings policy uncertainty, drug-pricing rhetoric and shifting risk appetite for large pharmaceutical stocks. Grouping Merck’s behavior by this part of the cycle isolates how the stock has traded when Washington is focused on mid-cycle fiscal debates rather than campaign promises or post-election resets.
Across those 10 midterm-year samples, the trade direction is long and the record is clean: 10 winners, 0 losers, for a Percent Profitable reading of 100%. Average profit of 25.06% and a median gain of 26.16% show that the typical outcome has not been a marginal drift higher but a substantial move, with an 800% cumulative return across all windows.
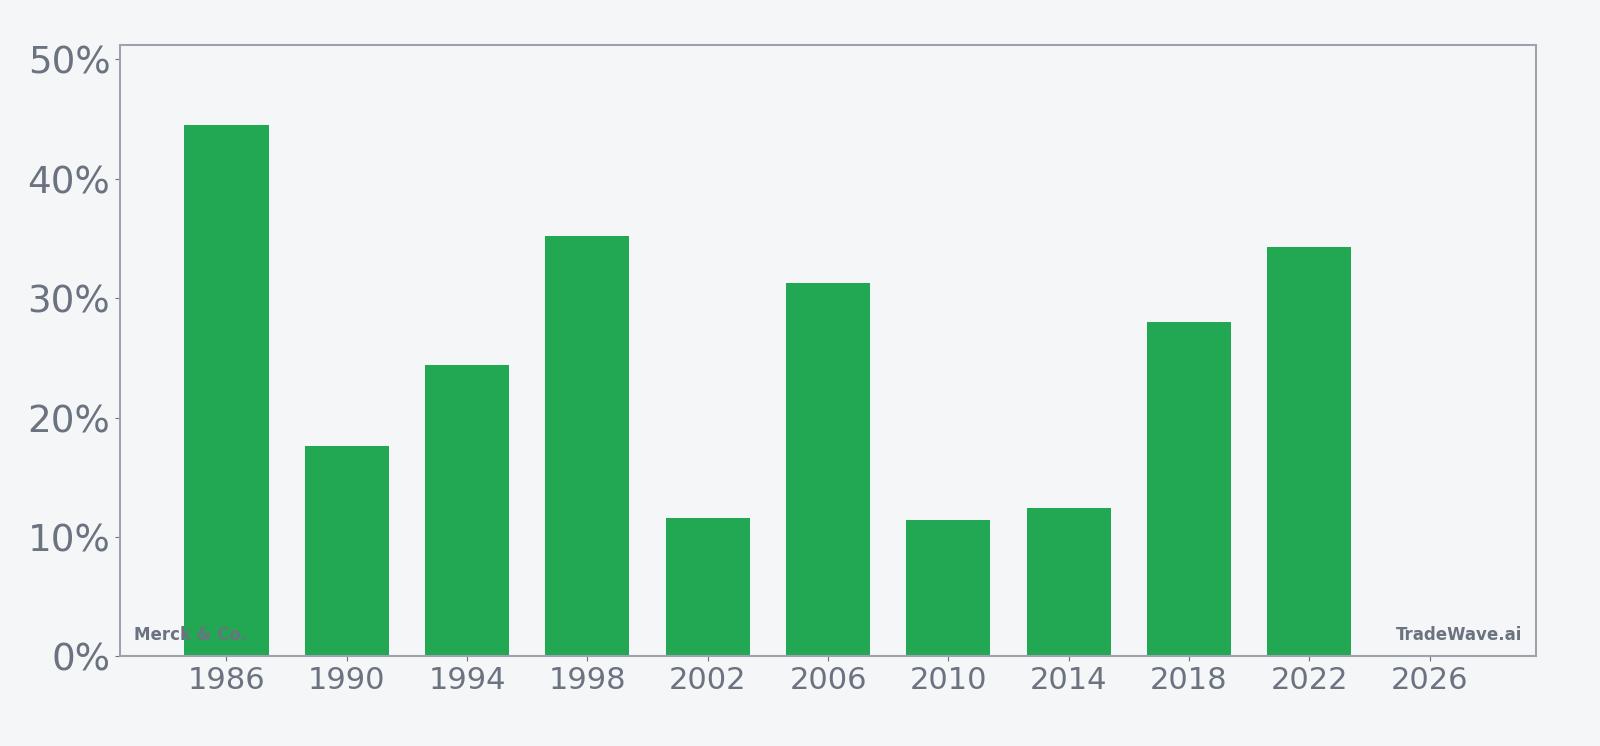
The per-year table shows how that strength has played out in individual cycles. The weakest outcome came in 2002, with an 11.62% net gain and a maximum favorable move of 12.18%, but that year also carried the deepest intraperiod drawdown, with a maximum adverse move of -29.12% from entry. On the other side of the spectrum, 1986 delivered a 44.53% net return with a 47.36% best run-up and only a -4.96% worst drawdown, while 2022 posted a 34.3% gain with a 39.97% best run-up and just -0.81% worst drawdown.
The MFE/MAE profile across years tells a clear story about volatility inside the window. In strong years like 1998 and 2022, Merck & Co. not only finished higher but also spent much of the window in positive territory, with maximum favorable moves in the mid-30% to mid-40% range and very limited downside excursions. In more stressful years such as 2002 and 2010, the stock still ended up, but traders had to sit through double-digit drawdowns before the long bias reasserted itself.
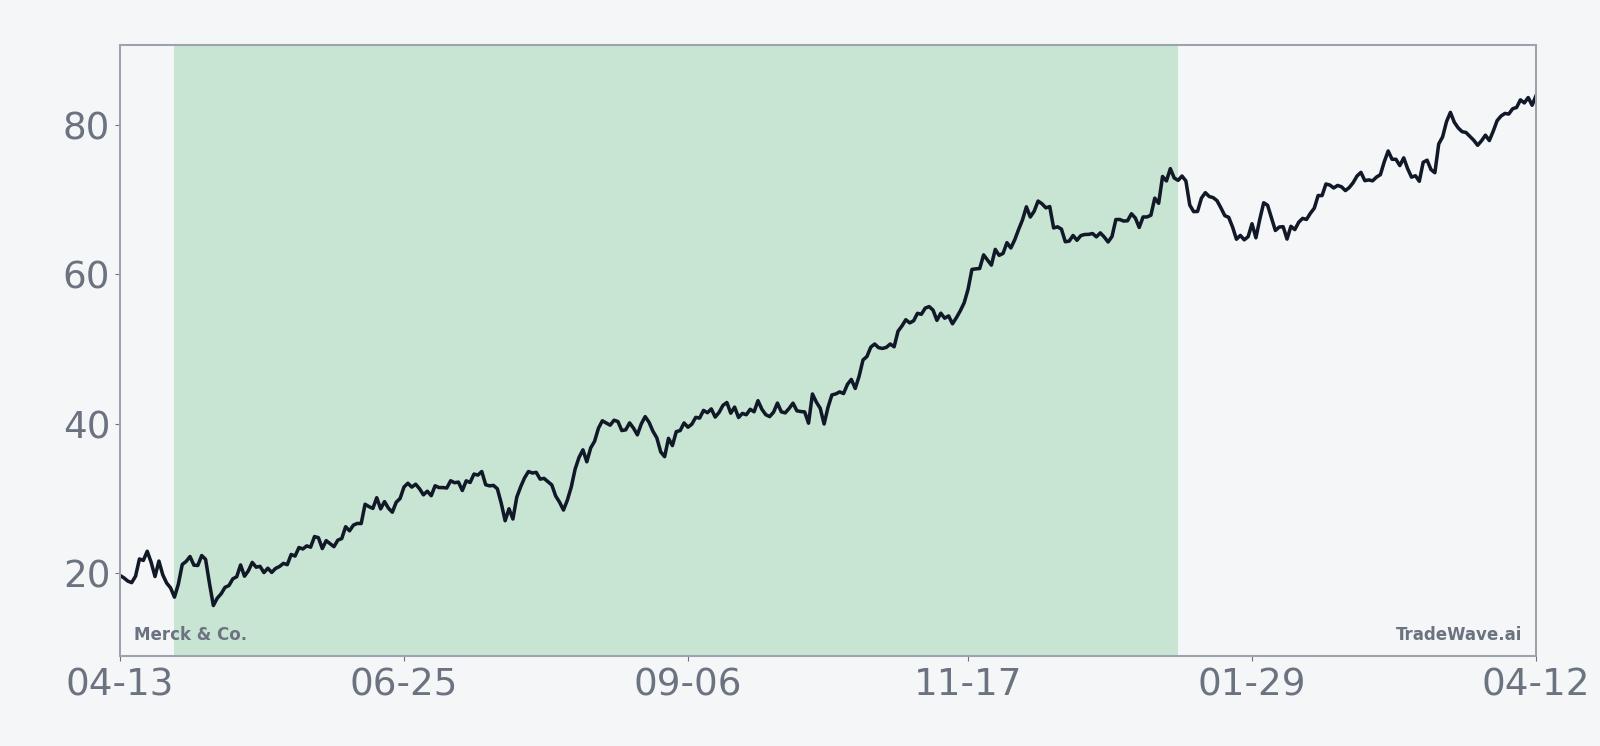
The historical seasonal average trend line slopes higher through most of the 259-day span, with gains tending to build rather than arrive in a single burst. The pattern suggests that in prior midterm years, strength has often persisted well beyond the initial weeks of the window, which is consistent with the high average and median returns.
A second view that layers in best and worst intraperiod swings shows how much room Merck & Co. has historically had to run or retrace before the window closes.
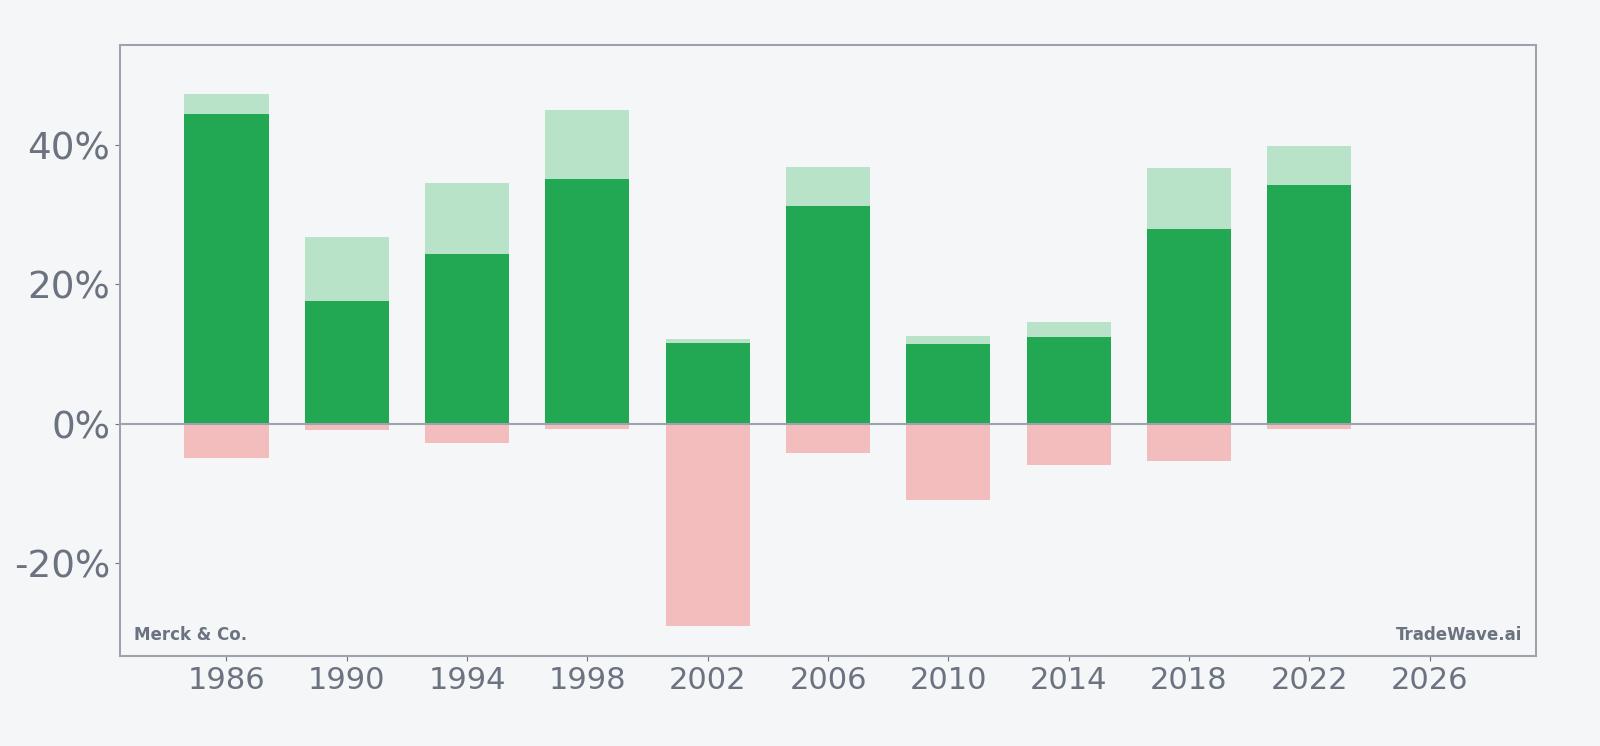
The stacked net, MFE and MAE bars highlight a key nuance: even in a 10-for-10 winning window, intraperiod downside has sometimes been meaningful, with several years showing adverse moves of -5% to -10% and one year near -30% before recovering. Add it up and the most important takeaway is simple: this has been a powerful long-biased window for Merck & Co., but the path has not always been smooth.
History does not guarantee future results; adverse excursions can be large even in winning windows, and traders should treat this pattern as context rather than a forecast.
Why does Merck & Co. (MRK) follow this seasonal pattern?
This midterm-year pattern may reflect how large healthcare investors reposition around policy risk and earnings visibility. One likely driver is the clustering of Merck’s late-year oncology data, regulatory decisions and guidance updates, which can pull capital into the name once midyear political noise starts to clear. Sector rotation into defensive growth stocks like big pharma during mid-cycle macro slowdowns may also help explain why this specific slice of the calendar has repeatedly favored longs.
What is driving Merck & Co. (MRK) today?
Merck & Co. finished Monday at 119.07, up 3.1% on the day, extending its one-month gain to 4.26% and leaving the stock almost exactly on top of its 50-day moving average of 119.13. That puts shares about 4.8% below their 52-week high of 125.14 and well above the 52-week low near 69.28, a range that underscores how much the stock has already rerated over the past year.
The fundamental backdrop remains dominated by oncology. In October 2025, Merck reported third-quarter revenue of $17.28 billion, ahead of estimates, with non-GAAP EPS of $2.58 as Keytruda sales climbed 10% to $8.1 billion and helped offset weaker Gardasil performance.[3] Management narrowed full-year revenue guidance to a range of $64.5 billion to $65.0 billion, signaling confidence in the near-term pipeline even as investors look ahead to Keytruda’s eventual patent expiration.[3]
Strategic deal-making has added another layer to the story. On Jan 10, 2026, reports highlighted that Merck was in talks to acquire Revolution Medicines in a transaction valued around $30 billion, a move aimed at bolstering its oncology pipeline with targeted therapies.[4] More recently, on Mar 25, 2026, Reuters reported that Merck was nearing a $6 billion all-cash acquisition of Terns Pharma to further expand its cancer portfolio, underscoring the company’s urgency in diversifying beyond Keytruda as exclusivity winds down.[6]
Those M&A headlines sit on top of a prior wave of positive catalysts. In November 2025, the FDA approved a combination of Keytruda with Padcev for muscle-invasive bladder cancer, broadening the drug’s label and reinforcing its role as a backbone immunotherapy.[1] The same day, Wells Fargo upgraded Merck to Overweight, citing pipeline progress and growth confidence, while the company also launched a subcutaneous formulation of Keytruda in the European Union that could help sustain revenue even as competitive pressures build.[1]
The chart below situates the latest move in its recent multi-month context, alongside a short-term seasonal projection.
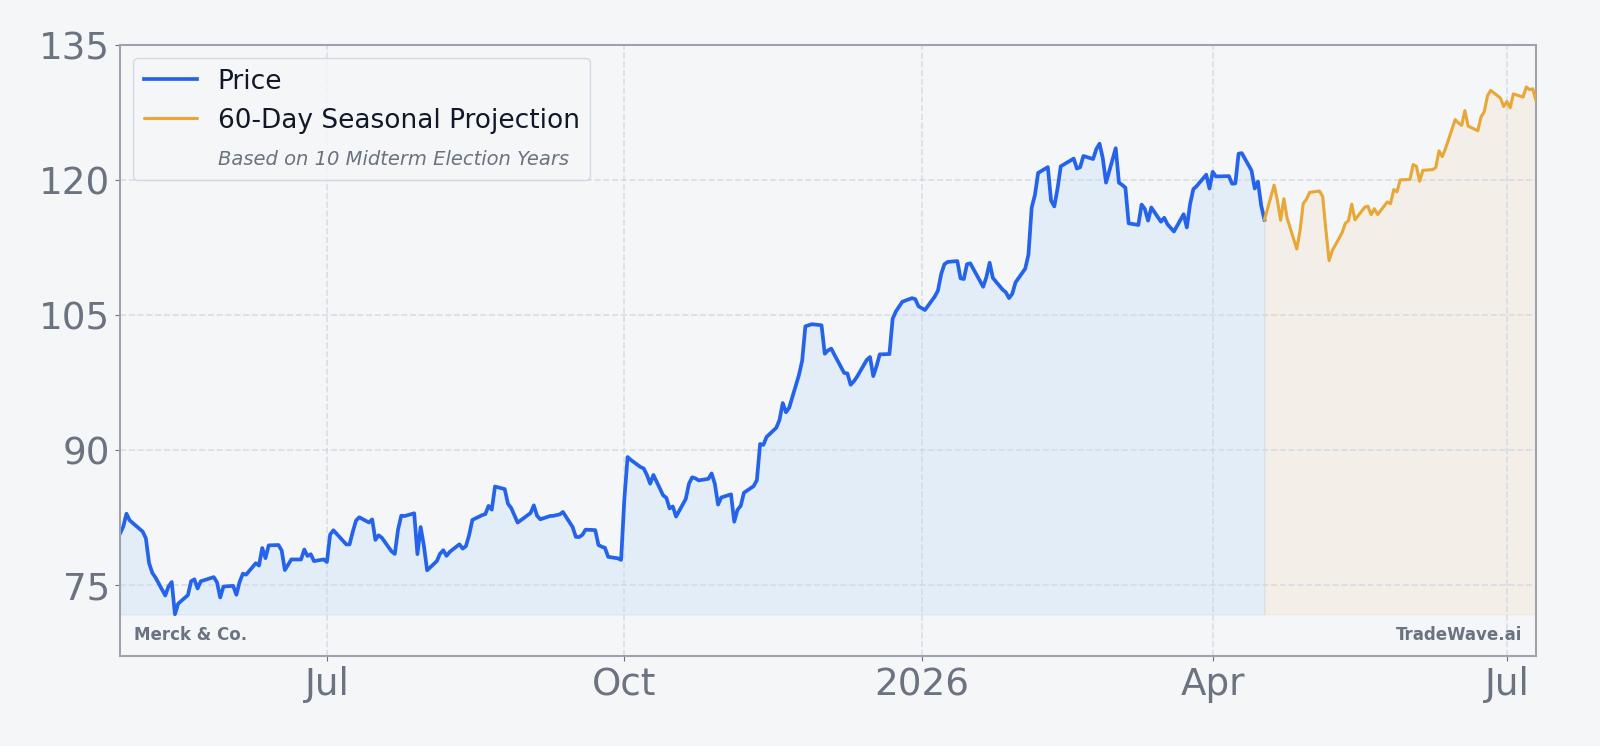
From a positioning standpoint, Merck & Co. sits in a familiar big-pharma role as a defensive growth anchor for many portfolios, especially when macro uncertainty rises. The combination of a strong oncology franchise, active deal pipeline and a historically powerful midterm-year seasonal window means traders will be watching whether any pullbacks into late April and early May resemble the temporary drawdowns seen in past cycles or mark a break from the pattern.
Sources
- [1] Forbes – “Why Is Merck Stock Surging?” (Nov 26, 2025)
- [2] Forbes – “Should You Buy MRK Stock At $80?” (May 26, 2025)
- [3] Reuters – “Merck posts higher third-quarter sales as Keytruda growth offsets drop from Gardasil” (Oct 30, 2025)
- [4] Seeking Alpha – “Key deals this week: Merck, Glencore, CrowdStrike, Marvell Technology, Steel Dynamics and more” (Jan 10, 2026)
- [5] Forbes – “Is Merck Stock’s Run Legitimate?” (Dec 24, 2025)
- [6] Reuters – “Merck nears $6 billion acquisition of Terns Pharma to boost cancer portfolio, FT reports” (Mar 25, 2026)
About this seasonal analysis
Seasonal pattern data is sourced from TradeWave.ai, which analyzes historical price behavior across annual calendar windows going back up to 30 years. Read the full data methodology or the book The 100-Year Pattern by Afshin Moshrefi (2026 edition). Past performance of seasonal patterns does not guarantee future results. This article is for informational purposes only and does not constitute investment advice.