10-for-10: Merck & Co. (MRK) Has Gained Every Midterm in This 218-Day Window
Merck & Co. is approaching a 218-day midterm-year seasonal window that has never produced a loss in the last 10 cycles, just as the stock trades near its 52-week high.

What is the seasonal pattern for Merck & Co. (MRK)?
Merck & Co. has risen in 10 of 10 midterm-year windows starting around Jun 7, with an average gain of 20.26% in winning years.
- 10 for 10 record in this window, with average gains of 20.26% across all winning years.
- Seasonal window begins Jun 7 and runs 218 trading days, covering the back half of the midterm election year into the following spring.
- Percent Profitable is 100%, with 10 winners and 0 losers across the last 10 midterm election years.
- Typical winning years have seen median gains of 21.26%, with a cumulative return of 514% across the sample.
- Intraperiod swings have been meaningful, with some years showing double-digit drawdowns even as the trade finished higher.
- Trade Direction is long, with a TradeWave Ratio of 2.25 and a Sharpe ratio of 1.89, pointing to historically strong risk-adjusted performance.
According to historical data from TradeWave.ai, this upcoming stretch has behaved very differently from an average year for Merck & Co., with a clear midterm-election flavor to the pattern.
How strong is Merck & Co. (MRK) in this midterm-year seasonal window?
Merck & Co. has posted gains in every one of the last 10 midterm election years during the 218-day window that starts around Jun 7, averaging a 20.26% advance. Shares finished Thursday at $120.51, up 5.1% on the day and about 2.8% below their 52-week high of $124.00.[1] That puts the stock near the top of its one-year range just as it heads into what has historically been one of its most favorable stretches on the calendar.
Grouping the data by the presidential election cycle matters here because this window only looks at midterm election years, which often feature shifting policy expectations, drug-pricing debates and budget negotiations that can hit large pharmaceutical stocks differently than the broader market. In this slice of the cycle, Merck’s historical seasonality has leaned consistently bullish, even in years when macro conditions were choppy.
The trade direction for this pattern is long, and the track record is unusually clean. Percent Profitable sits at 100%, with 10 winners and 0 losers across the last 10 midterm election years, and the median gain is 21.26%. Average profit across all those years is 20.26%, while the annualized return for the window clocks in at 19.92%, pointing to a strong MRK seasonal trend rather than a one-off outlier.
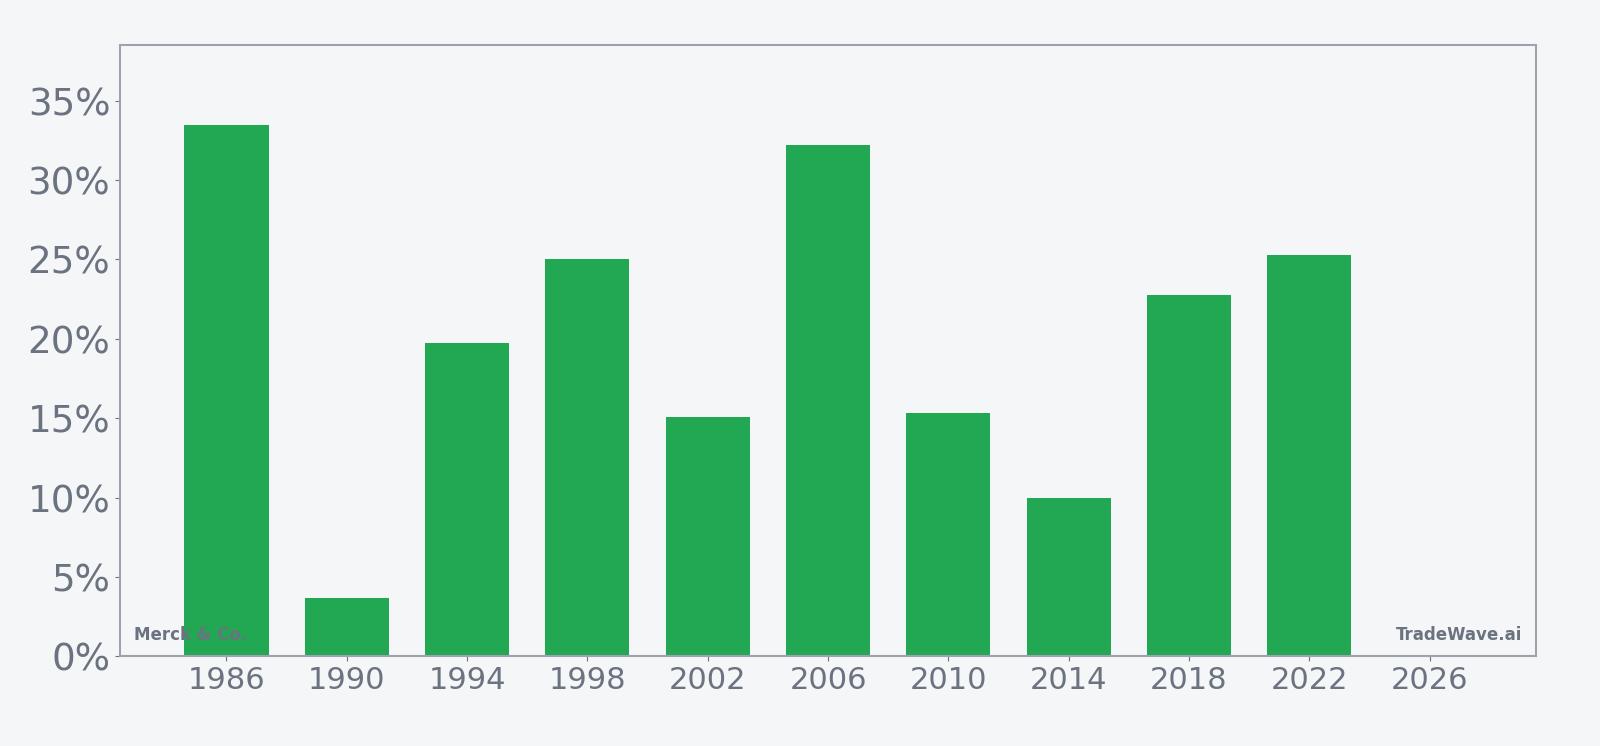
The per-year table shows how that strength has played out. The weakest outcome in the sample was 1990, when the stock still gained 3.68% in the window, while stronger years such as 1986, 2006 and 2022 delivered returns between roughly 25% and 33.49%. Add it up and the cumulative return across the 10 midterm-year windows is 514%, a hefty contribution for a defensive healthcare name.
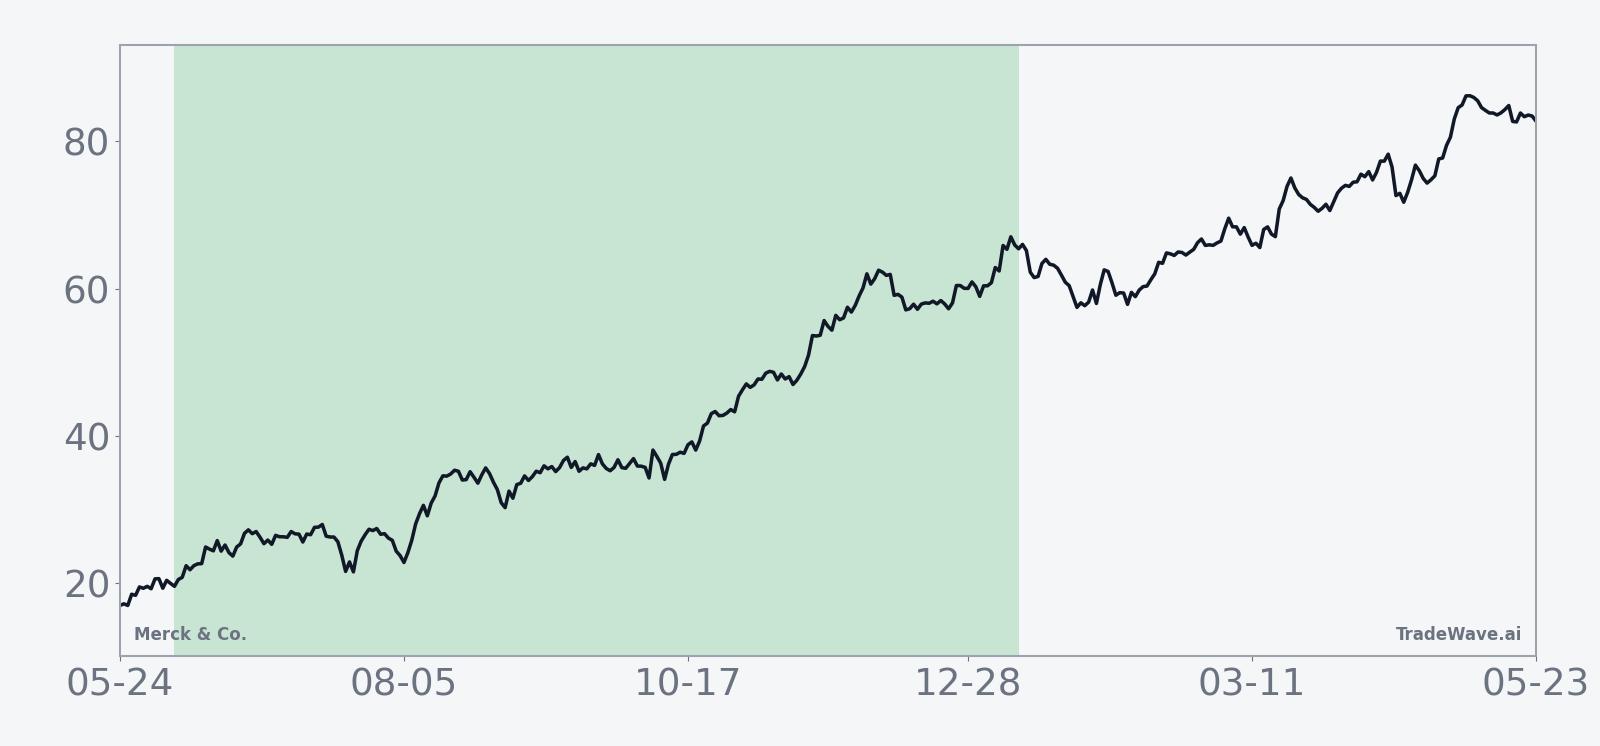
The historical seasonal average suggests gains tend to build steadily rather than in a single burst. In several years, including 1998, 2018 and 2022, the maximum favorable move arrived well before the end of the window, which means traders who followed the MRK seasonal pattern often saw sizable unrealized gains before the final close.
A closer look at yearly net returns and intraperiod swings shows how upside and drawdowns have coexisted in this window.
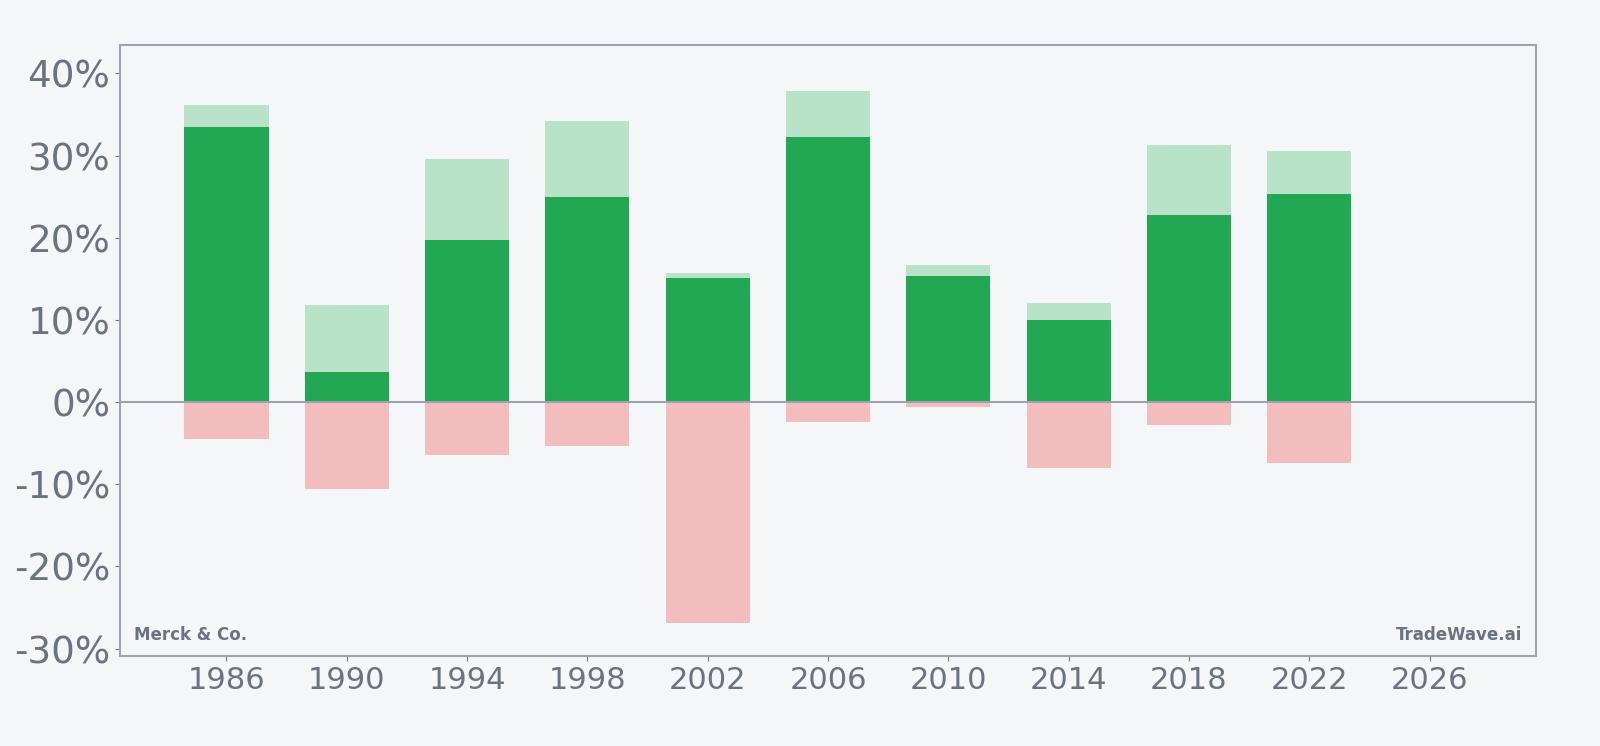
The bars with maximum favorable and adverse excursions underline that this has been a strong but not risk-free stretch. In 2002, for example, the trade finished up 15.1%, yet the worst intraperiod drawdown reached about -26.92% from the entry, while years like 2006 saw a smoother path with a 32.23% gain and only a -2.47% adverse move. That mix of large upside potential and occasional deep pullbacks is captured in the TradeWave Ratio of 2.25 and a Sharpe ratio of 1.89, which together point to historically attractive risk-adjusted returns for a long setup.
History does not guarantee future results; even in windows where every past trade finished higher, adverse excursions can be large and uncomfortable before the final outcome.
Why does Merck & Co. (MRK) follow this seasonal pattern?
One likely driver is the way Merck’s earnings calendar and drug trial milestones cluster in the back half of the midterm election year and into the following spring, when guidance updates and regulatory decisions often land. Analysts have also pointed to institutional portfolio repositioning around healthcare during midterm years, as investors seek defensive growth while policy risk around drug pricing and reimbursement is repriced. This MRK trading window may also reflect broader sector rotation, with large-cap pharma benefiting when macro uncertainty and election noise push money toward stable cash-flow generators.
What is driving Merck & Co. (MRK) today?
Merck & Co. closed Thursday at $120.51, up 5.1% on the session, extending its one-month gain to 5.9% and leaving the stock about 2.8% below its 52-week high of $124.00.[1] The move adds to a 5.6% advance year to date and comes after a stretch in which investors have focused on the durability of Keytruda and the company’s push into new growth areas such as cardiometabolic and infectious disease therapies.[1][3]
In Q3 2025, Merck reported revenue of $17.28 billion and adjusted EPS of $2.58, topping analyst estimates and narrowing full-year revenue guidance to a range of $64.5 billion to $65.0 billion, with expected EPS of $8.93 to $8.98.[2] Keytruda sales rose 10% to $8.1 billion in that quarter, offsetting weaker Gardasil revenue and reinforcing the company’s oncology leadership even as investors weigh eventual loss of exclusivity.[2]
On the strategic side, Merck has outlined a long-term plan to generate about $70 billion in revenue from new growth drivers by the mid-2030s, with a larger contribution expected from cardiometabolic, respiratory and infectious disease franchises.[3] That ambition sits alongside a steady stream of product news, including regulatory approvals and positive trial readouts for Keytruda combinations and new formulations that could help smooth the revenue curve as older indications mature.[1][4]
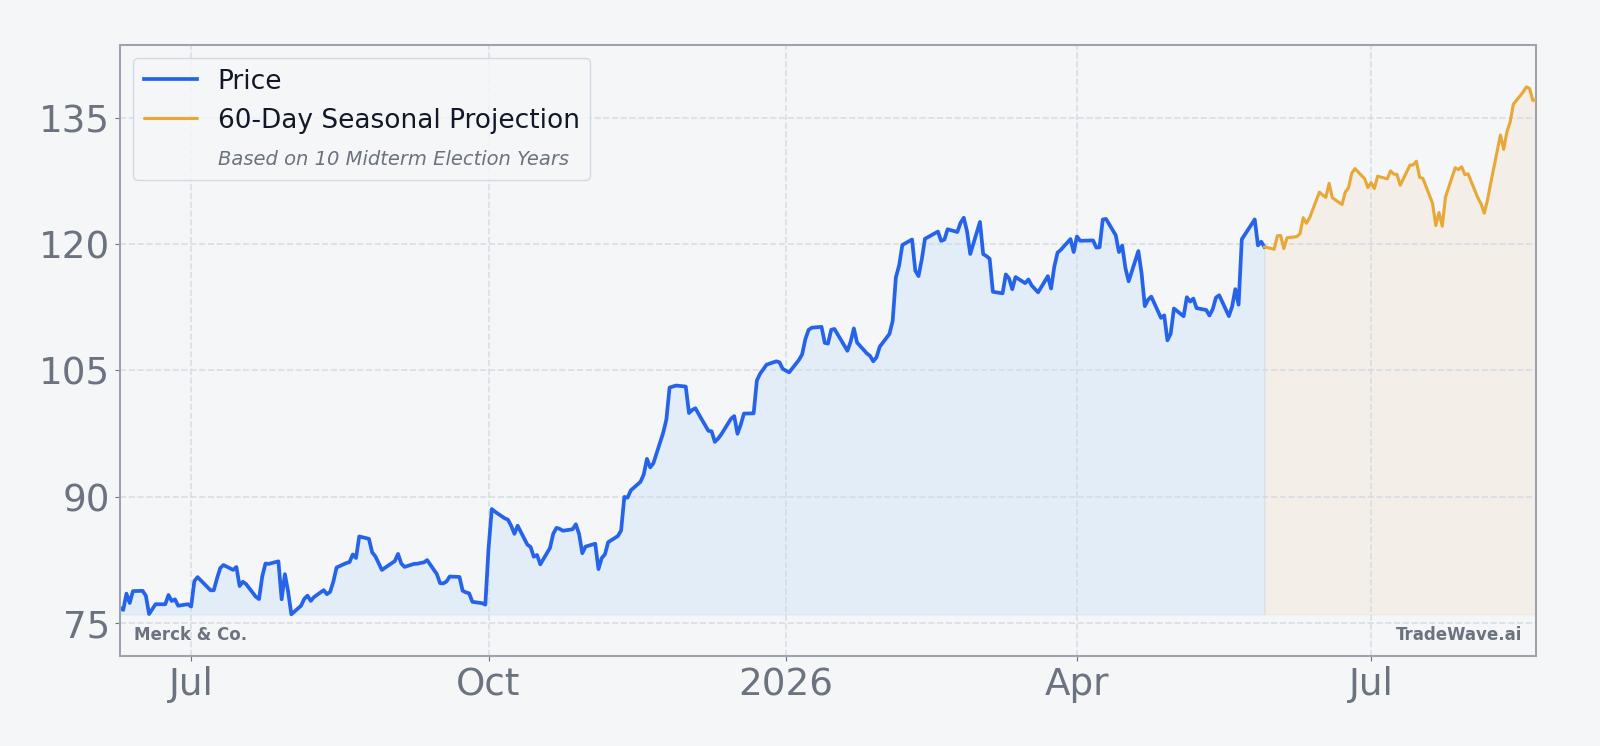
The chart below situates the latest move in its recent multi-month context, alongside a 60-day seasonal projection.
What should traders watch as this Merck & Co. seasonal window opens?
First, the calendar. The 218-day MRK seasonal window tied to midterm election years begins on Jun 7 and runs deep into the following spring, overlapping multiple earnings reports and potential regulatory decisions. Historically, the strongest years have seen gains build over time rather than spike early, so how the stock behaves in the first few months of the window will be an important tell.
Second, levels. With Merck trading just below its 52-week high, how the stock handles the $124 area will matter for sentiment around this MRK seasonal trend.[1] A sustained break above that zone during the window would be consistent with prior strong cycles, while repeated failures there would mark a departure from the historical pattern.
Third, catalysts. Upcoming earnings updates, any changes to long-term revenue guidance and fresh data from the oncology and cardiometabolic pipelines will all intersect with this Merck & Co. trading window.[2][3][4] Traders will be watching whether positive news continues to arrive in clusters, as it often has in past midterm years, or whether the flow turns more mixed.
Finally, volatility. Past windows show that even winning years can feature sharp drawdowns, as in 2002 when the worst intraperiod drop exceeded -20% before the trade finished higher. If similar swings appear this time, the key question will be whether they look like temporary shakeouts inside a still-intact historical seasonality pattern, or the start of a break from a 10-for-10 record that has so far favored the bulls.
Sources
- [1] Forbes – “Why Is Merck Stock Surging?” (Nov 26, 2025)
- [2] Reuters – “Merck posts higher third-quarter sales as Keytruda growth offsets drop from Gardasil” (Oct 30, 2025)
- [3] Reuters – “Merck says new growth opportunities to drive revenue of $70 billion by mid-2030s” (Jan 13, 2026)
- [4] Forbes – “Is Merck Stock’s Run Legitimate?” (Dec 24, 2025)
About this seasonal analysis
Seasonal pattern data is sourced from TradeWave.ai, which analyzes historical price behavior across annual calendar windows going back up to 30 years. Read the full data methodology or the book The 100-Year Pattern by Afshin Moshrefi (2026 edition). Past performance of seasonal patterns does not guarantee future results. This article is for informational purposes only and does not constitute investment advice.